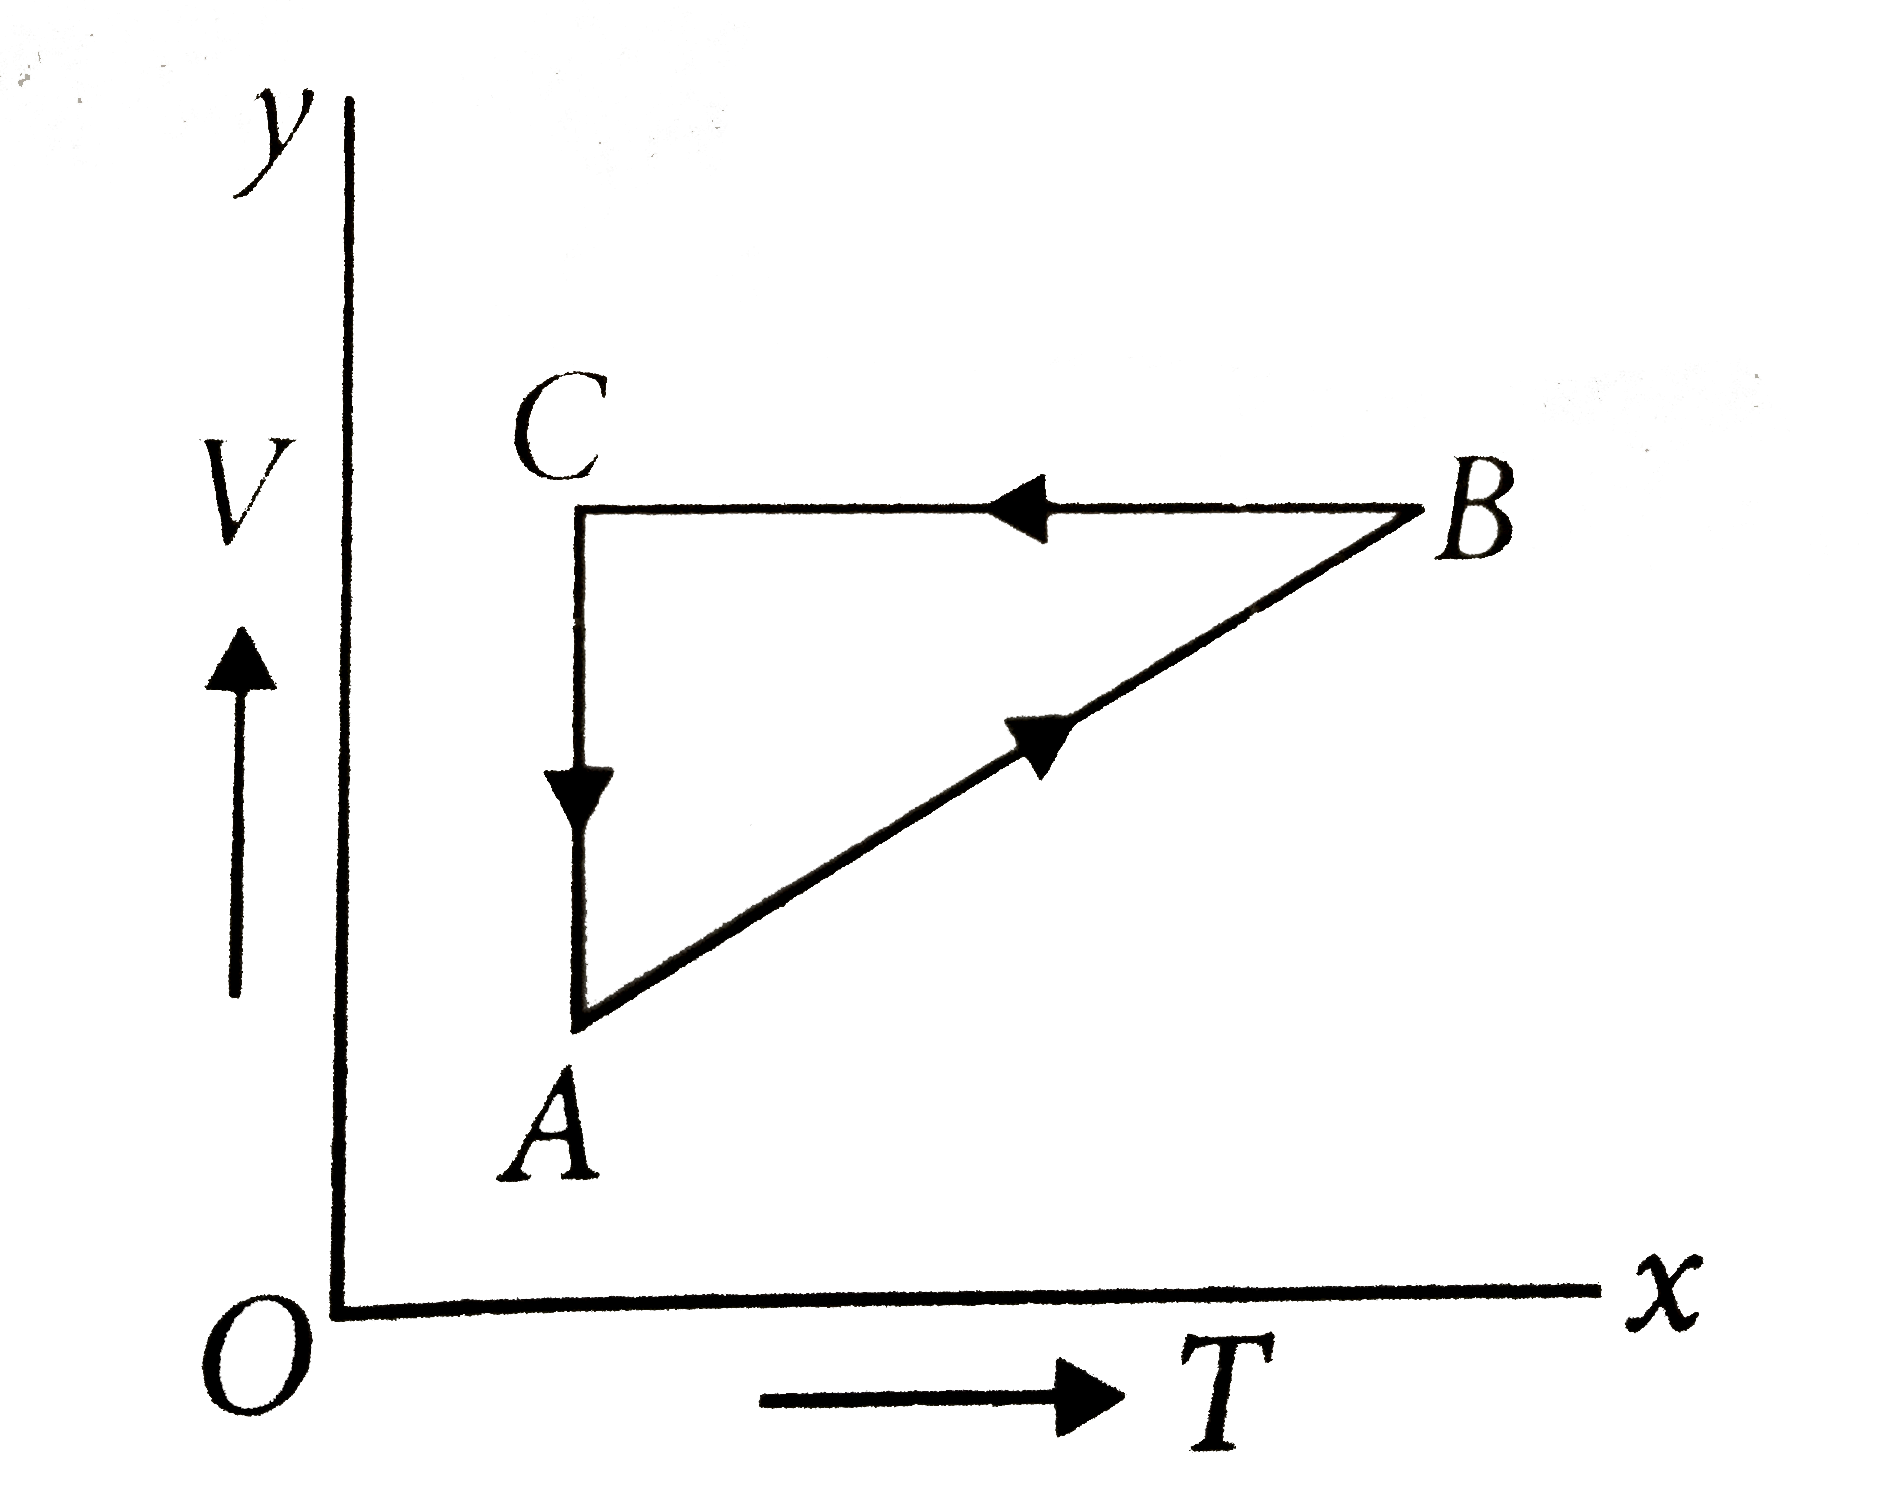
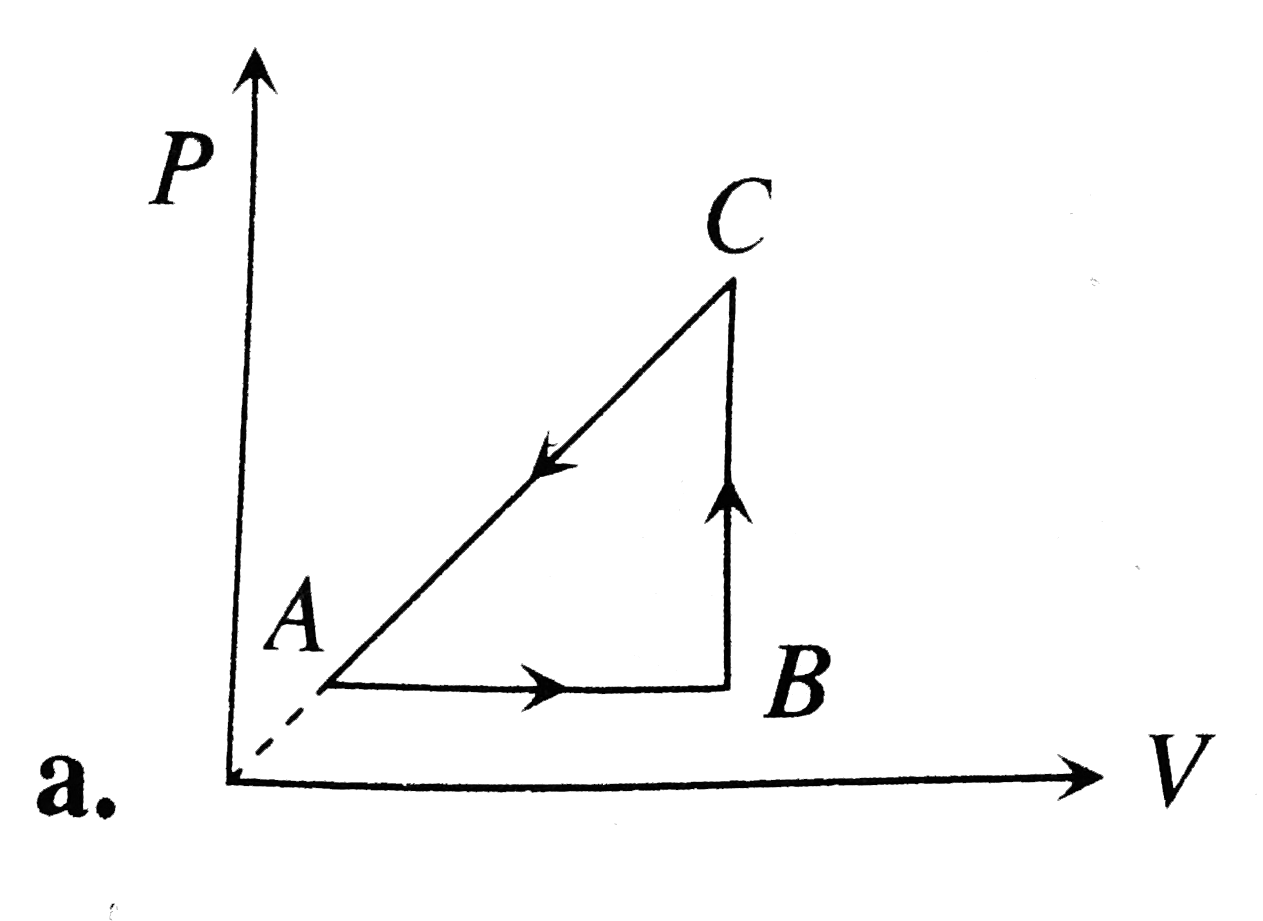
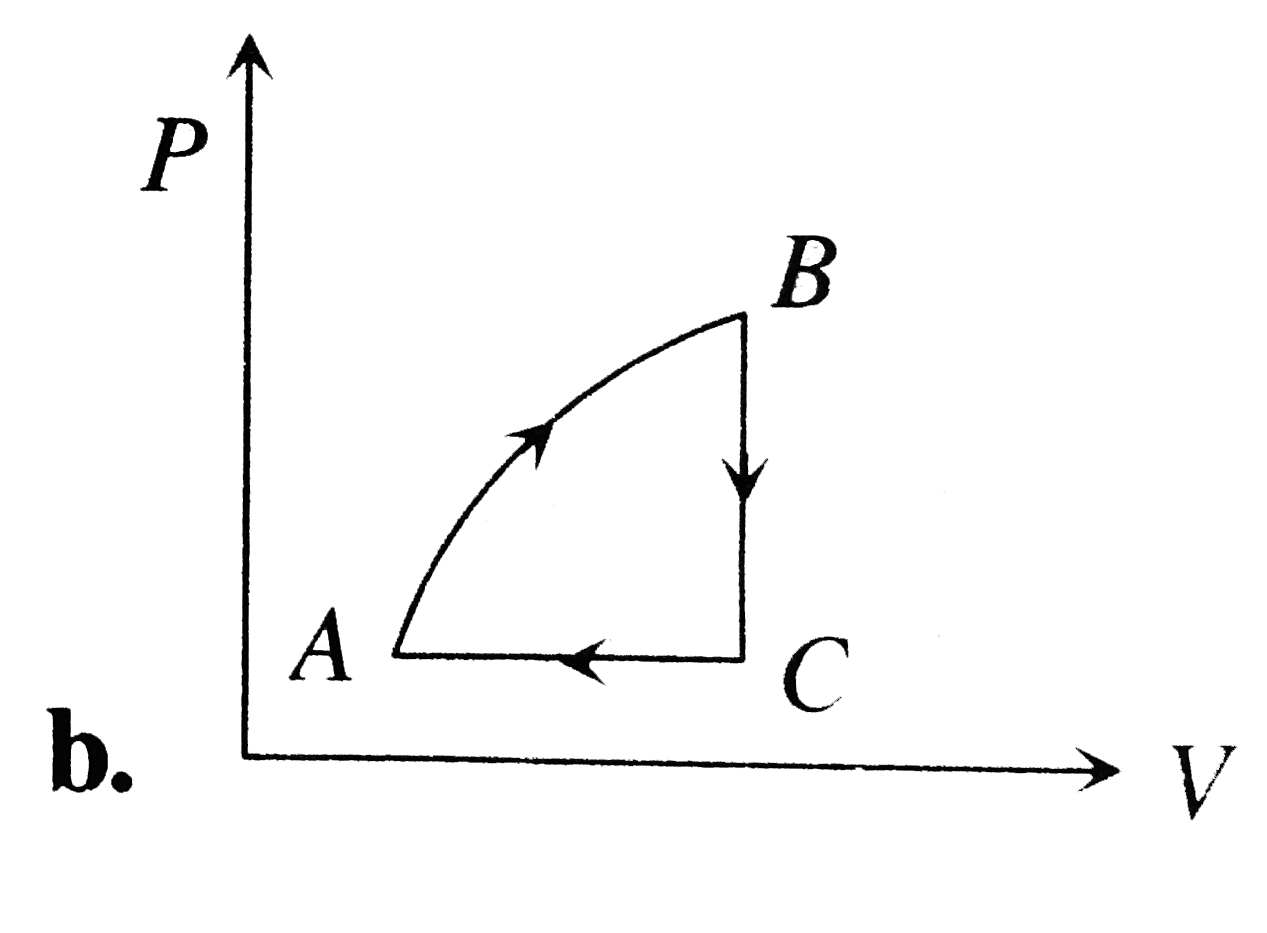
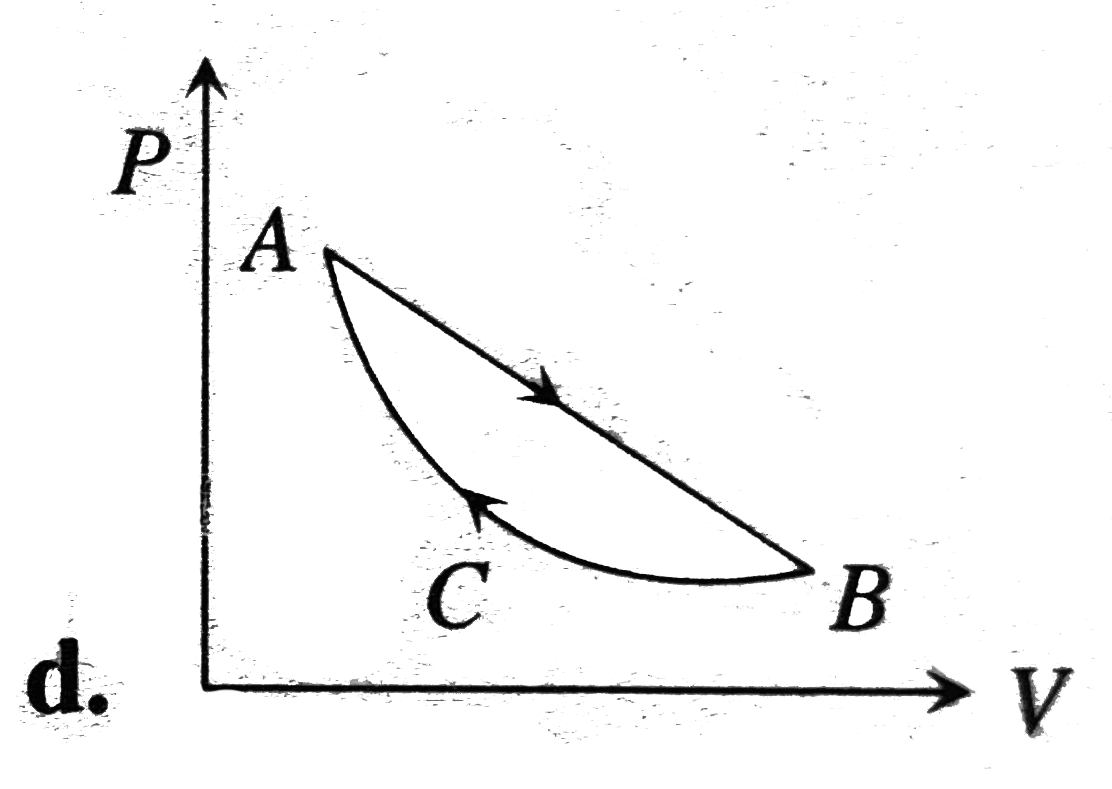
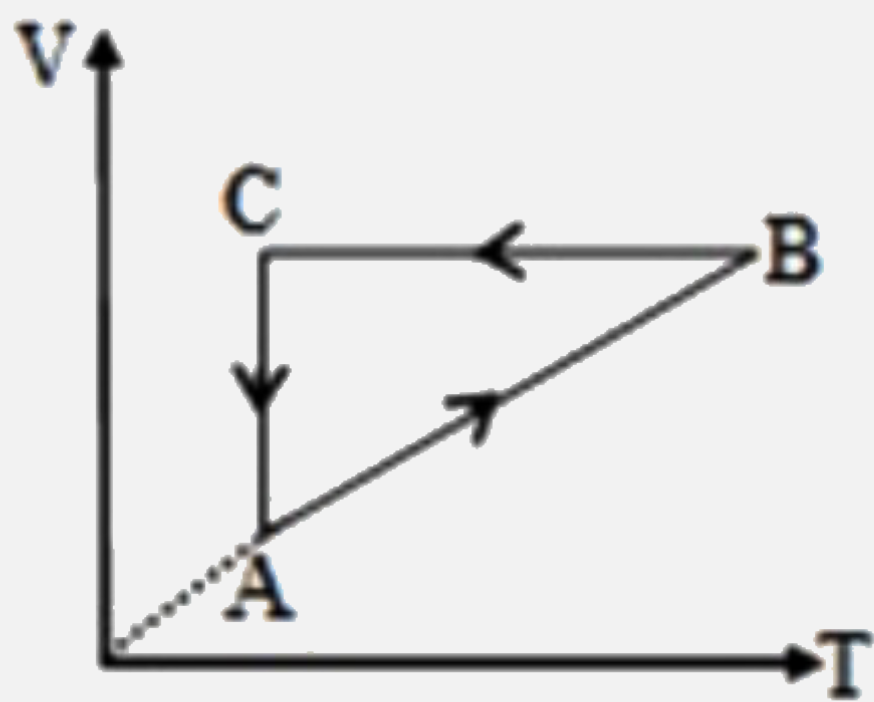
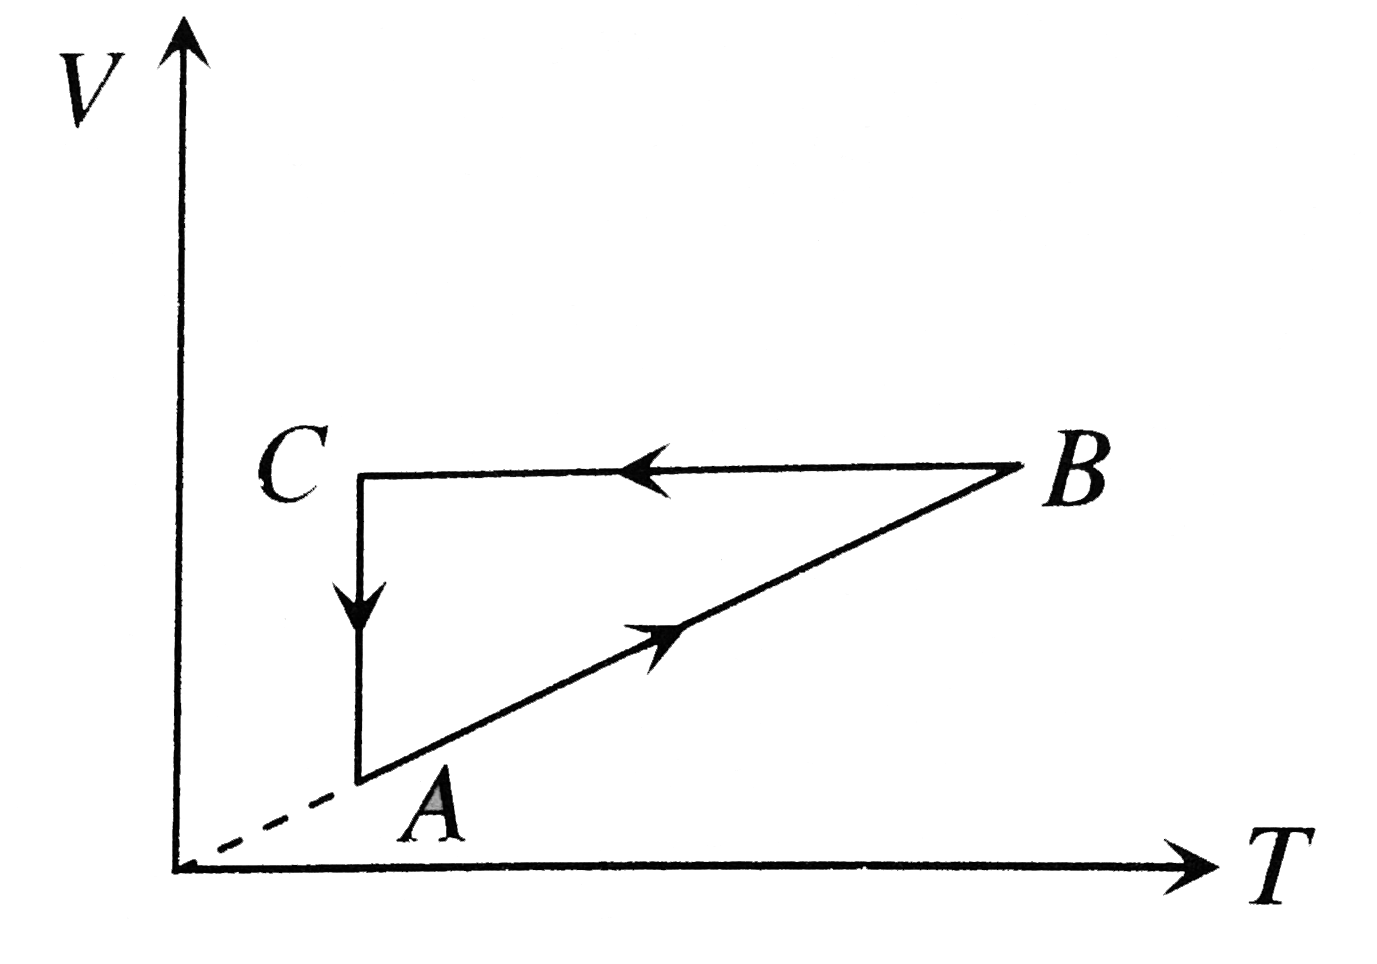
A cyclic process ABCA shown in V-T diagram, is performed with a constant mass of an ideal gas. Which of the following graphs in figure represents the corresponding process on a P-V diagram?
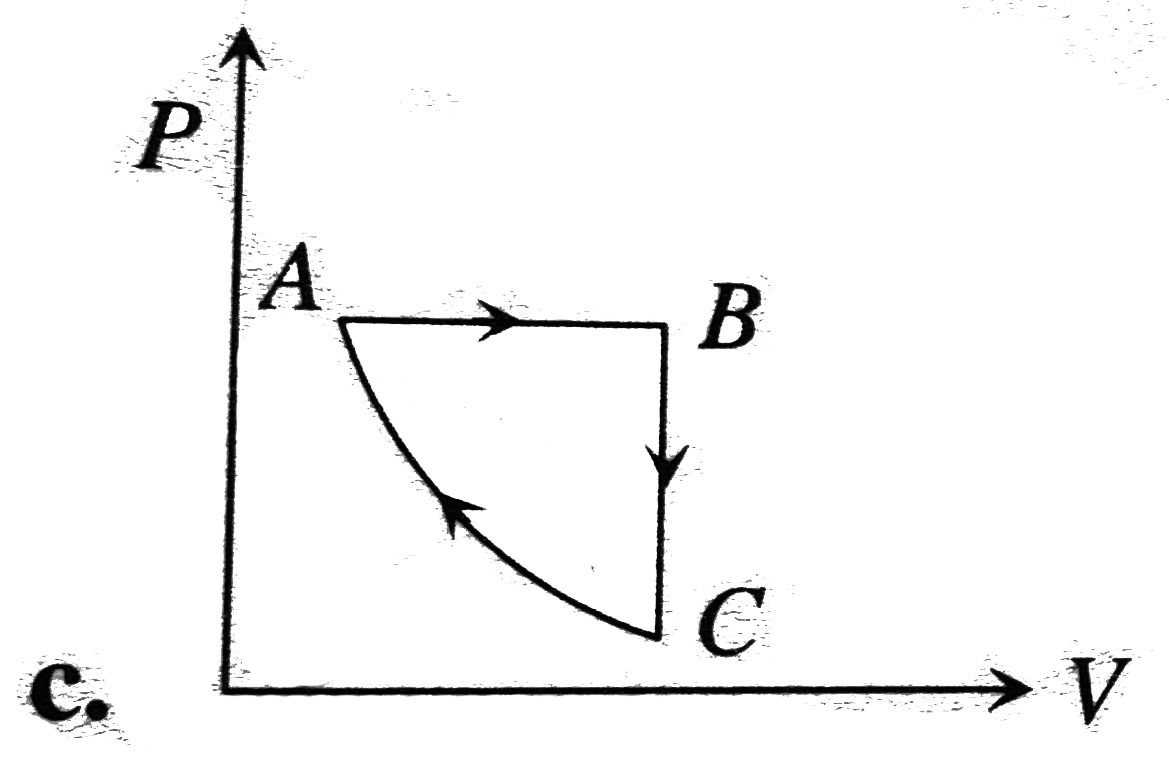
The correct Answer is:C
c. Form the given V−T diagrams, we can seed that in process AB,V∝T. Therefore pressure is constant (as quantity of the gas remains same).
In process BC,V = constant and in process CA
T= constant.
Therefore these processes are correctly represented on P−V diagram by graph (c),
Topper's Solved these Questions
- KINETIC THEORY OF GASES AND FIRST LAW OF THERMODYNAMICSBOOK - CENGAGE PHYSICS ENGLISHCHAPTER - KINETIC THEORY OF GASES AND FIRST LAW OF THERMODYNAMICSEXERCISE - Multiple Corrects
29 Videos
- KINETIC THEORY OF GASES AND FIRST LAW OF THERMODYNAMICSBOOK - CENGAGE PHYSICS ENGLISHCHAPTER - KINETIC THEORY OF GASES AND FIRST LAW OF THERMODYNAMICSEXERCISE - Assertion-Reasoning
6 Videos
- KINETIC THEORY OF GASES AND FIRST LAW OF THERMODYNAMICSBOOK - CENGAGE PHYSICS ENGLISHCHAPTER - KINETIC THEORY OF GASES AND FIRST LAW OF THERMODYNAMICSEXERCISE - Subjective
22 Videos
- KINETIC THEORY OF GASESBOOK - CENGAGE PHYSICS ENGLISHCHAPTER - KINETIC THEORY OF GASESEXERCISE - Compression
2 Videos
- LINEAR AND ANGULAR SIMPLE HARMONIC MOTIONBOOK - CENGAGE PHYSICS ENGLISHCHAPTER - LINEAR AND ANGULAR SIMPLE HARMONIC MOTIONEXERCISE - Single correct anwer type
14 Videos
Similar Questions
A cyclic process ABCA shown in the V-T diagram is performed with a constant mass of an ideal gas. Show the same process on a p-V diagram, In the figure, CA is parallel to the V-axis and BC is parallel to the T-axis.<br><imga≤ocr_imageload∈g=lazysrc=https://d10lpgp6xz60nq.cloudfront.net/physics_imagesHCV_VOL2_C24_S01_010_Q01.pngwh=80%mx-autosty≤=background:white;>
View SolutionA cyclic process ABCA is shown in the V - T diagram . Process on the P – V diagram is
View Solution
Knowledge Check
A cyclic process ABCA is shown in the V−T diagram process on the P−V
 A
A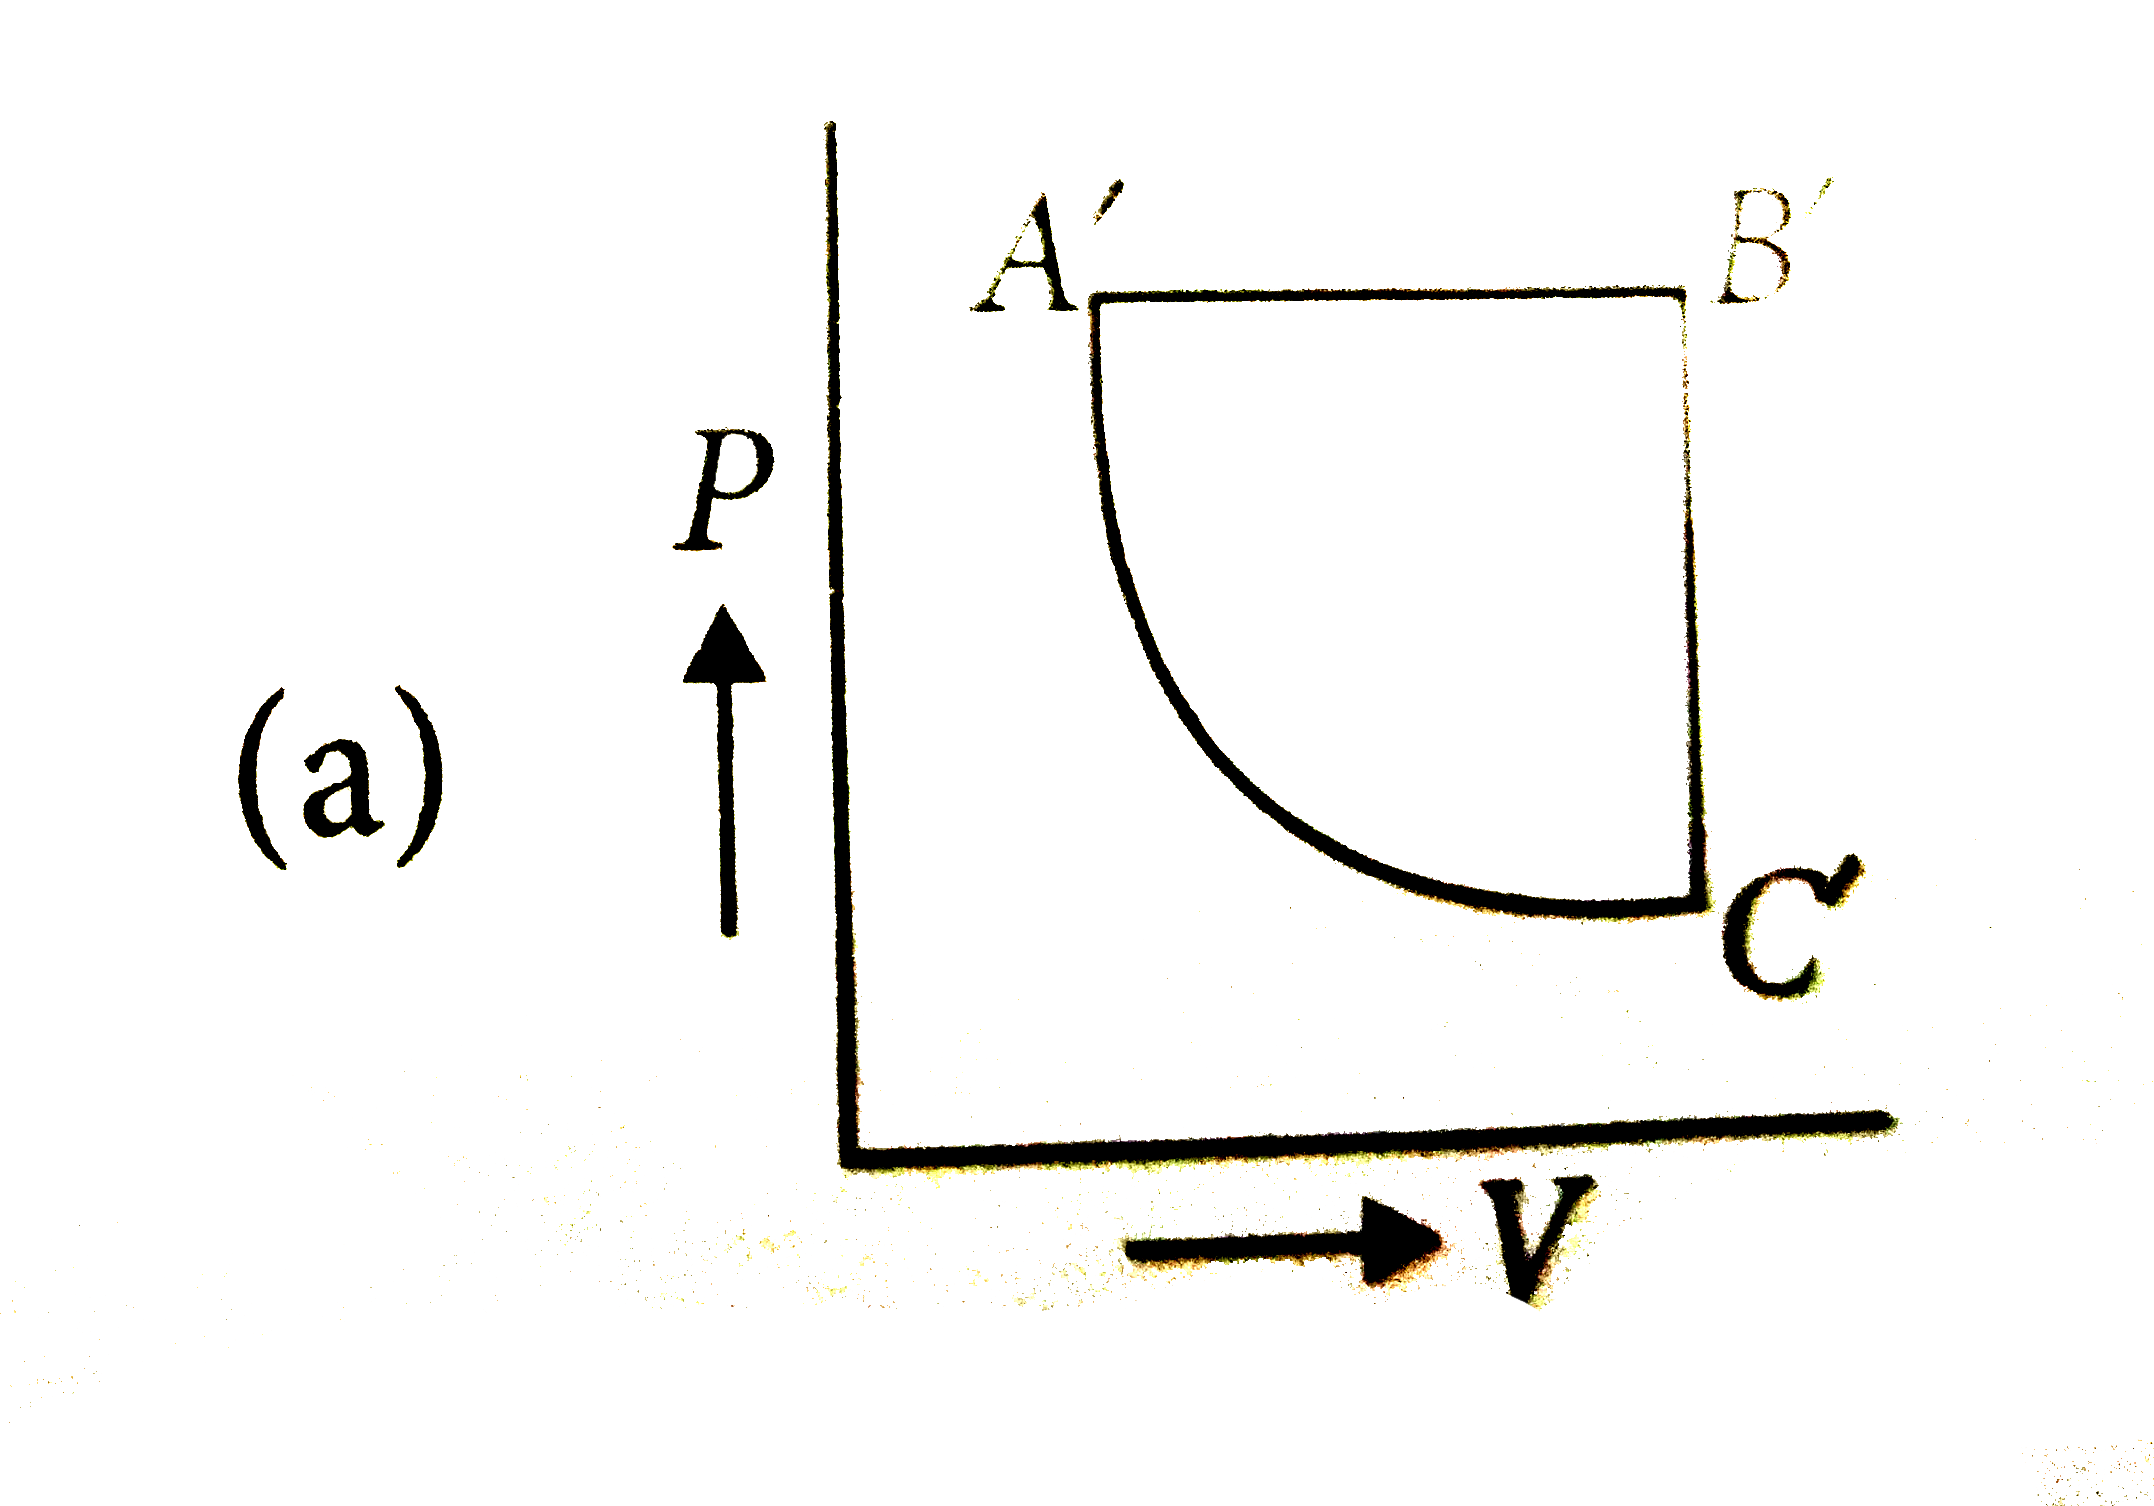 B
B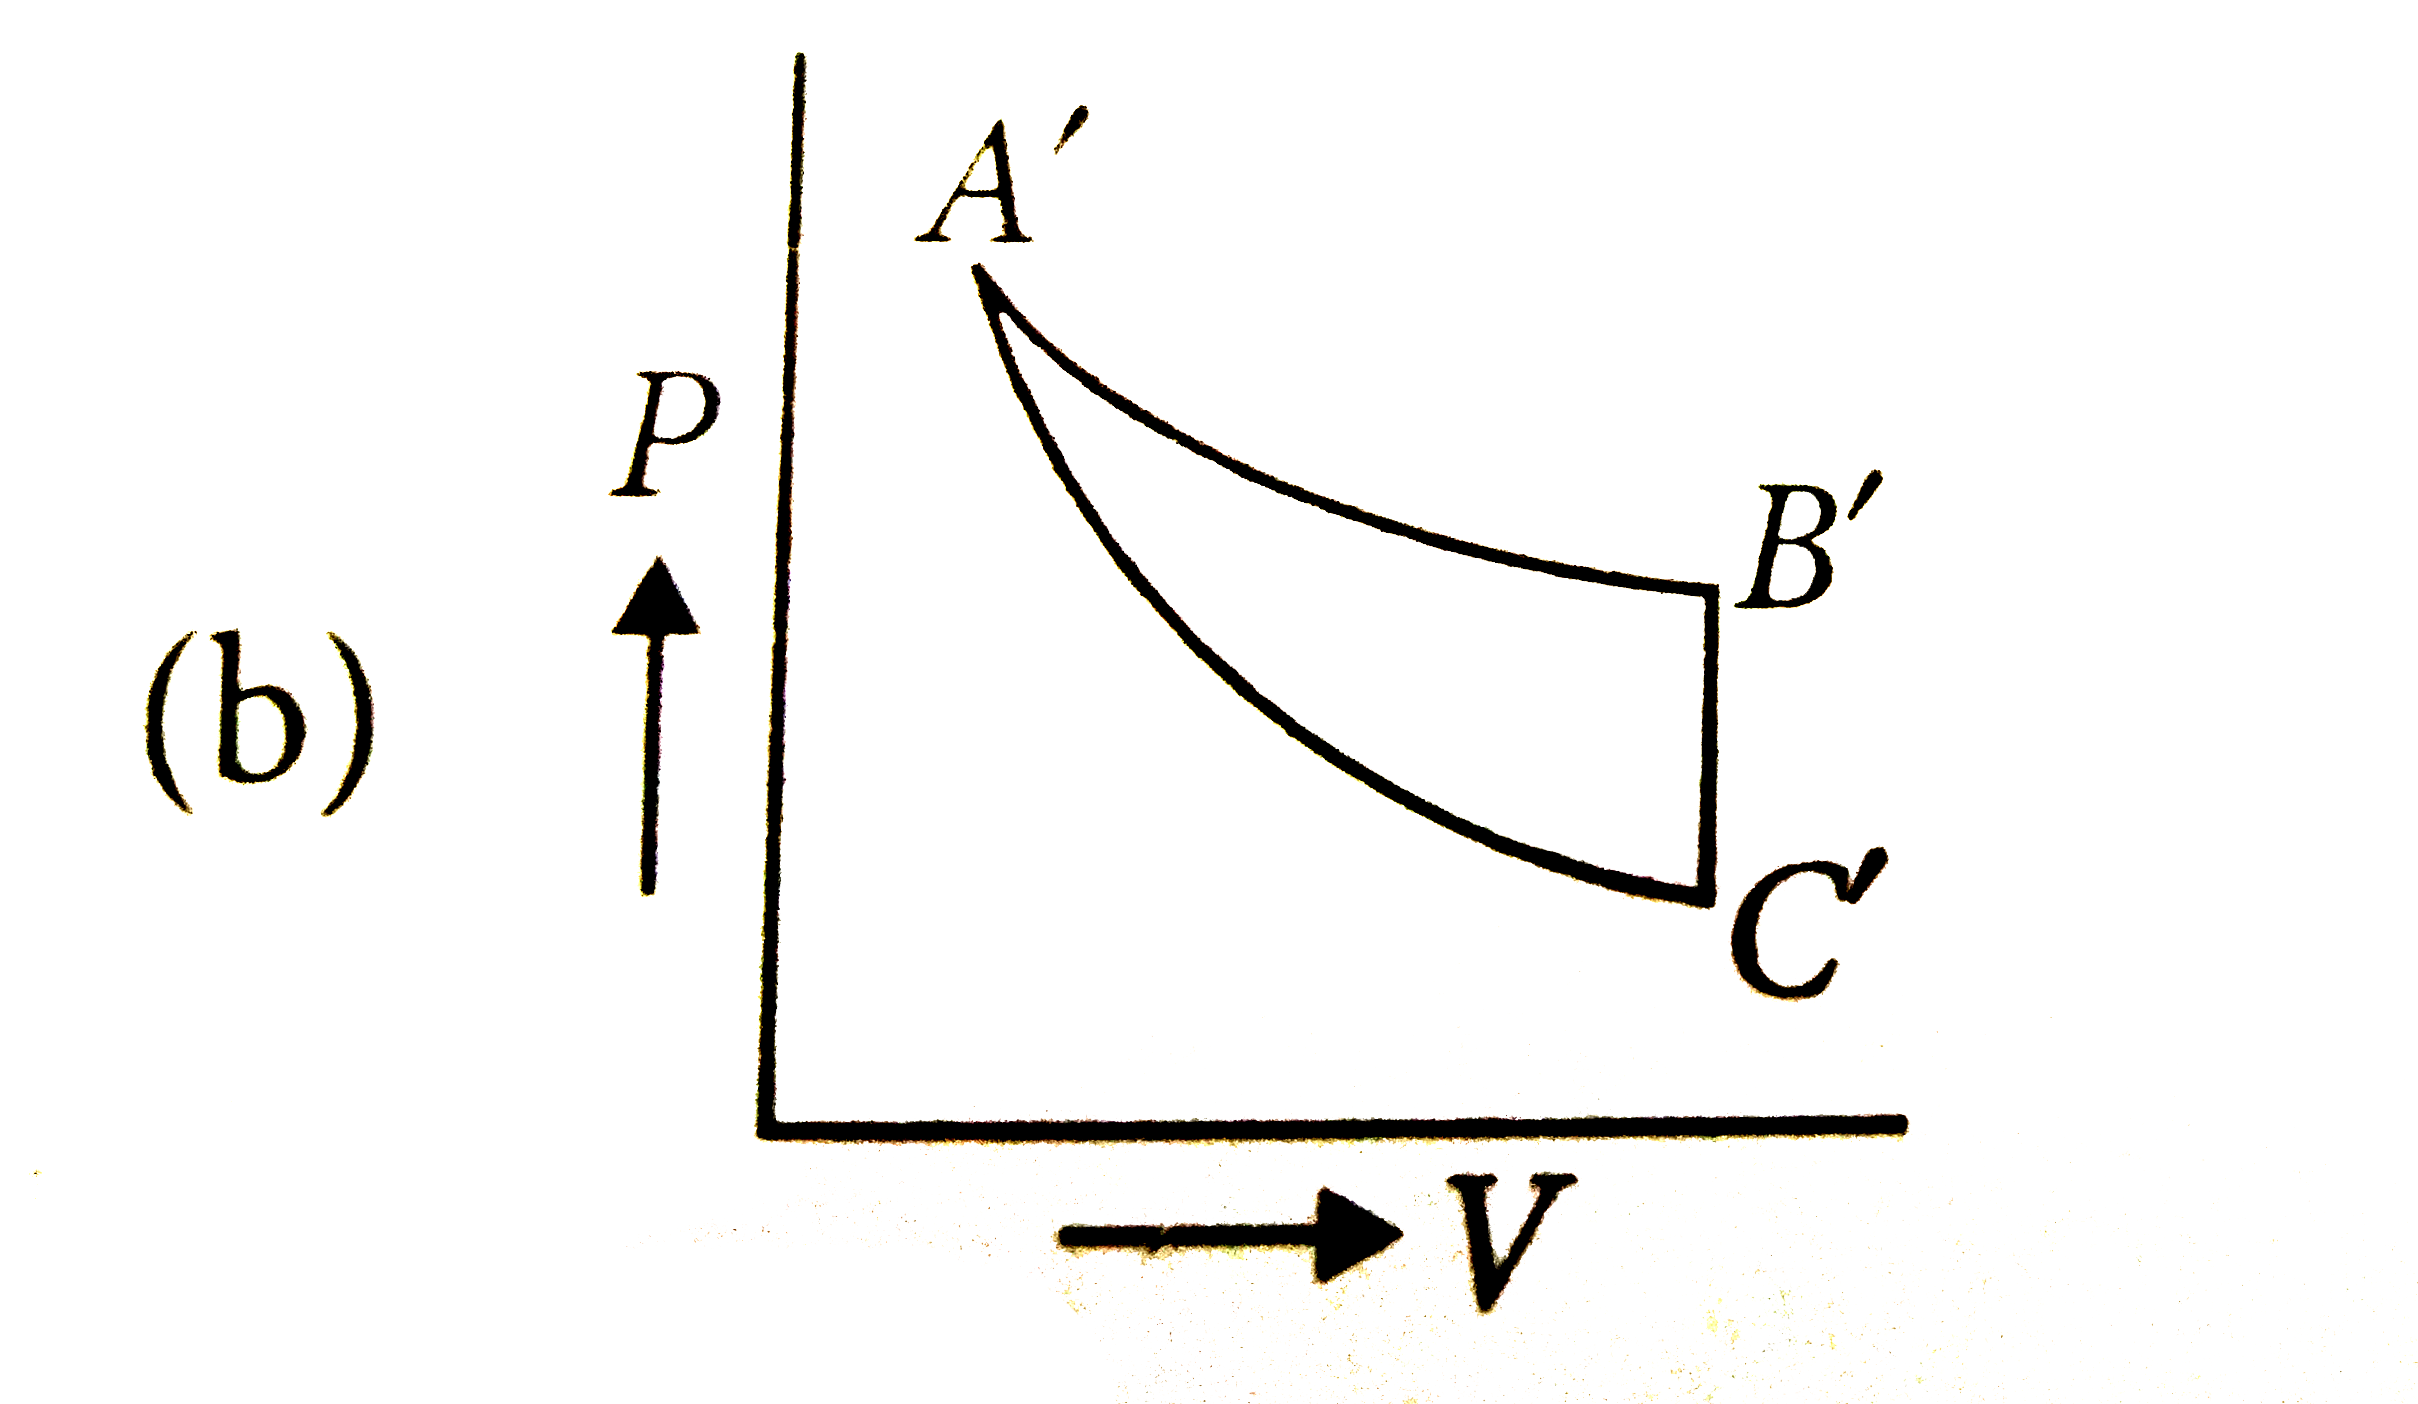 C
C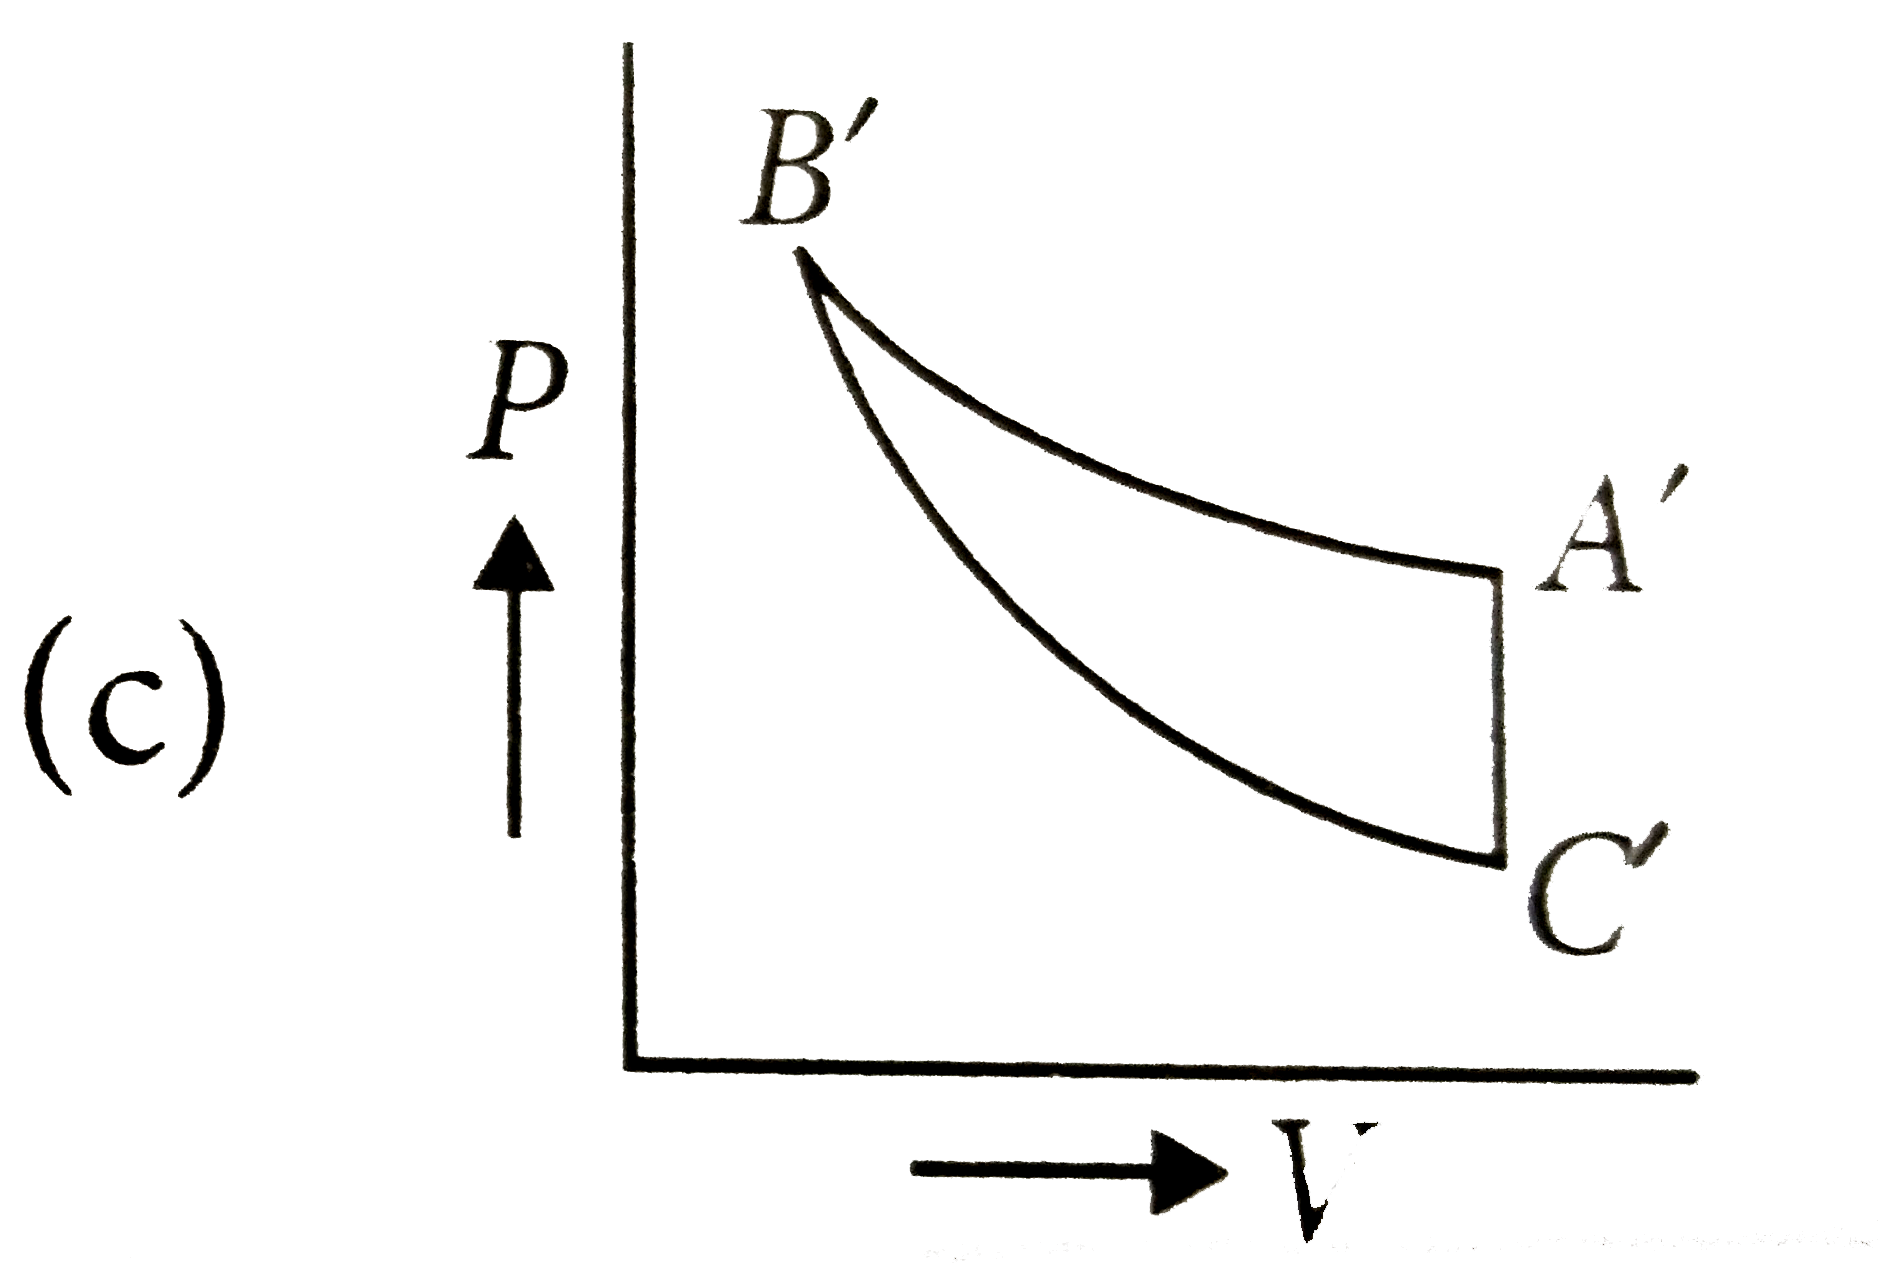 D
D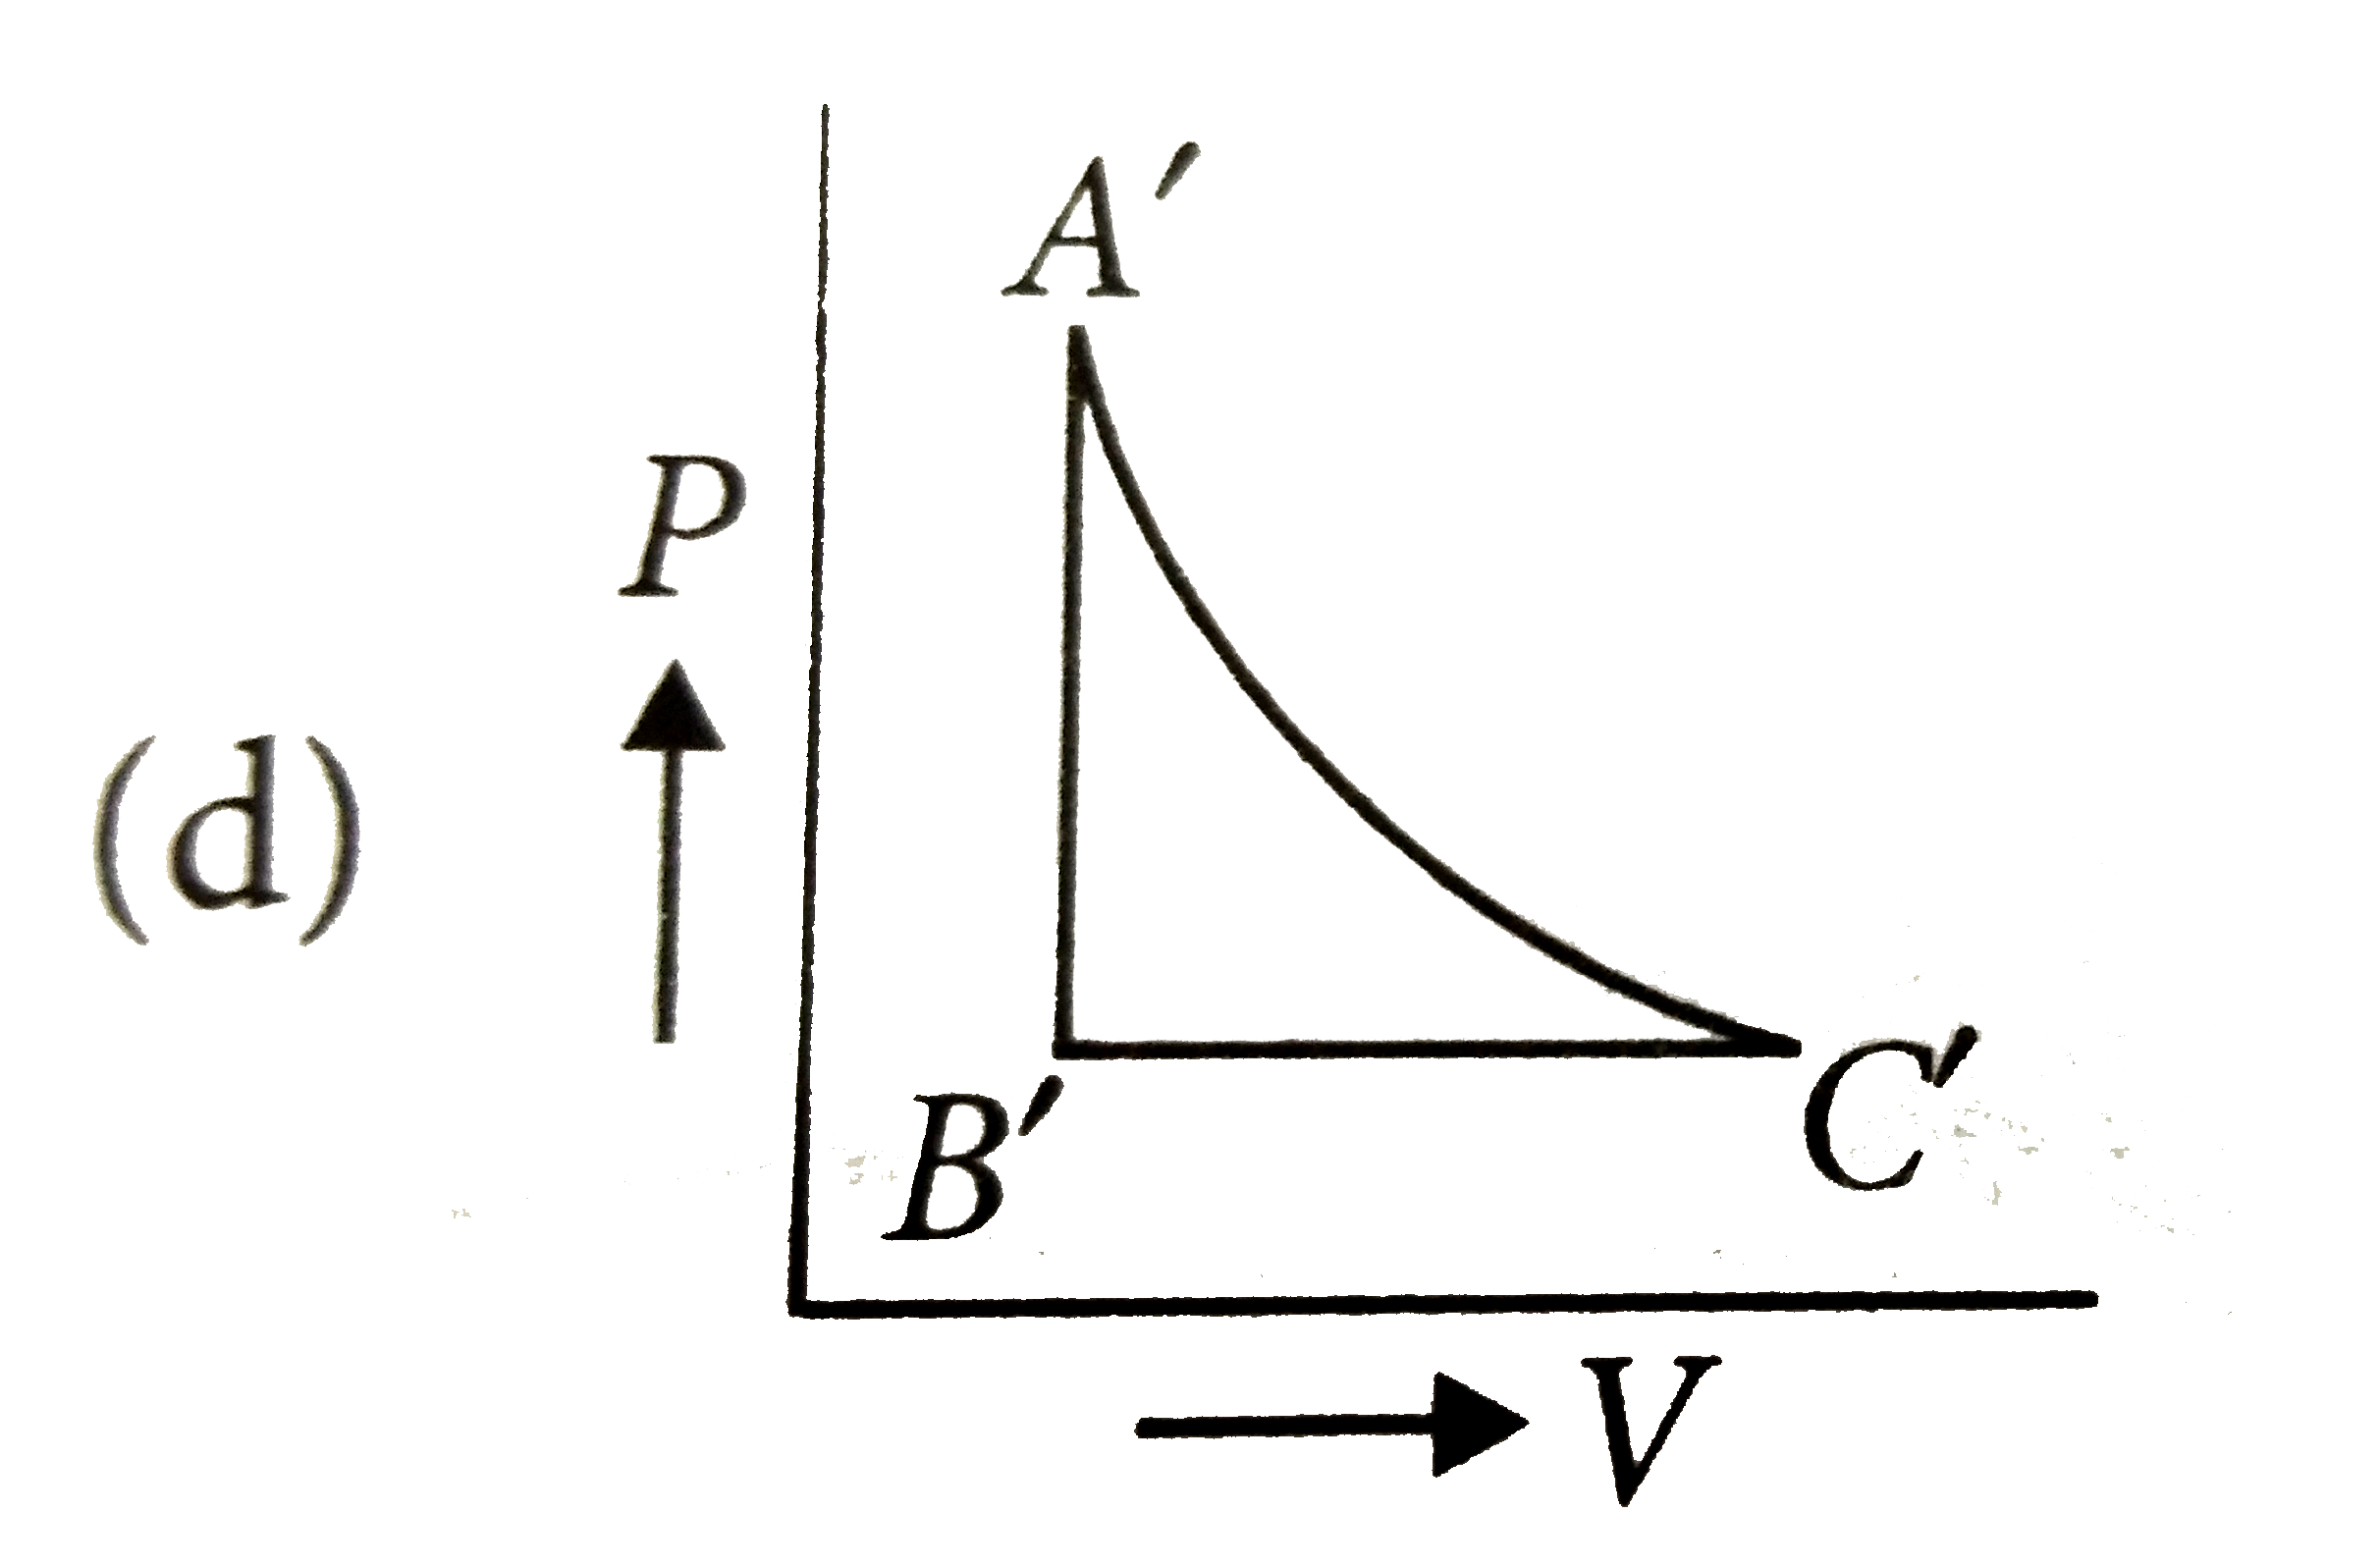
Which of the following P-V diagram represent the graph of isometric process?
A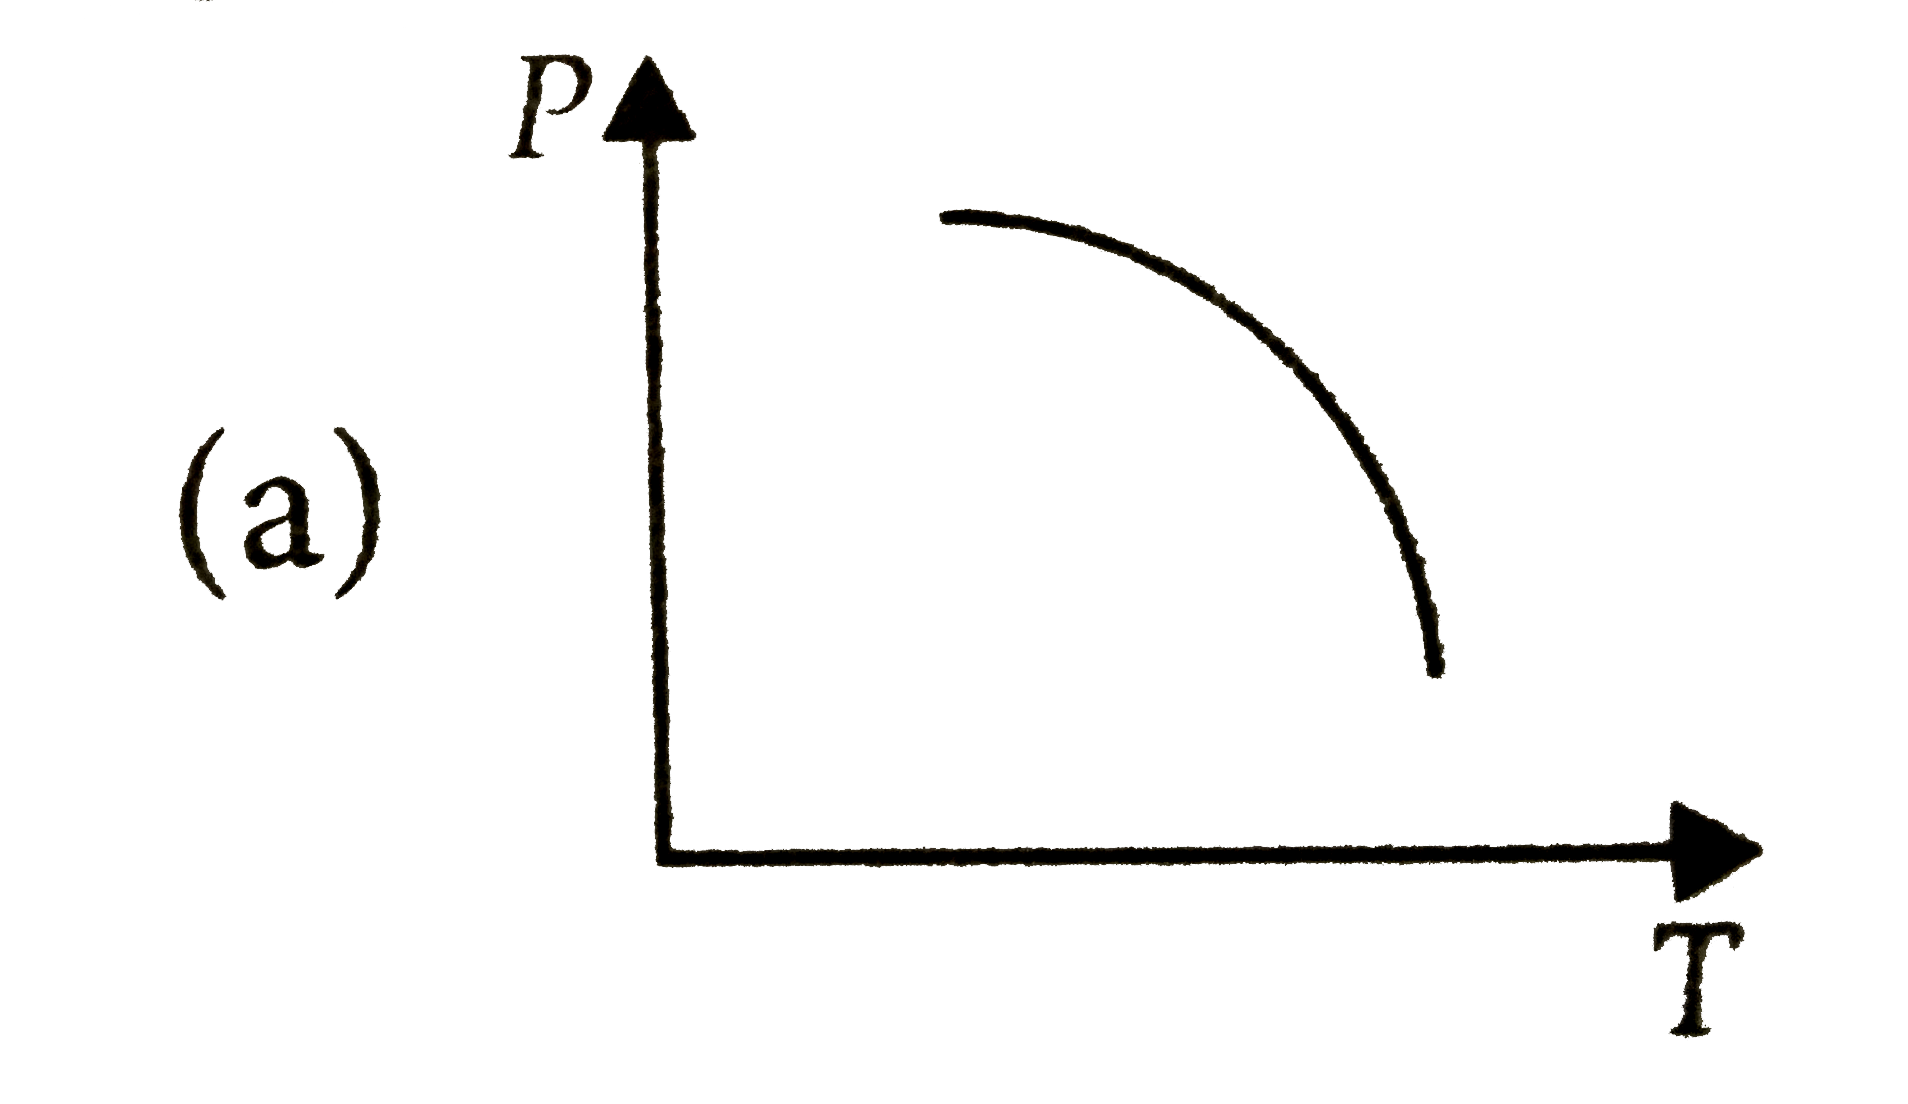 B
B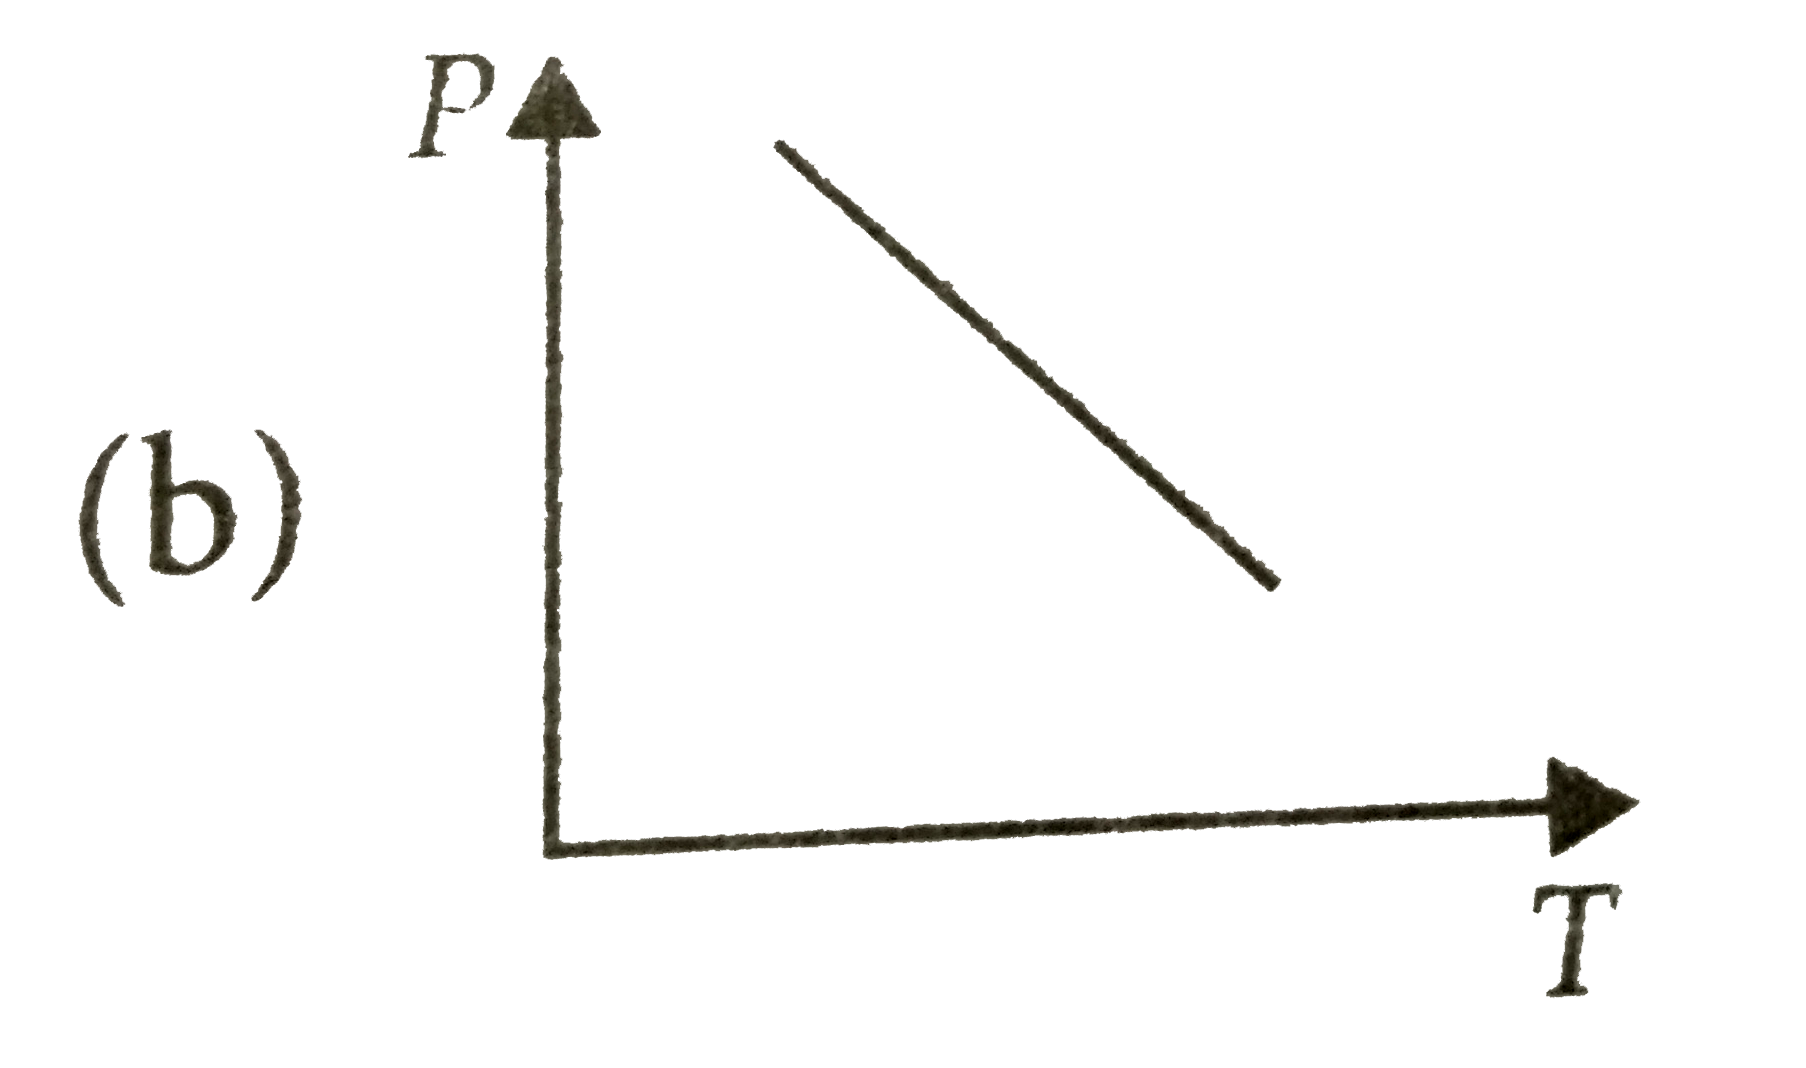 C
C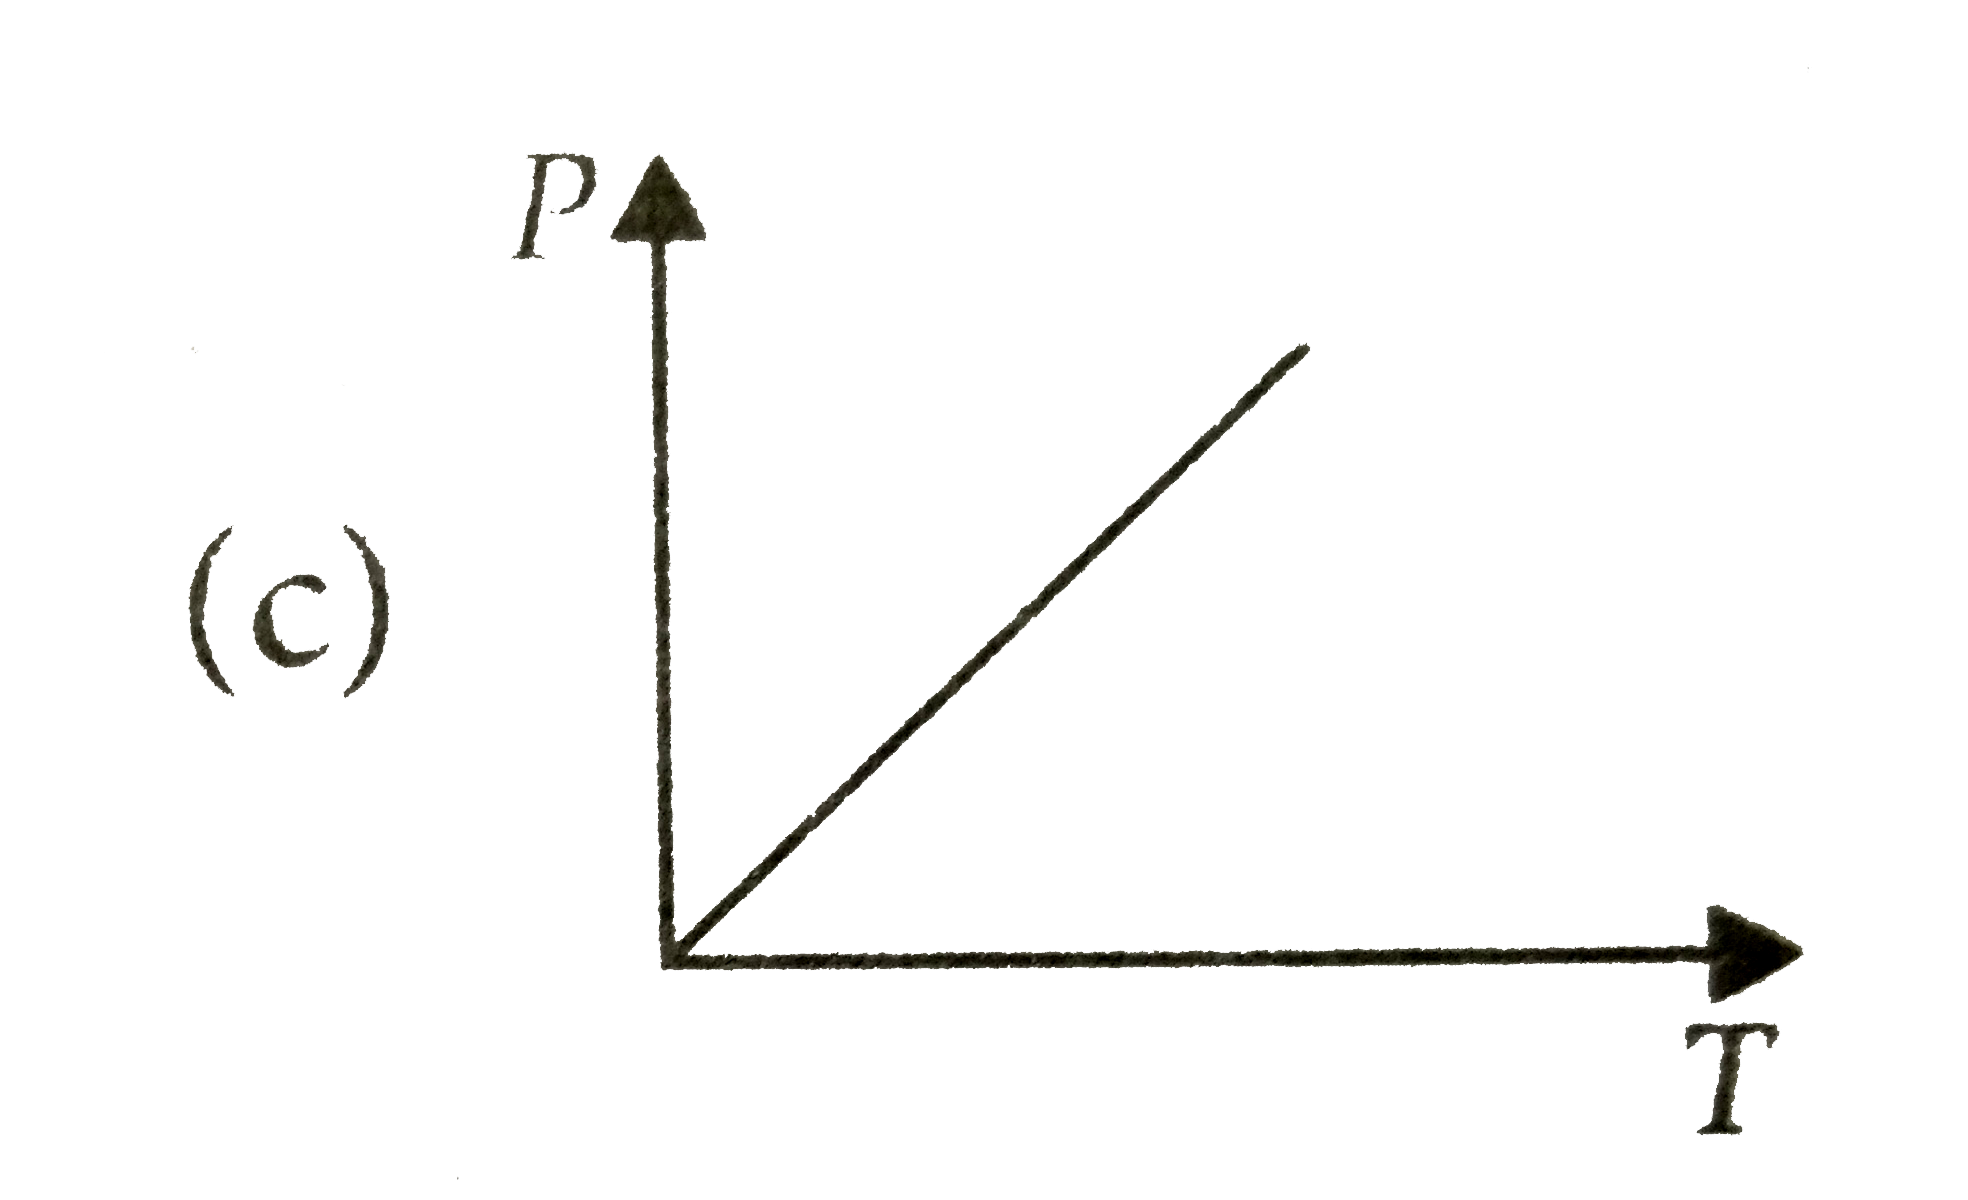 D
D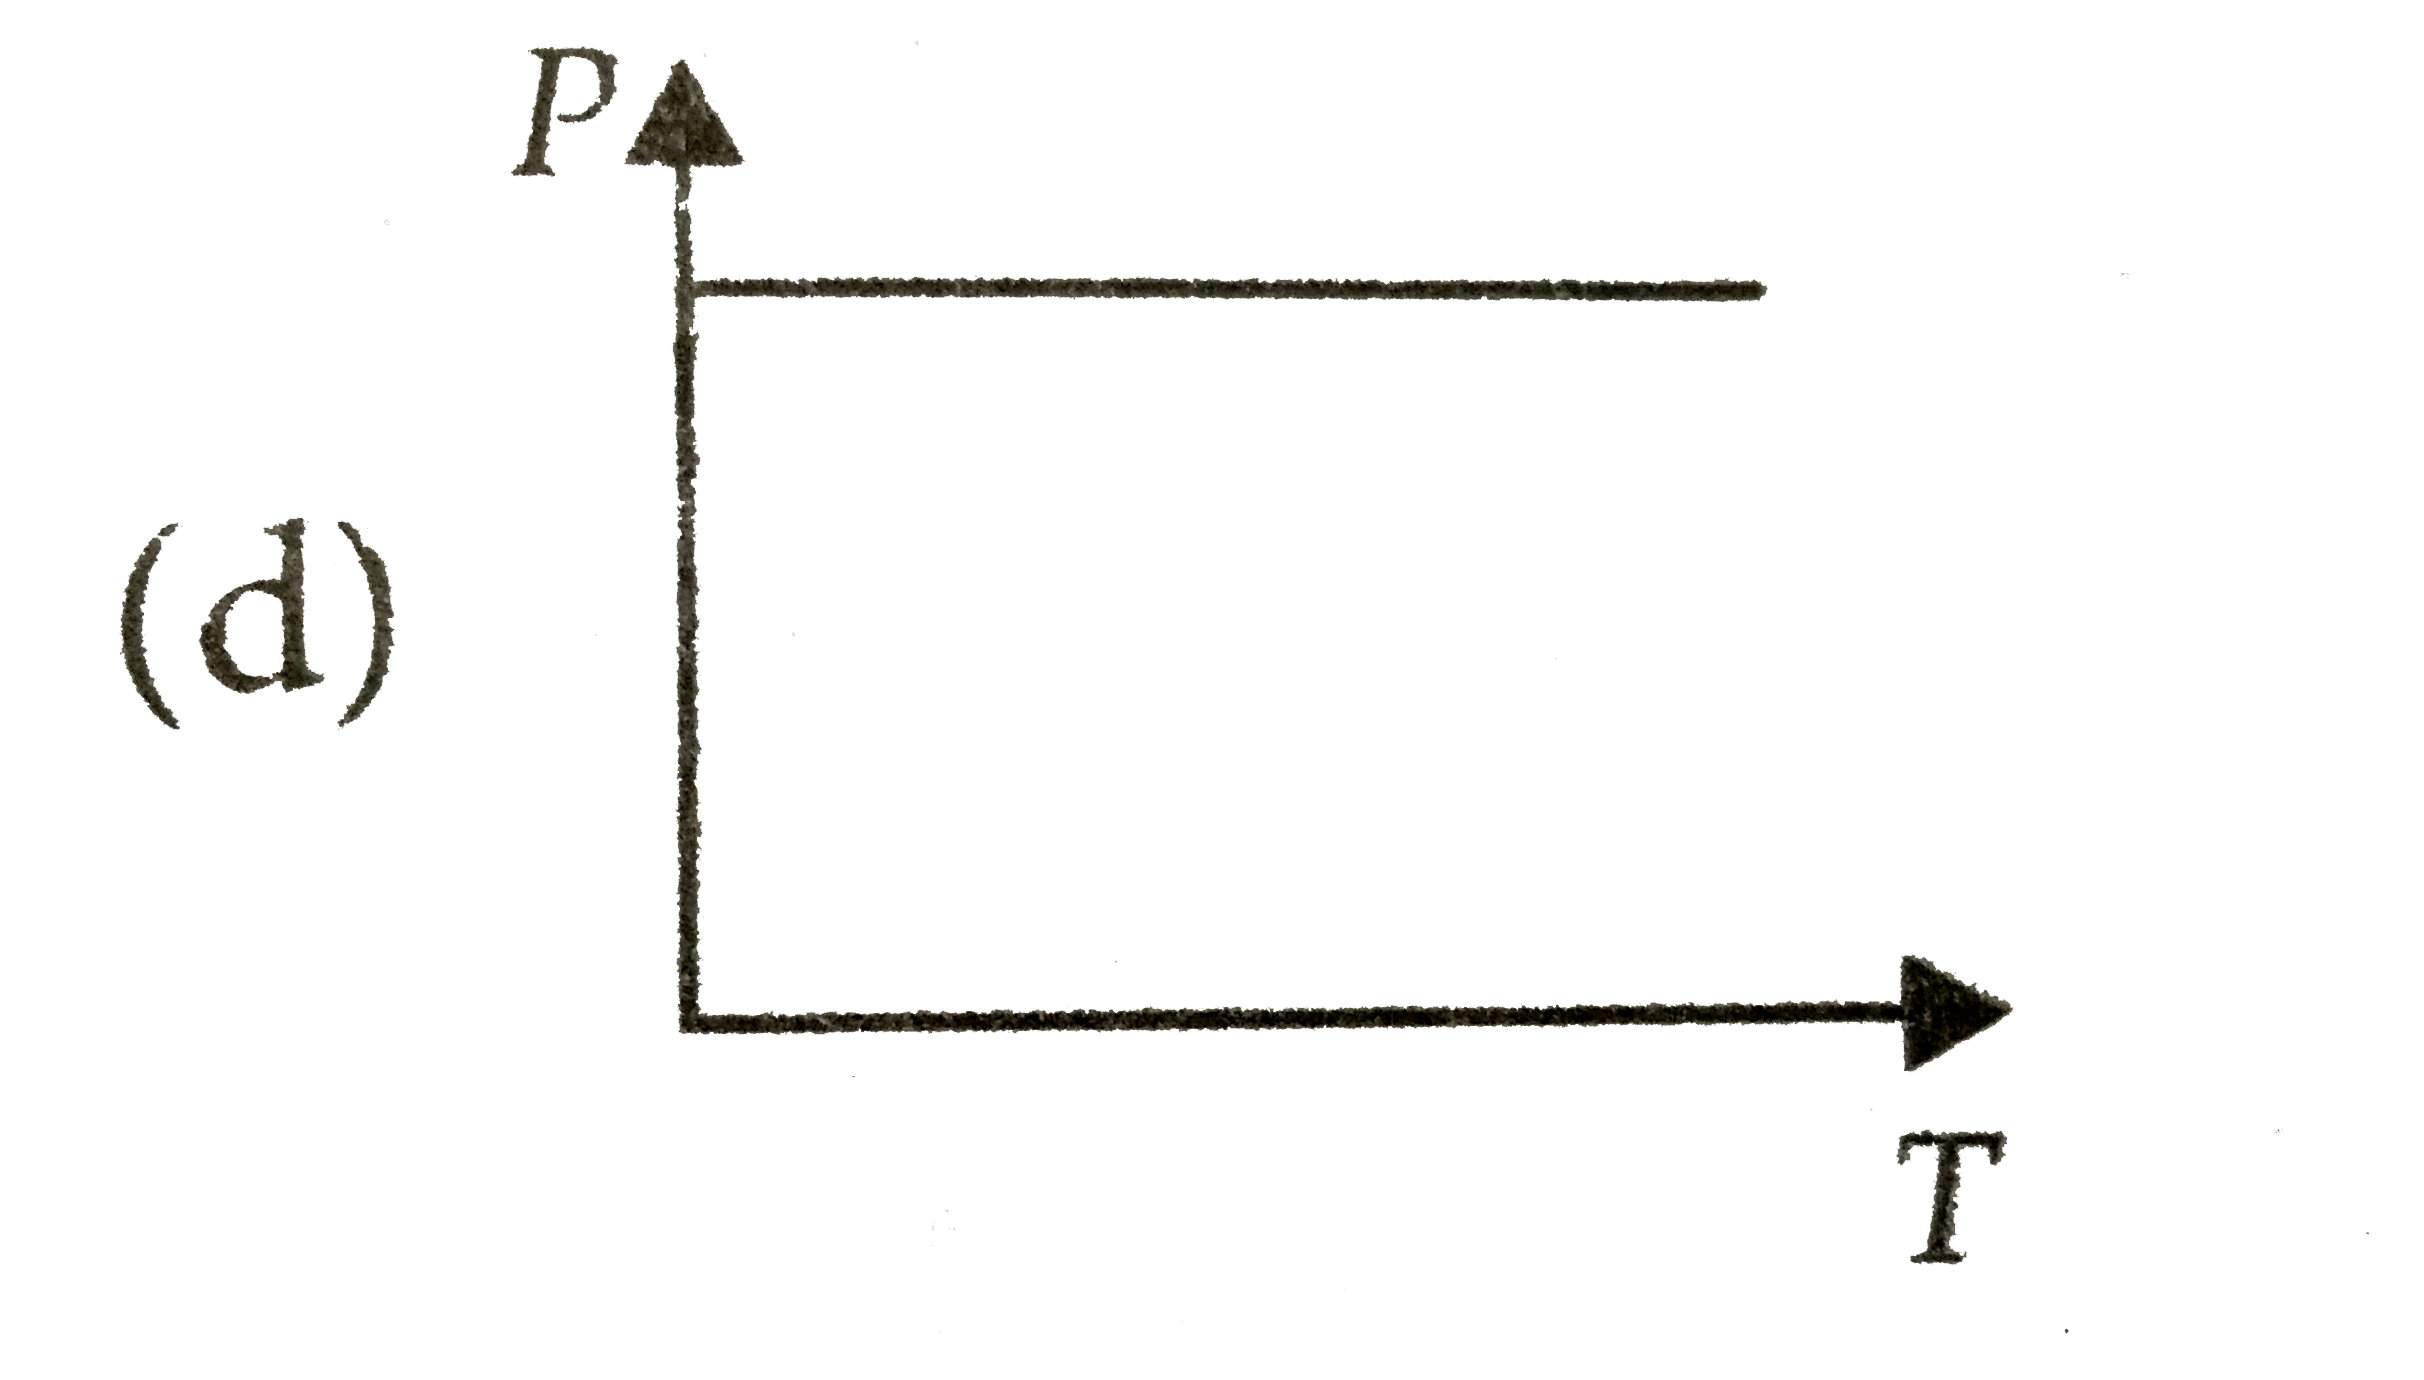
Consider p-V diagram for an ideal gas shown in figure.
Out of the following diagrams, which figure represents the T−p diagram ?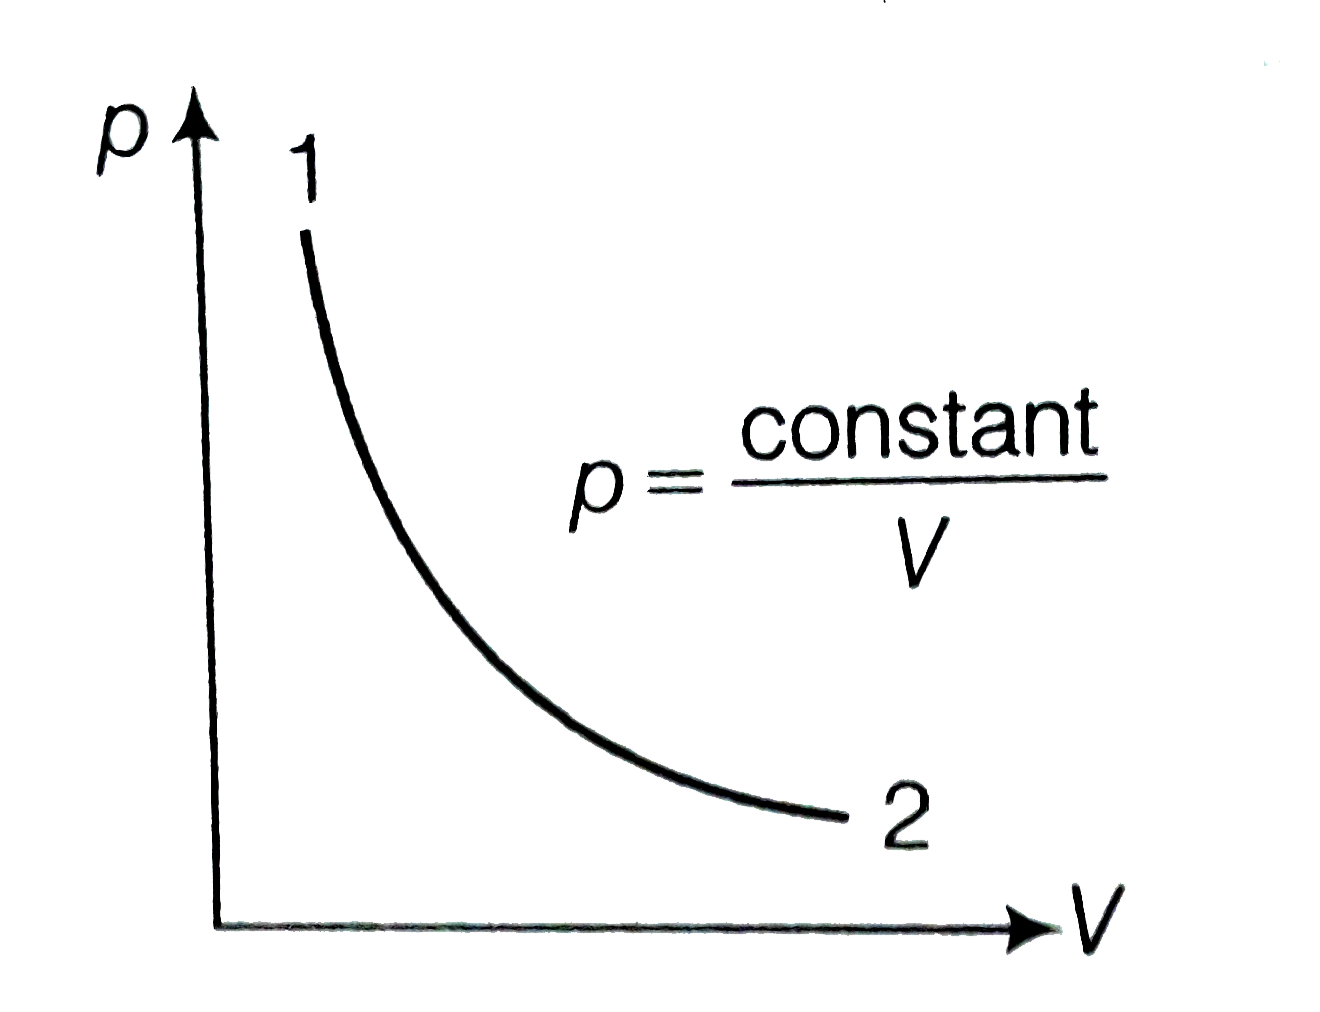
(i)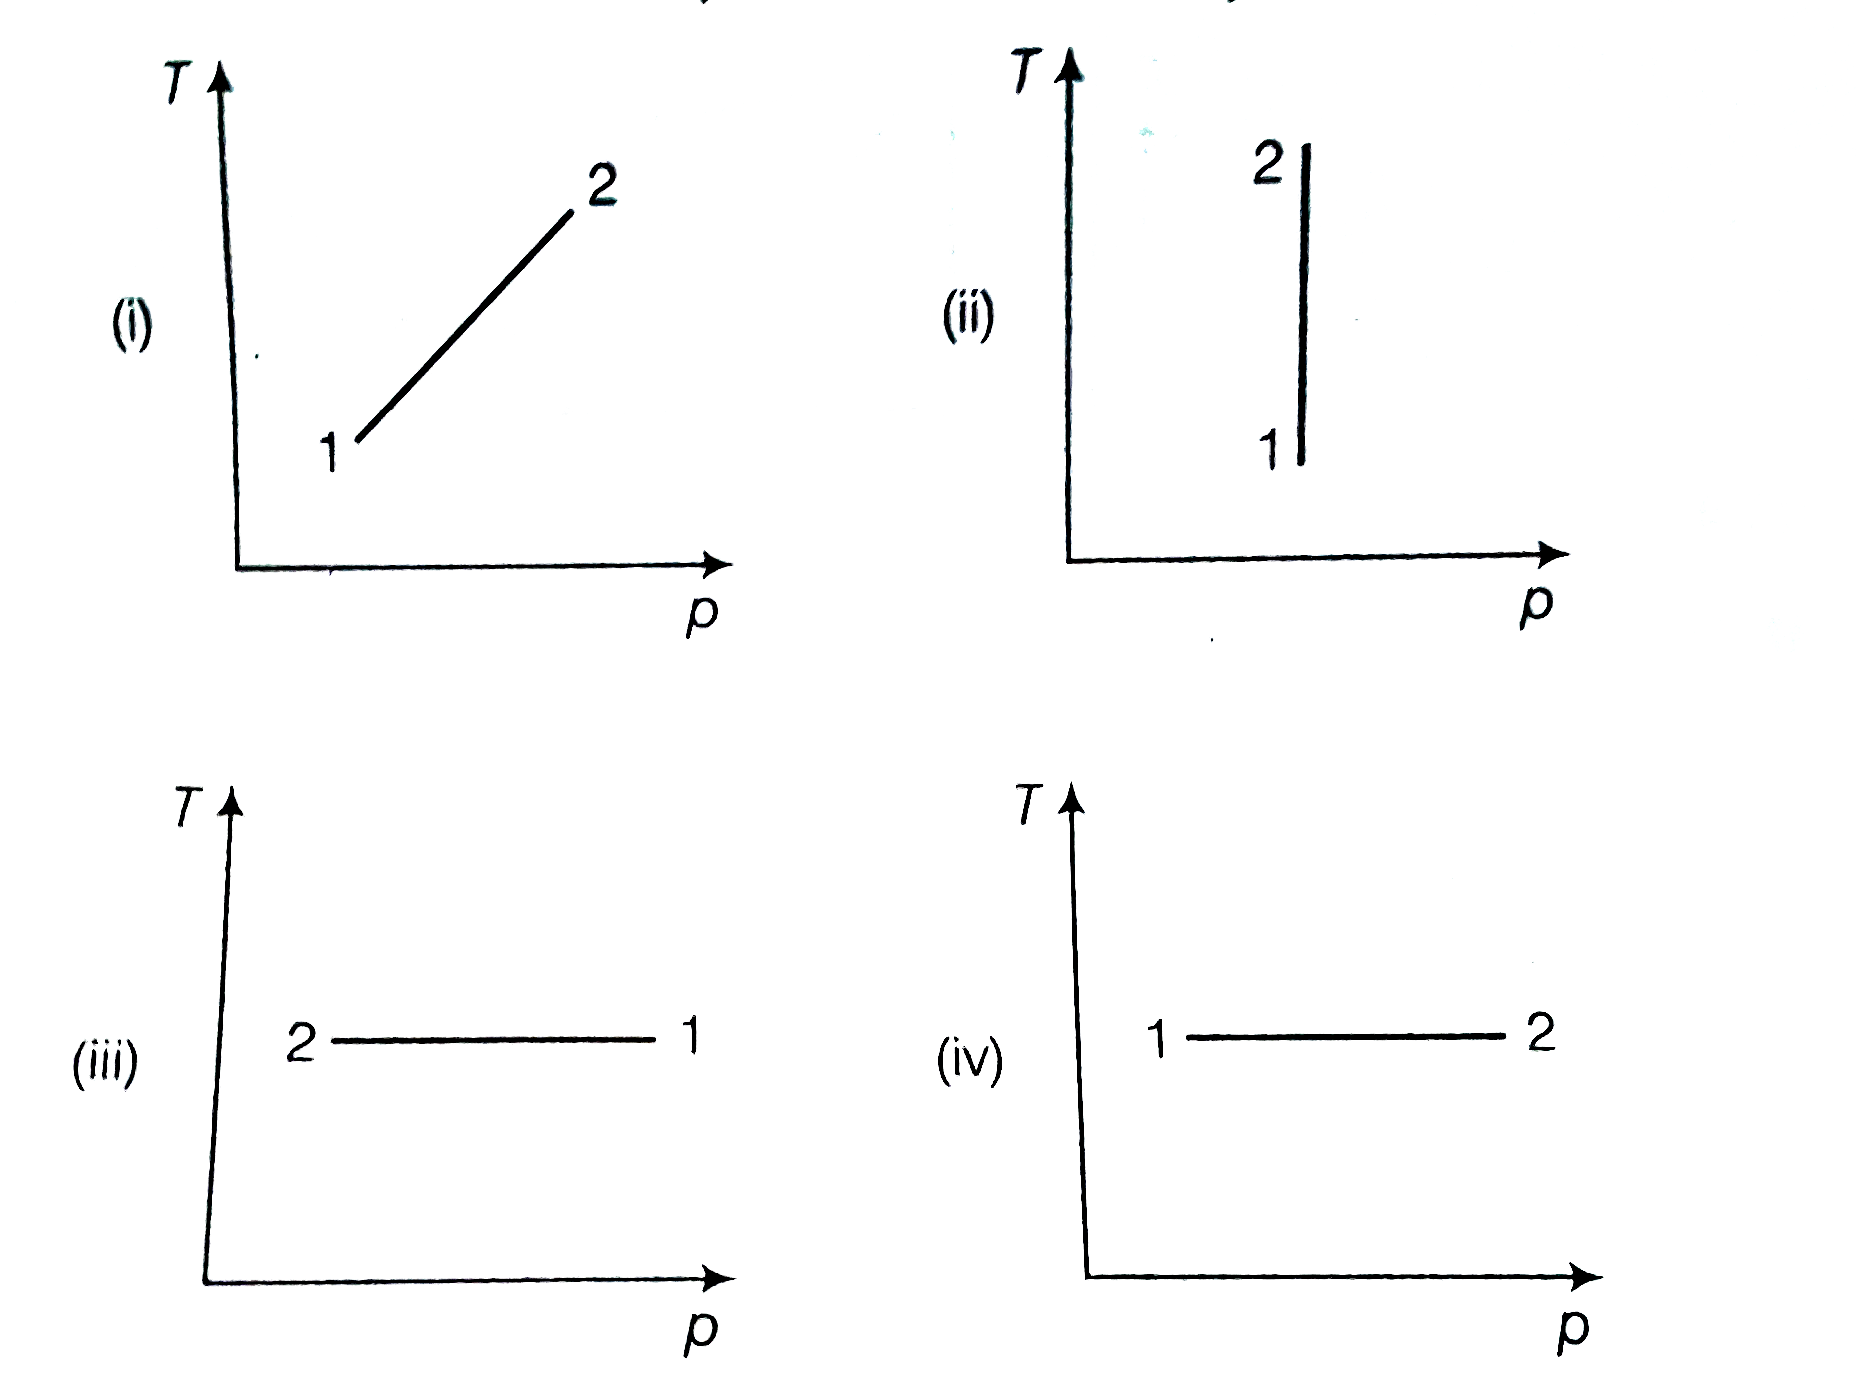 A(iv)B(ii)C(iii)D(i)
A cyclie process ABCA is shwon in a V−T diagram. The corresponding P−V diagram is

View SolutionA cyclic process ABCD is shown in the P−V diagram. Which of the following curves represents the same process?
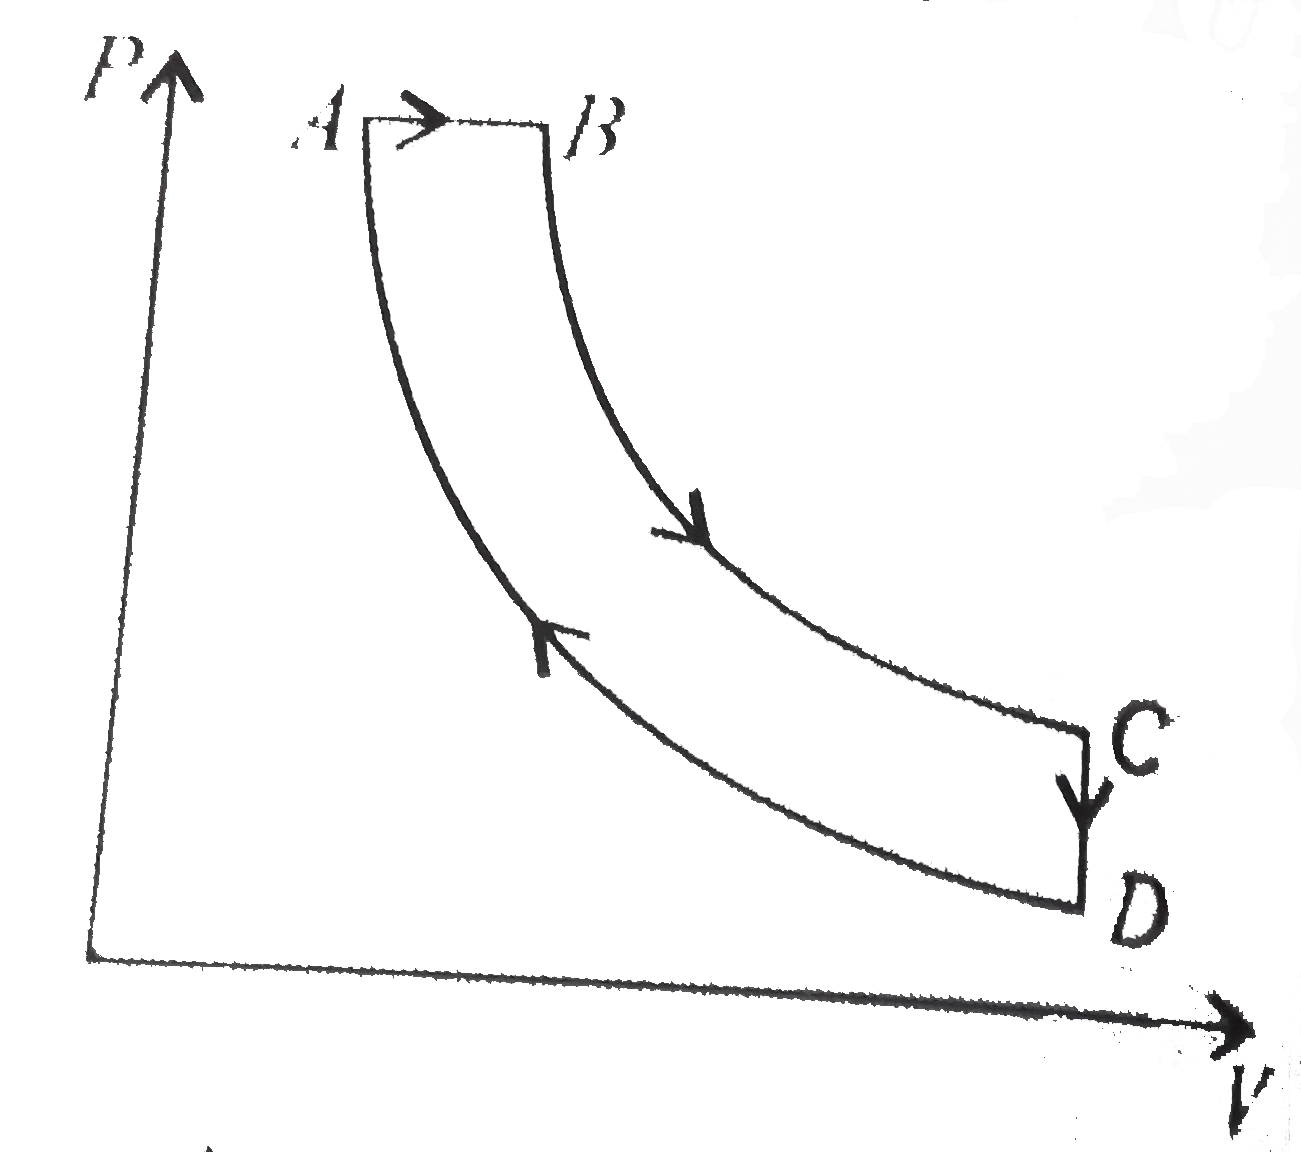
View SolutionA cyclic process ABCD is shown in the P−V diagram. Which of the following curves represents the same process?

View SolutionIn the cyclic process shown on V−P diagram, the magnitude of the work done is
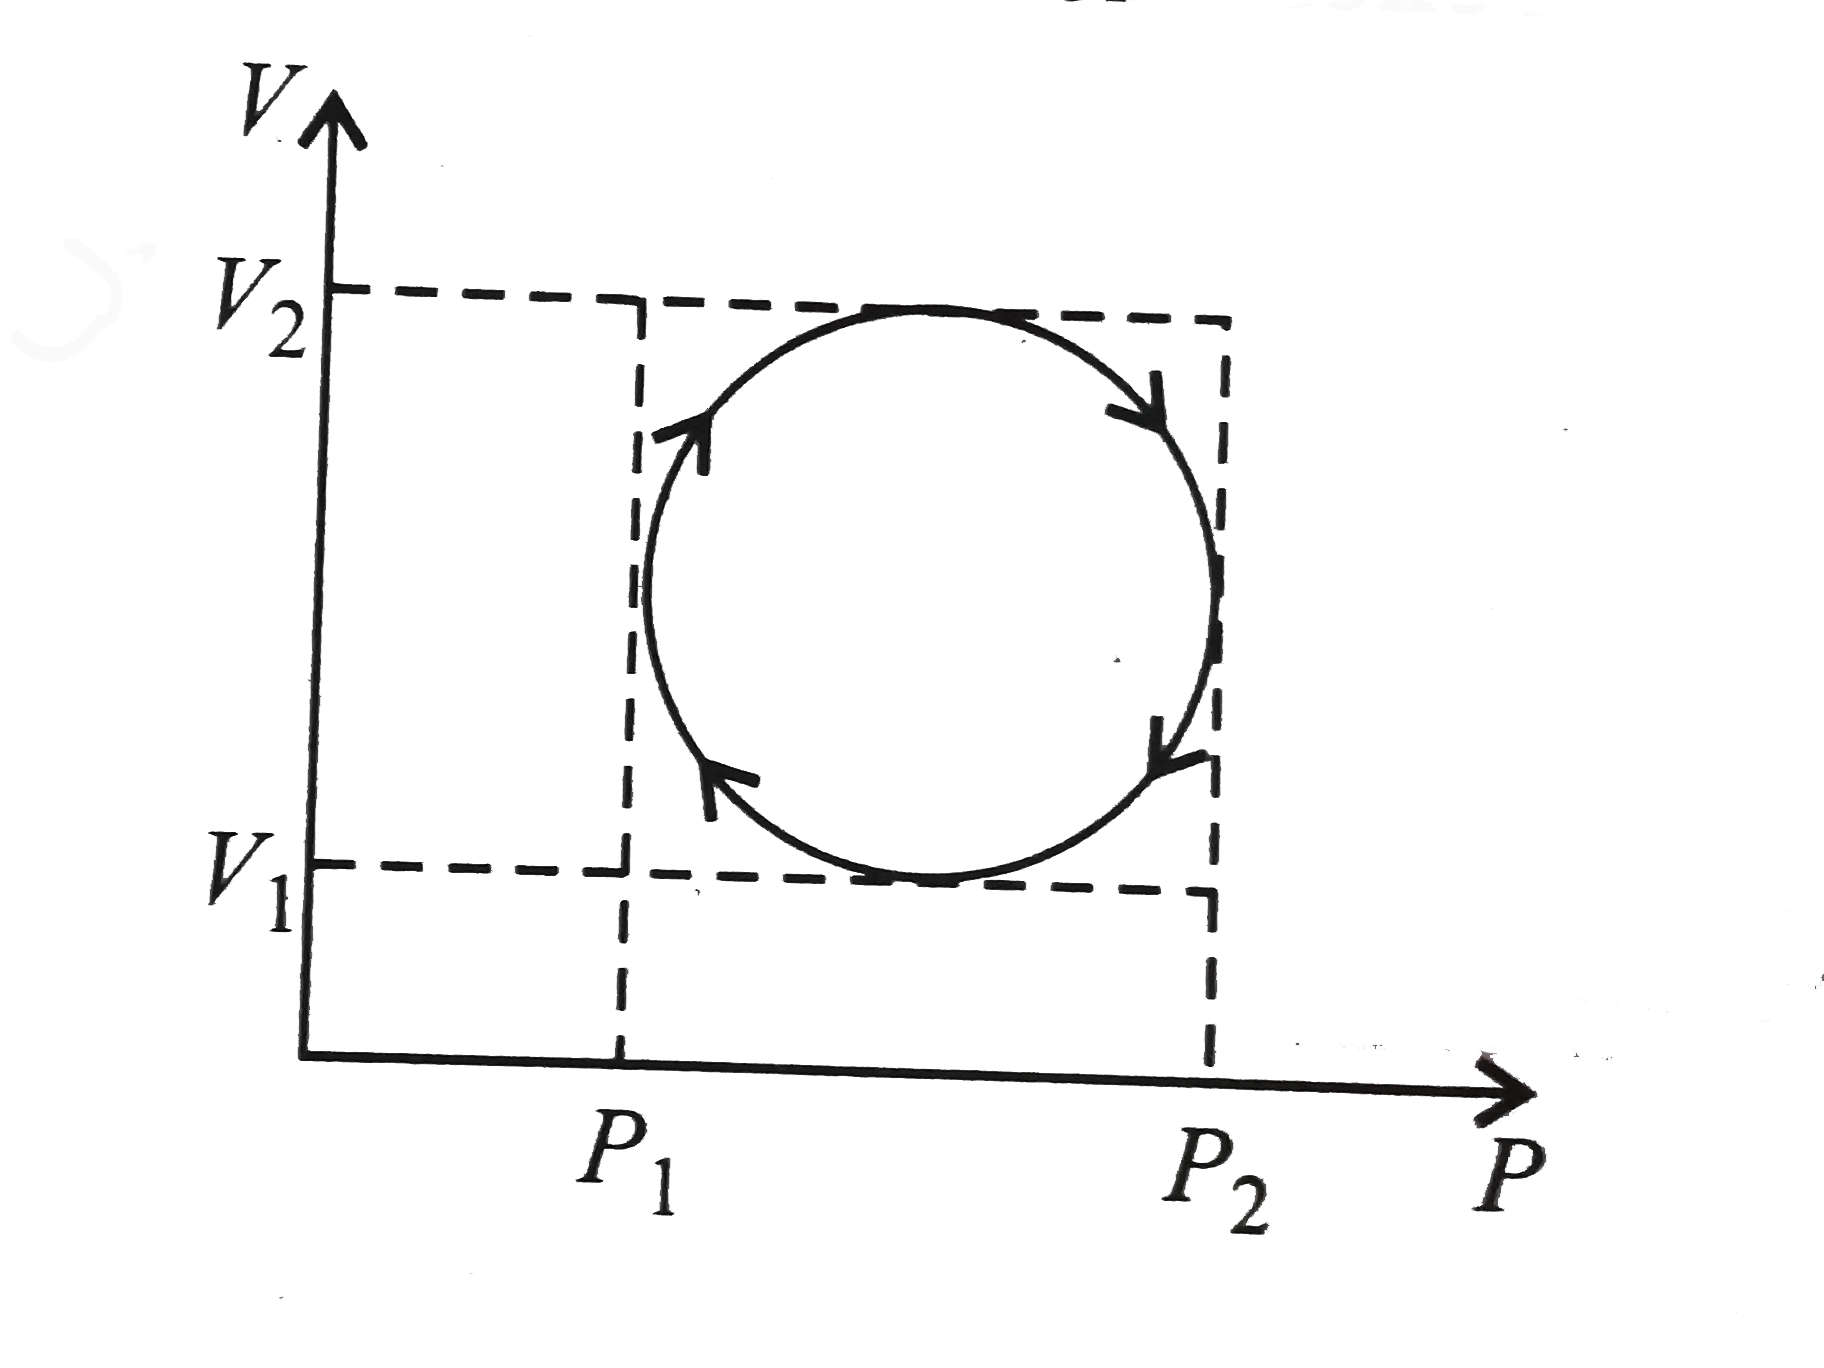
View SolutionConsider p-V diagram for an ideal gas shown in figure.

Out of the following diagrams, which figure represents the T−p diagram ?
(i)
View Solution
