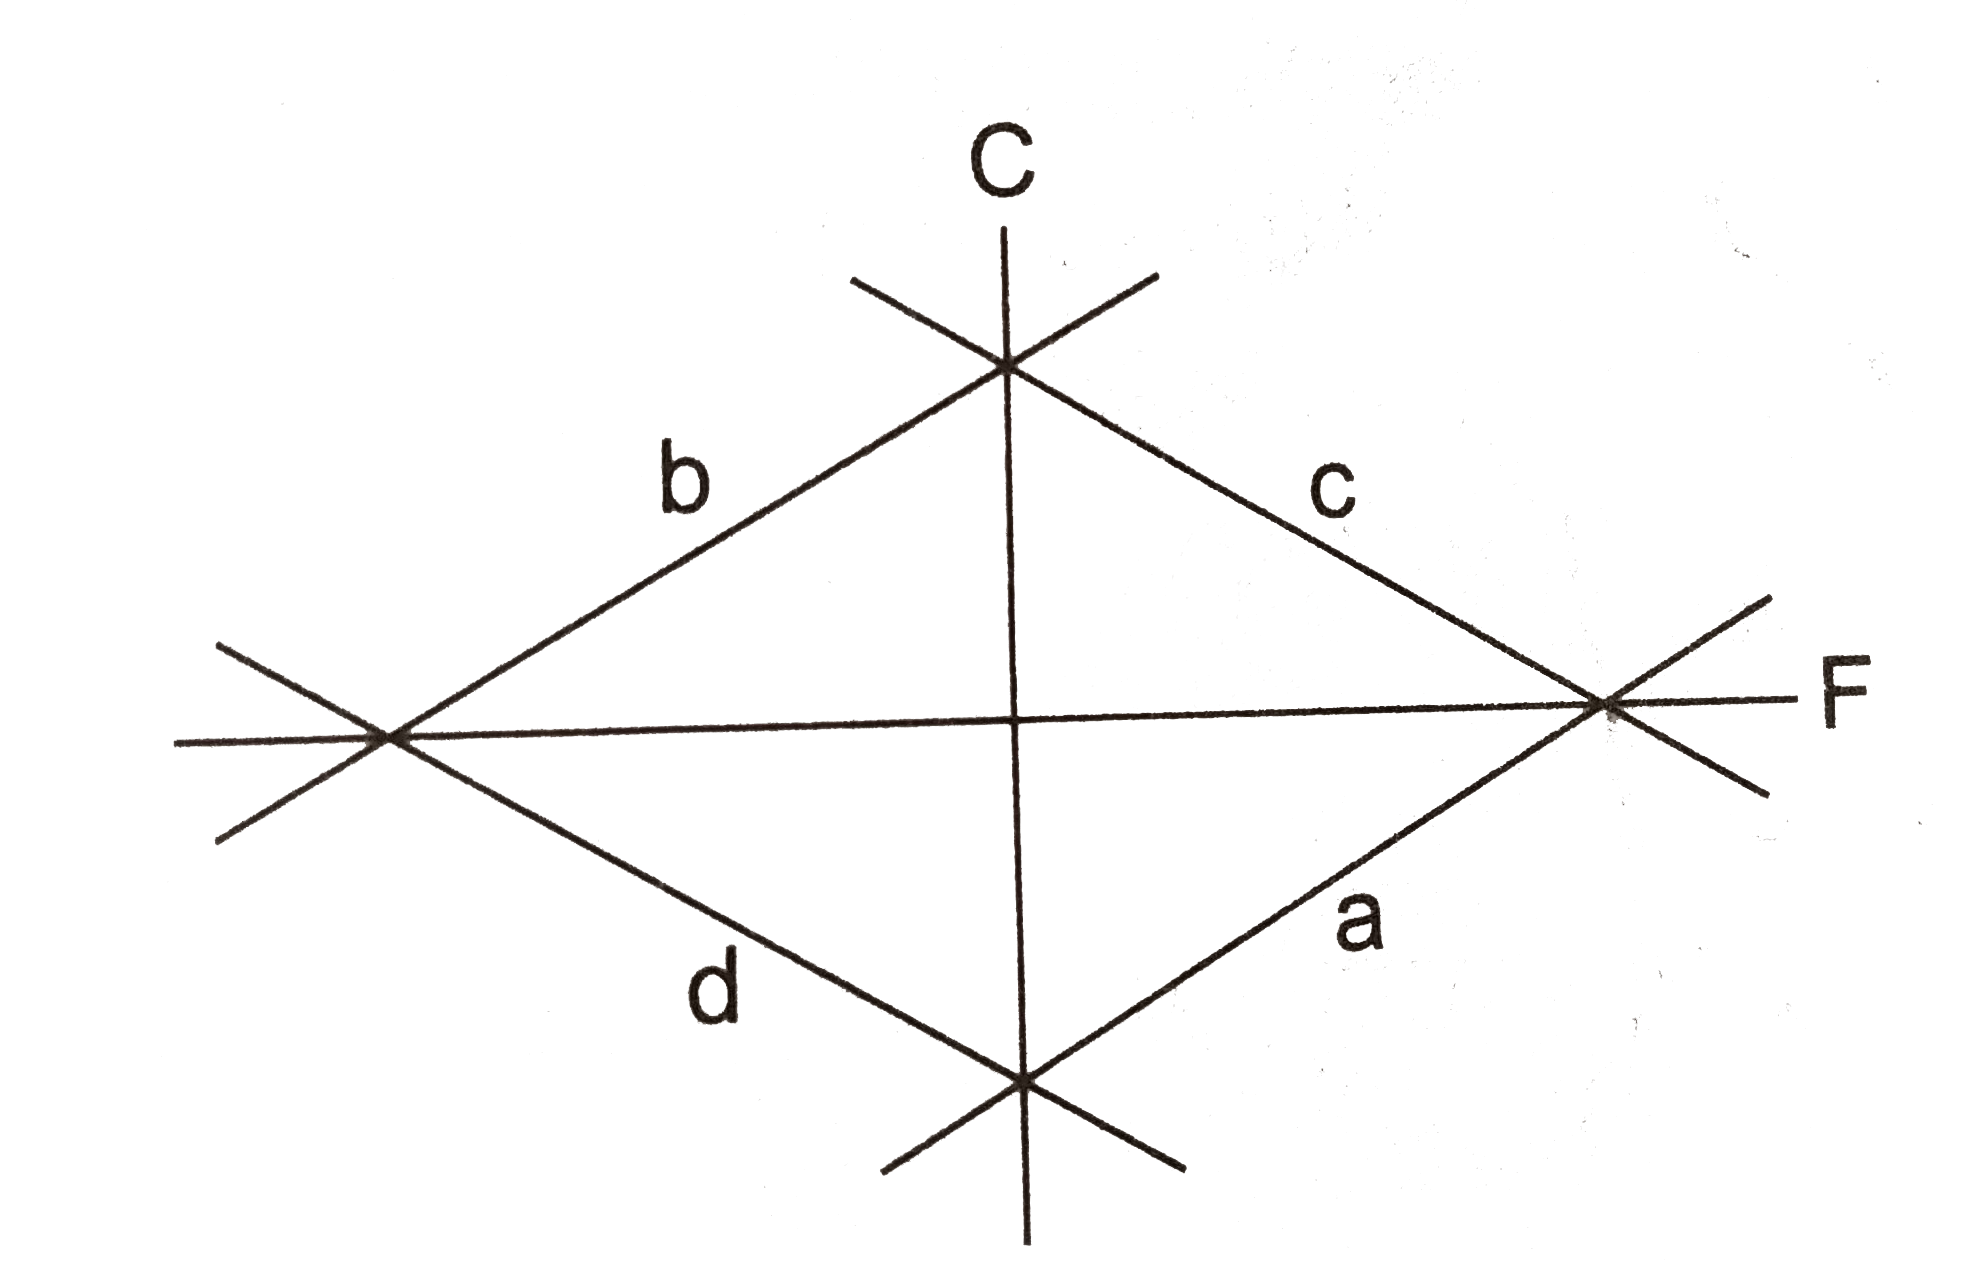
Which parts of the curve in the figure shown represent compression and rarefaction for a longitudianal wave?
Video Solution
Text Solution
ABC represent compression (negative slope region) and CDE represent rarefaction (positive slope region).
|
Topper's Solved these Questions
- TRAVELLING WAVESBOOK - CENGAGE PHYSICS ENGLISHCHAPTER - TRAVELLING WAVESEXERCISE - Exercise 5.2
23 Videos
- TRAVELLING WAVESBOOK - CENGAGE PHYSICS ENGLISHCHAPTER - TRAVELLING WAVESEXERCISE - Subjective
16 Videos
- TRAVELLING WAVESBOOK - CENGAGE PHYSICS ENGLISHCHAPTER - TRAVELLING WAVESEXERCISE - Example
9 Videos
- TRANSMISSION OF HEATBOOK - CENGAGE PHYSICS ENGLISHCHAPTER - TRANSMISSION OF HEATEXERCISE - Single correct
9 Videos
- VECTORSBOOK - CENGAGE PHYSICS ENGLISHCHAPTER - VECTORSEXERCISE - Exercise Multiple Correct
5 Videos
Similar Questions
Knowledge Check
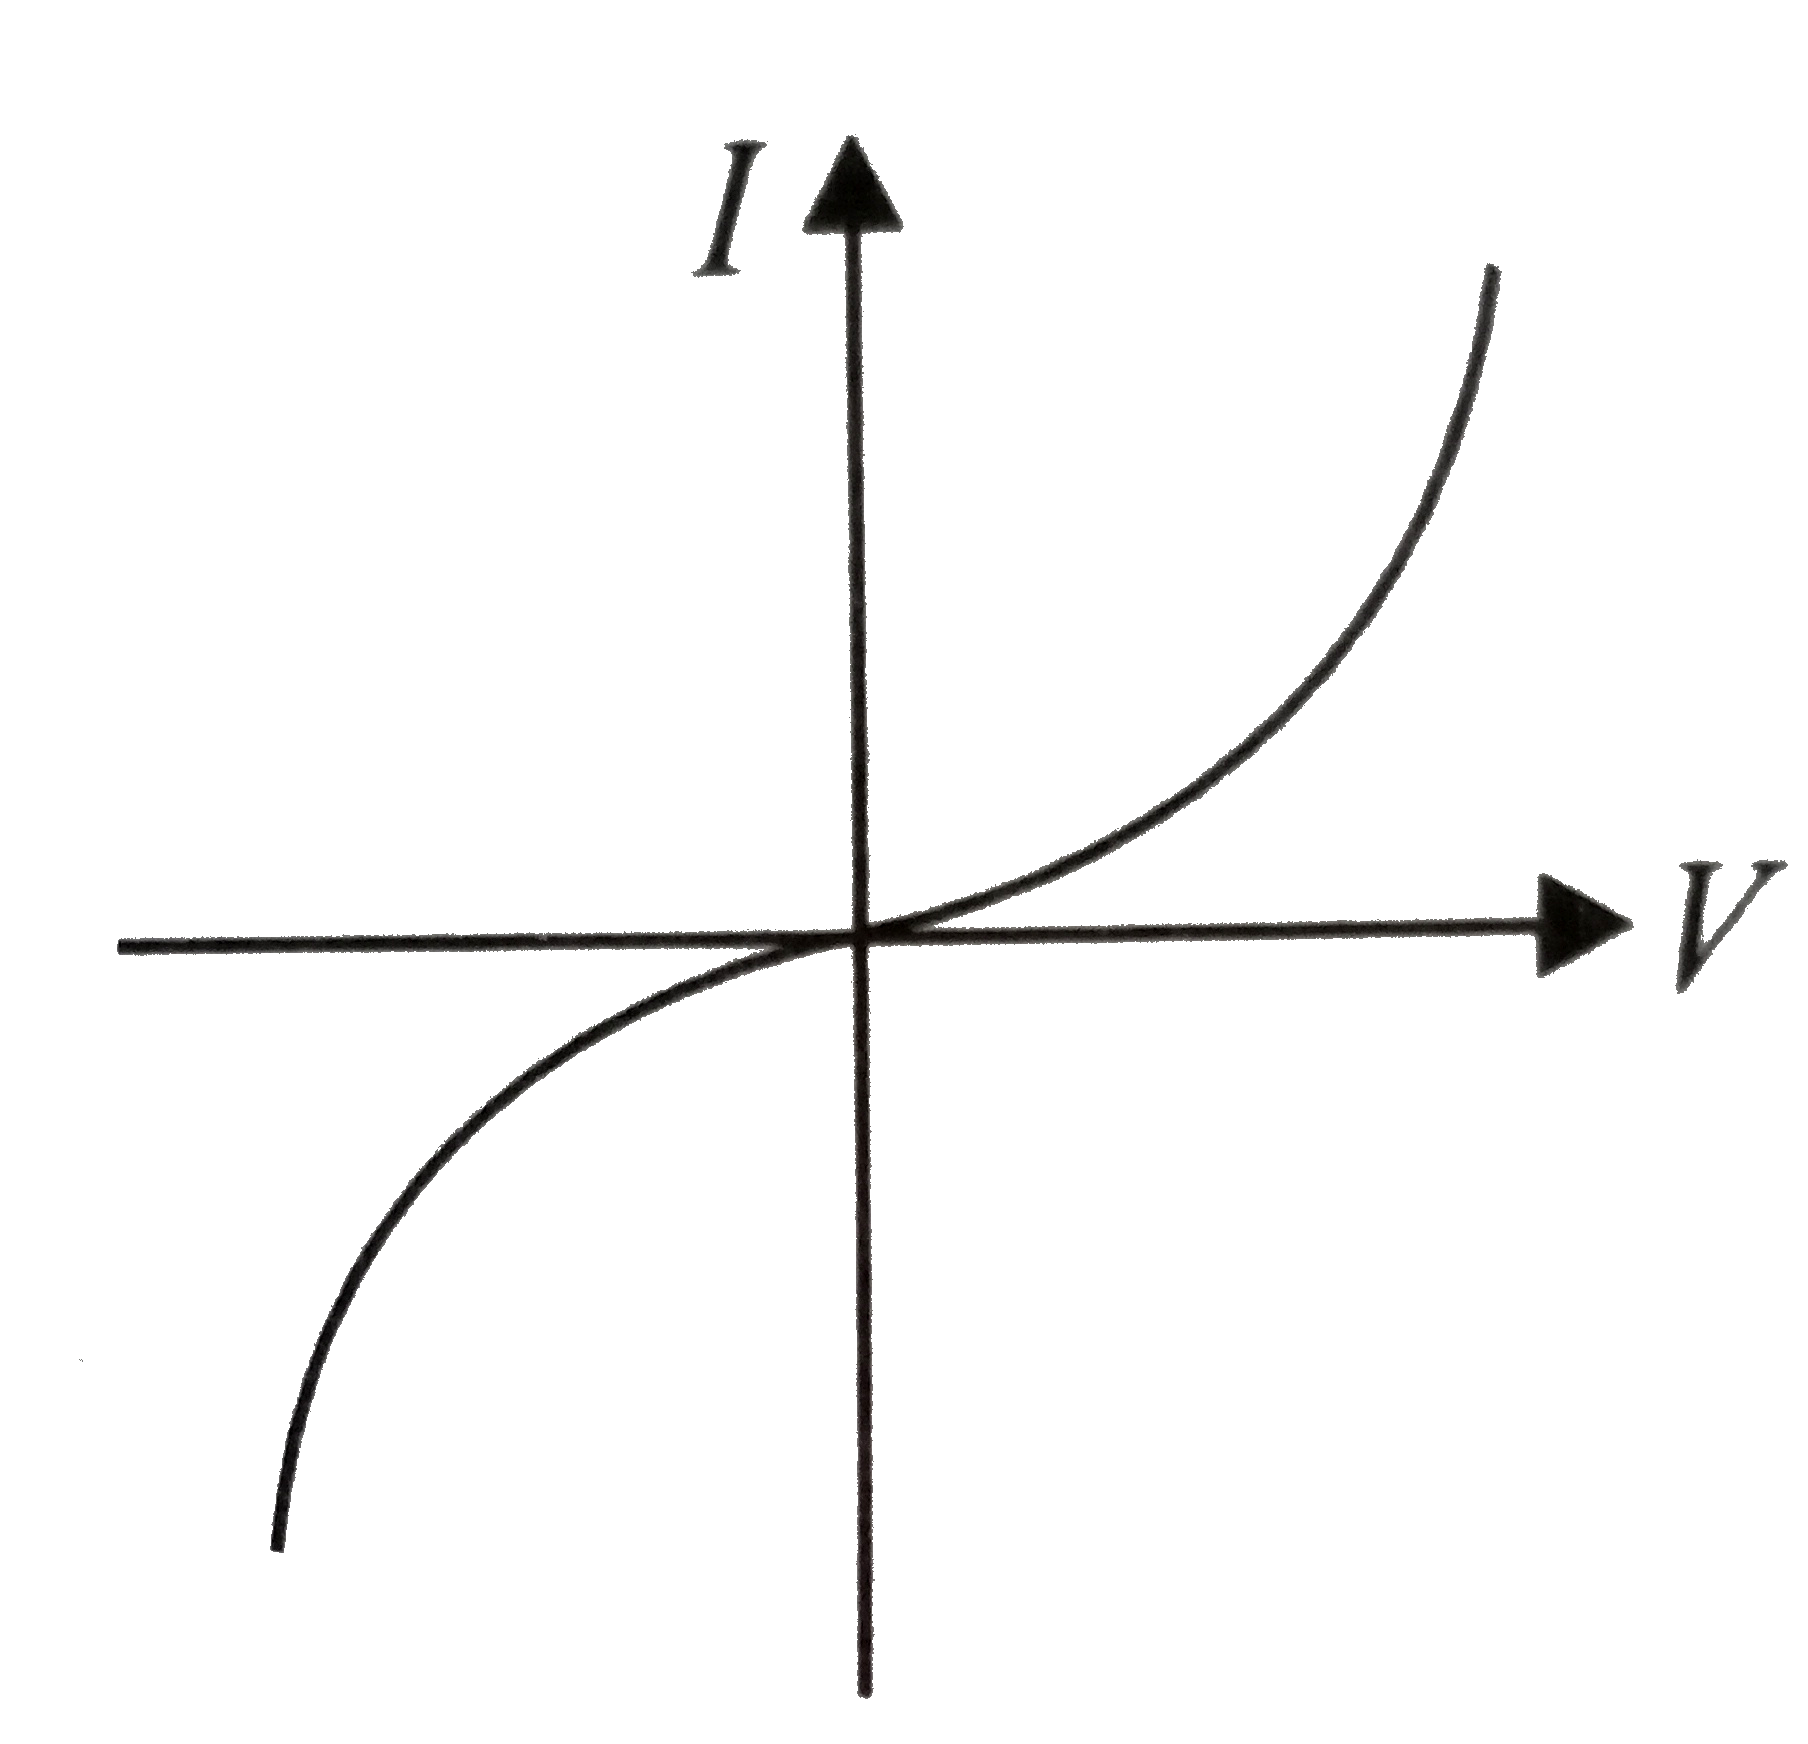
The I-V characteristics shown in the figure represents
 Aohmic conductorsBnon-ohmic conductorsCinsulatorsDsuperconductors
One compression and one rarefaction makes two waves.
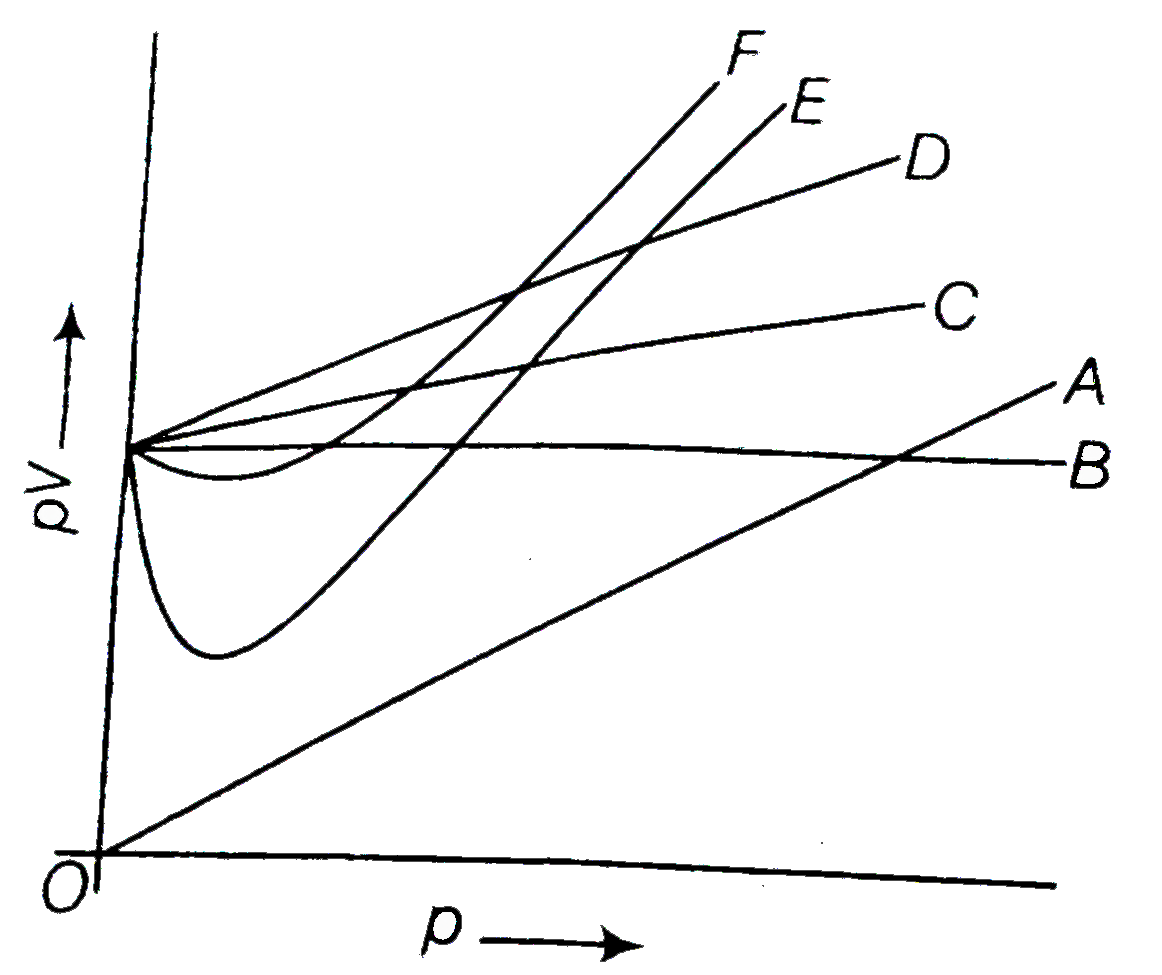
View SolutionWhich curve in figure represents the curve of ideal gas ?

View SolutionWhich curve in figure represents the curve of ideal gas ?

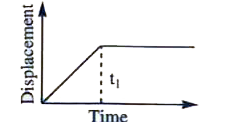
View SolutionThe x-t graph shown in figure represents

View SolutionDraw a longitudinal wave and mark its compressions and rarefactions.
View SolutionWhich of the curves in figure represents the relation between Celsius and Fahrenheit temperatures? <br>

View SolutionThe x-t graph shown in figure represents.

View Solution
