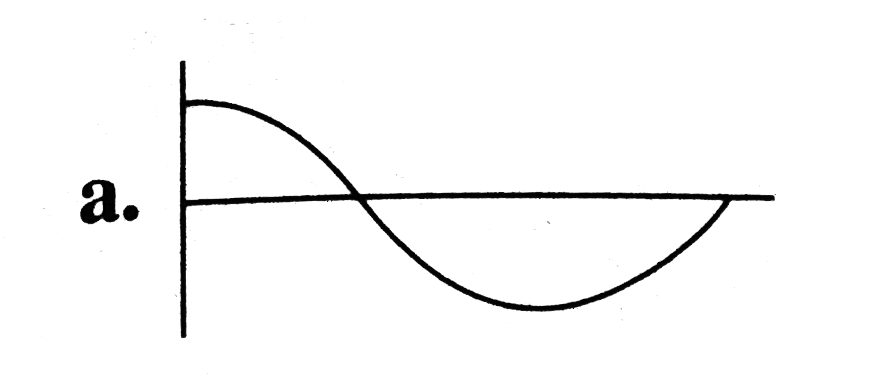
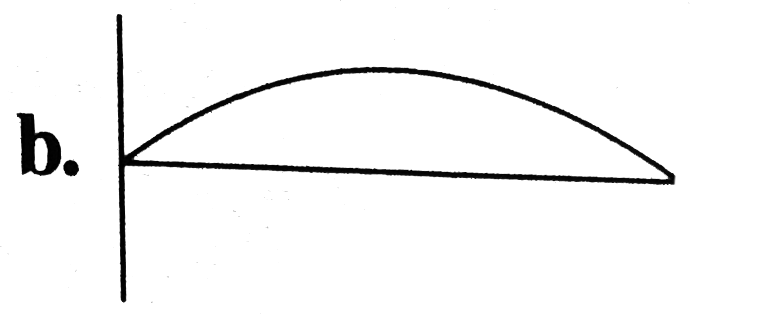
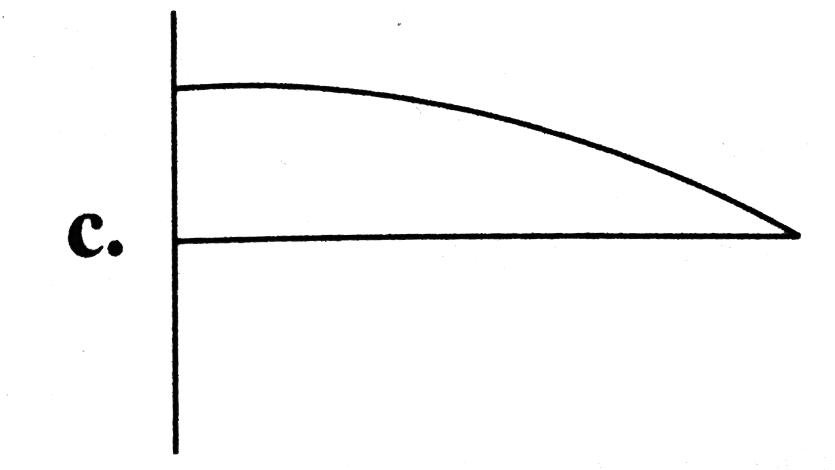
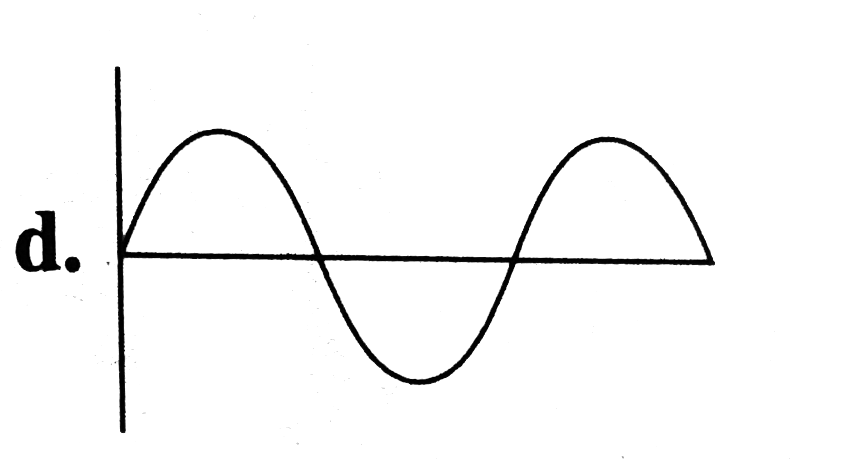
Which of the figures, shows the pressure difference from regular atmospheric pressure for an organ pipe of length L closed at one end, corresponds to the 1st overtime for the pipe ?
The correct Answer is:A
To solve the problem of identifying which figure corresponds to the pressure difference from regular atmospheric pressure for an organ pipe of length L closed at one end, we need to understand the behavior of standing waves in such a pipe.
1. Understanding the Organ Pipe Configuration:
- An organ pipe closed at one end has one end (the closed end) acting as a displacement node (where the air does not move) and the other end (the open end) acting as a displacement antinode (where the air moves maximally).
2. Identifying the Fundamental Frequency:
- The fundamental frequency (first harmonic) for a closed organ pipe has one node at the closed end and one antinode at the open end. This configuration creates a quarter wavelength (λ4) in the length of the pipe L.
3. Understanding Overtones:
- The first overtone (second harmonic) for a closed organ pipe has one node at the closed end, one antinode at the open end, and an additional node and antinode in between. This results in three-quarters of a wavelength fitting in the length of the pipe, which can be represented as 3λ4.
4. Visualizing the Pressure Difference:
- In terms of pressure difference, the closed end corresponds to a pressure node (minimum pressure), while the open end corresponds to a pressure antinode (maximum pressure). For the first overtone, we will have a pattern that shows one node and two antinodes along the length of the pipe.
5. Analyzing the Given Figures:
- We need to look for a figure that shows three quarter loops (or three pressure variations) along the length of the pipe. Each quarter loop corresponds to a change in pressure from maximum to minimum.
6. Selecting the Correct Option:
- Among the options provided, we need to identify the figure that shows three quarter loops. This can be visualized as having one node at the closed end, one antinode at the open end, and one additional node and antinode in between.
7. Conclusion:
- After analyzing the figures, we find that option (a) is the correct representation of the pressure difference for the first overtone in a closed organ pipe, as it shows three quarter loops.
Final Answer:
The correct figure that corresponds to the pressure difference from regular atmospheric pressure for an organ pipe of length L closed at one end, representing the first overtone, is option (a).
- An organ pipe closed at one end has one end (the closed end) acting as a displacement node (where the air does not move) and the other end (the open end) acting as a displacement antinode (where the air moves maximally).
- The fundamental frequency (first harmonic) for a closed organ pipe has one node at the closed end and one antinode at the open end. This configuration creates a quarter wavelength (λ4) in the length of the pipe L.
- The first overtone (second harmonic) for a closed organ pipe has one node at the closed end, one antinode at the open end, and an additional node and antinode in between. This results in three-quarters of a wavelength fitting in the length of the pipe, which can be represented as 3λ4.
- In terms of pressure difference, the closed end corresponds to a pressure node (minimum pressure), while the open end corresponds to a pressure antinode (maximum pressure). For the first overtone, we will have a pattern that shows one node and two antinodes along the length of the pipe.
- We need to look for a figure that shows three quarter loops (or three pressure variations) along the length of the pipe. Each quarter loop corresponds to a change in pressure from maximum to minimum.
- Among the options provided, we need to identify the figure that shows three quarter loops. This can be visualized as having one node at the closed end, one antinode at the open end, and one additional node and antinode in between.
- After analyzing the figures, we find that option (a) is the correct representation of the pressure difference for the first overtone in a closed organ pipe, as it shows three quarter loops.
The correct figure that corresponds to the pressure difference from regular atmospheric pressure for an organ pipe of length L closed at one end, representing the first overtone, is option (a).
Topper's Solved these Questions
- BOOK - CENGAGE PHYSICS ENGLISHCHAPTER - SUPERPOSITION AND STANDING WAVESEXERCISE - Multiple26videos
SUPERPOSITION AND STANDING WAVES
- BOOK - CENGAGE PHYSICS ENGLISHCHAPTER - SUPERPOSITION AND STANDING WAVESEXERCISE - Assertion - Reasoning6videos
SUPERPOSITION AND STANDING WAVES
- BOOK - CENGAGE PHYSICS ENGLISHCHAPTER - SUPERPOSITION AND STANDING WAVESEXERCISE - Subjective24videos
SUPERPOSITION AND STANDING WAVES
- BOOK - CENGAGE PHYSICS ENGLISHCHAPTER - SOUND WAVES AND DOPPLER EFFECTEXERCISE - Integer16videos
SOUND WAVES AND DOPPLER EFFECT
- BOOK - CENGAGE PHYSICS ENGLISHCHAPTER - THERMODYNAMICSEXERCISE - 241videos
THERMODYNAMICS
Similar Questions
In closed organ pipe at one end-
 View Solution
A closed organ pipe (closed at one end) is excited to support the third overtone. It is found that air in the pipe has
View SolutionShow that an organ pipe of length 2l open at both ends has the same fundamental frequency as another pipe of length I closed at one end.
View SolutionAn open organ pipe of length L vibrates in its fundamental mode. The pressure variation is maximum
View SolutionVelocity of sound in air is 320 m/s. For an organ pipe closed at one end of length 2 m the resonating frequency may be
View SolutionAn open organ pipe of length L vibrates in its second harmonic mode. The correct statement about the Pressure variation is
View Solution(a) Explain the formation of standing waves in an organ pipe closed at one end and discuss the various modes of vibration.
View SolutionIn closed organ pipe at one end…………….
 View Solution
The frequency of the 5th harmonic of a pipe closed at one end is 680 Hz. If the speed of the sound is 340 m/s then the length of the pipe will be
View Solution(A): A person hears maximum sound at displacement anti node (or) pressure node.
(B) : Two organ pipes of same length open at both ends produce sound of different pitch if their radii are different.
(C): If oil of density higher than water is filled in place of water in a resonance tube, its frequency remain unchanged.View Solution

