The two ends of a uniform conductor are joined to a cell of e.m.f. E and some internal resistance. Starting from the midpoint P of the conductor, we move in the direction of current and return to P. The potential V at every point on the path is plotted against the distance covered (x). which of the following graphs best represent the resulting curve ?
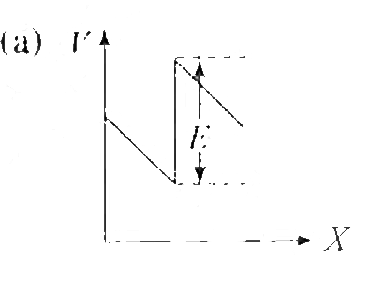
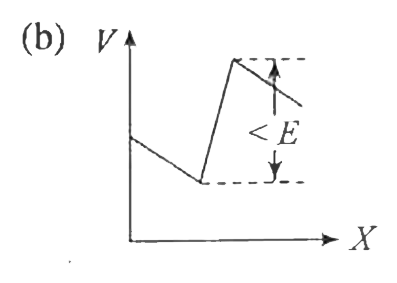
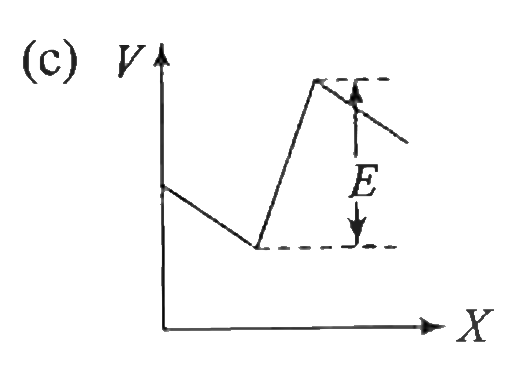
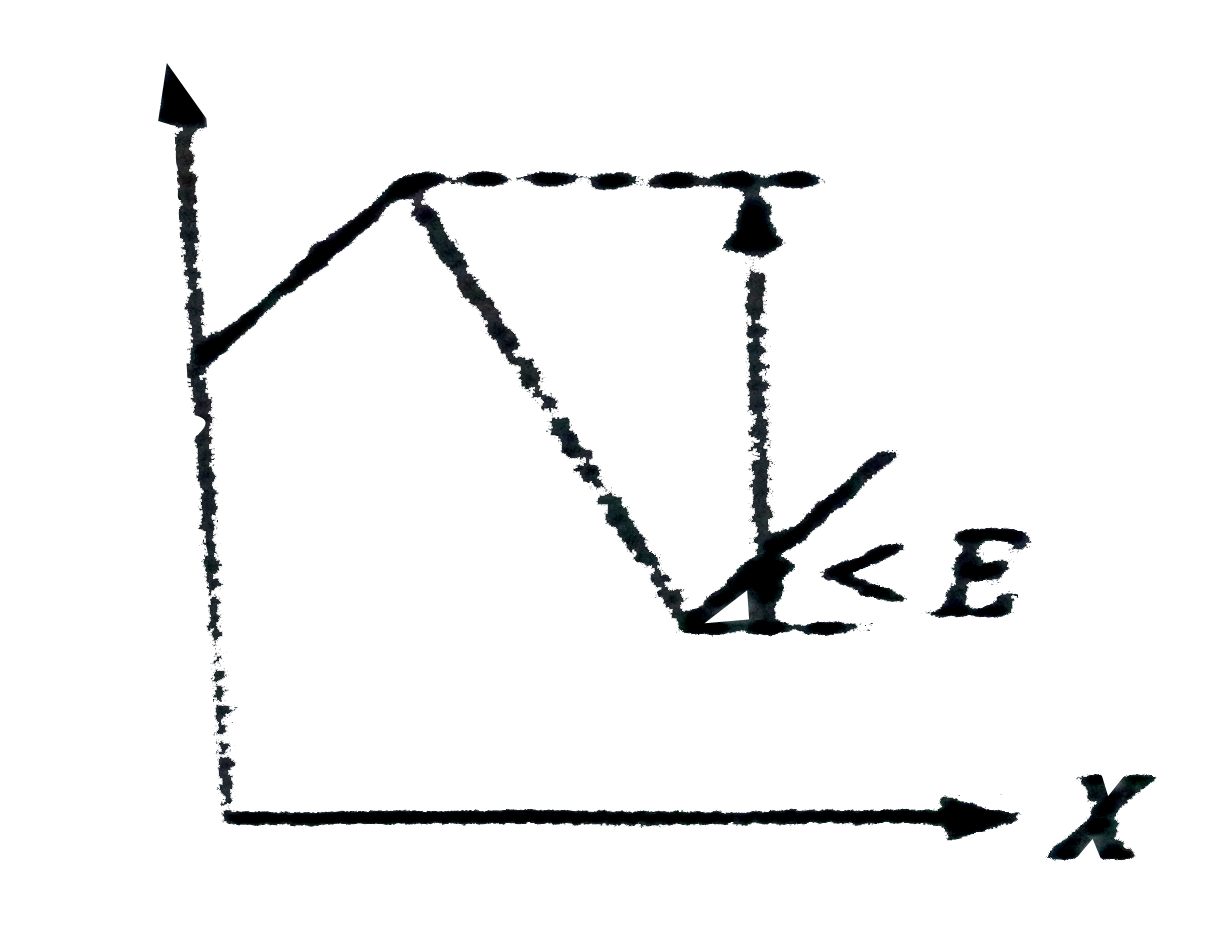
The correct Answer is:B
To solve the problem, we need to analyze the behavior of potential V as we move along a uniform conductor connected to a cell with an electromotive force (e.m.f.) E and some internal resistance.
1. Understanding the Setup:
- We have a uniform conductor connected to a cell with e.m.f. E.
- The conductor has some internal resistance, which affects the potential difference across it.
2. Identifying the Midpoint:
- We start from the midpoint P of the conductor. This is our reference point where we will measure the potential.
3. Moving in the Direction of Current:
- As we move in the direction of the current from point P to one end of the conductor, the potential V decreases linearly.
- This decrease is due to the resistance of the conductor; the potential drop across the conductor is proportional to the distance moved.
4. Reaching the End of the Conductor:
- At the end of the conductor, the potential will be at its minimum value. Let’s denote this point as B.
5. Entering the Cell:
- When we reach the end of the conductor and start to enter the cell, the potential will increase as we move from the negative terminal to the positive terminal of the cell.
- This increase is equal to the e.m.f. E of the cell, but due to the internal resistance, the potential will always be less than E.
6. Returning to the Midpoint:
- As we move back towards the midpoint P, the potential will again decrease linearly as we move back through the conductor.
7. Graph Representation:
- The graph of potential V against distance x will show a linear decrease as we move away from P to B, followed by a linear increase as we move through the cell and return to P.
- This process will repeat, showing a sawtooth pattern in the graph.
8. Choosing the Correct Graph:
- Among the given options, we need to select the graph that shows a linear decrease followed by a linear increase, while also ensuring that the potential remains less than E throughout the process.
Conclusion:
- The correct graph will show a linear decrease in potential as we move away from the midpoint, followed by a linear increase as we return through the cell, and this pattern will repeat.
- We have a uniform conductor connected to a cell with e.m.f. E.
- The conductor has some internal resistance, which affects the potential difference across it.
- We start from the midpoint P of the conductor. This is our reference point where we will measure the potential.
- As we move in the direction of the current from point P to one end of the conductor, the potential V decreases linearly.
- This decrease is due to the resistance of the conductor; the potential drop across the conductor is proportional to the distance moved.
- At the end of the conductor, the potential will be at its minimum value. Let’s denote this point as B.
- When we reach the end of the conductor and start to enter the cell, the potential will increase as we move from the negative terminal to the positive terminal of the cell.
- This increase is equal to the e.m.f. E of the cell, but due to the internal resistance, the potential will always be less than E.
- As we move back towards the midpoint P, the potential will again decrease linearly as we move back through the conductor.
- The graph of potential V against distance x will show a linear decrease as we move away from P to B, followed by a linear increase as we move through the cell and return to P.
- This process will repeat, showing a sawtooth pattern in the graph.
- Among the given options, we need to select the graph that shows a linear decrease followed by a linear increase, while also ensuring that the potential remains less than E throughout the process.
- The correct graph will show a linear decrease in potential as we move away from the midpoint, followed by a linear increase as we return through the cell, and this pattern will repeat.
Topper's Solved these Questions
- BOOK - CENGAGE PHYSICS ENGLISHCHAPTER - ELECTRIC CURRENT & CIRCUITSEXERCISE - Combination of Resistance 214videos
ELECTRIC CURRENT & CIRCUITS
- BOOK - CENGAGE PHYSICS ENGLISHCHAPTER - ELECTRIC CURRENT & CIRCUITSEXERCISE - Kirchhoff s Law and Grouping Cells15videos
ELECTRIC CURRENT & CIRCUITS
- BOOK - CENGAGE PHYSICS ENGLISHCHAPTER - ELECTRIC CURRENT & CIRCUITSEXERCISE - Kirchhoff s law and simple circuits15videos
ELECTRIC CURRENT & CIRCUITS
- BOOK - CENGAGE PHYSICS ENGLISHCHAPTER - COULOMB LAW AND ELECTRIC FIELDEXERCISE - Single Answer Correct Type22videos
COULOMB LAW AND ELECTRIC FIELD
- BOOK - CENGAGE PHYSICS ENGLISHCHAPTER - ELECTRIC CURRENT AND CIRCUITEXERCISE - Interger8videos
ELECTRIC CURRENT AND CIRCUIT
Similar Questions
A current of two amperes is flowing through a cell of e.m.f. 5 volts and internal resistance 0.5 ohm from negative to positive electrode. If the potential of negative electrode is 10 V , the potential of positive electrode will be
View SolutionTwo parallel beams of protons and electrons, carrying equal currents are fixed at a separation d. The protons and electrons move in opposite directions. P is a point on a line joining the beams , at a distacne x from any one beam. The magnetic field at P is B . If B is plotted against x, which of the following best represents the resulting curve
View SolutionTwo ideantical point charges are placed at a separation of d. P is a point on the line joining the charges, at a distance x from any one charge. The field at P is E,E is plotted against x for value of x from close to zero to slightly less then d. Which of the following represents the resulting curve
View SolutionE denotes electric field in a uniform conductor, I corresponding current through it, vd velocity of electrons and P denotes thermal power produced in the conductor, then which of the following graph is correct?
View SolutionA cell of e.m.f E and internal resitance r ,is connected to an external resistance R. the variation of potential difference V across the resistance R as function of R as shown in the figure, is the best represented by curve
_PHY_E01_011_Q01.png) View Solution
View SolutionA cell of e.m.f. 'E' and internal resistance 'r' is connected across a variable resistor 'R'. Plot a graph showing the variation of terminal potential 'V' with resistance R.
Predict from the graph the condition under which 'V' becomes equal of 'E'
 View Solution
Two batteries of e.m.f. 4V and 8V with internal resistances 1Ω and 2Ω are connected in a circuit with a resistance of 9Ω as shown in figure. The current and potential difference between the points P and Q
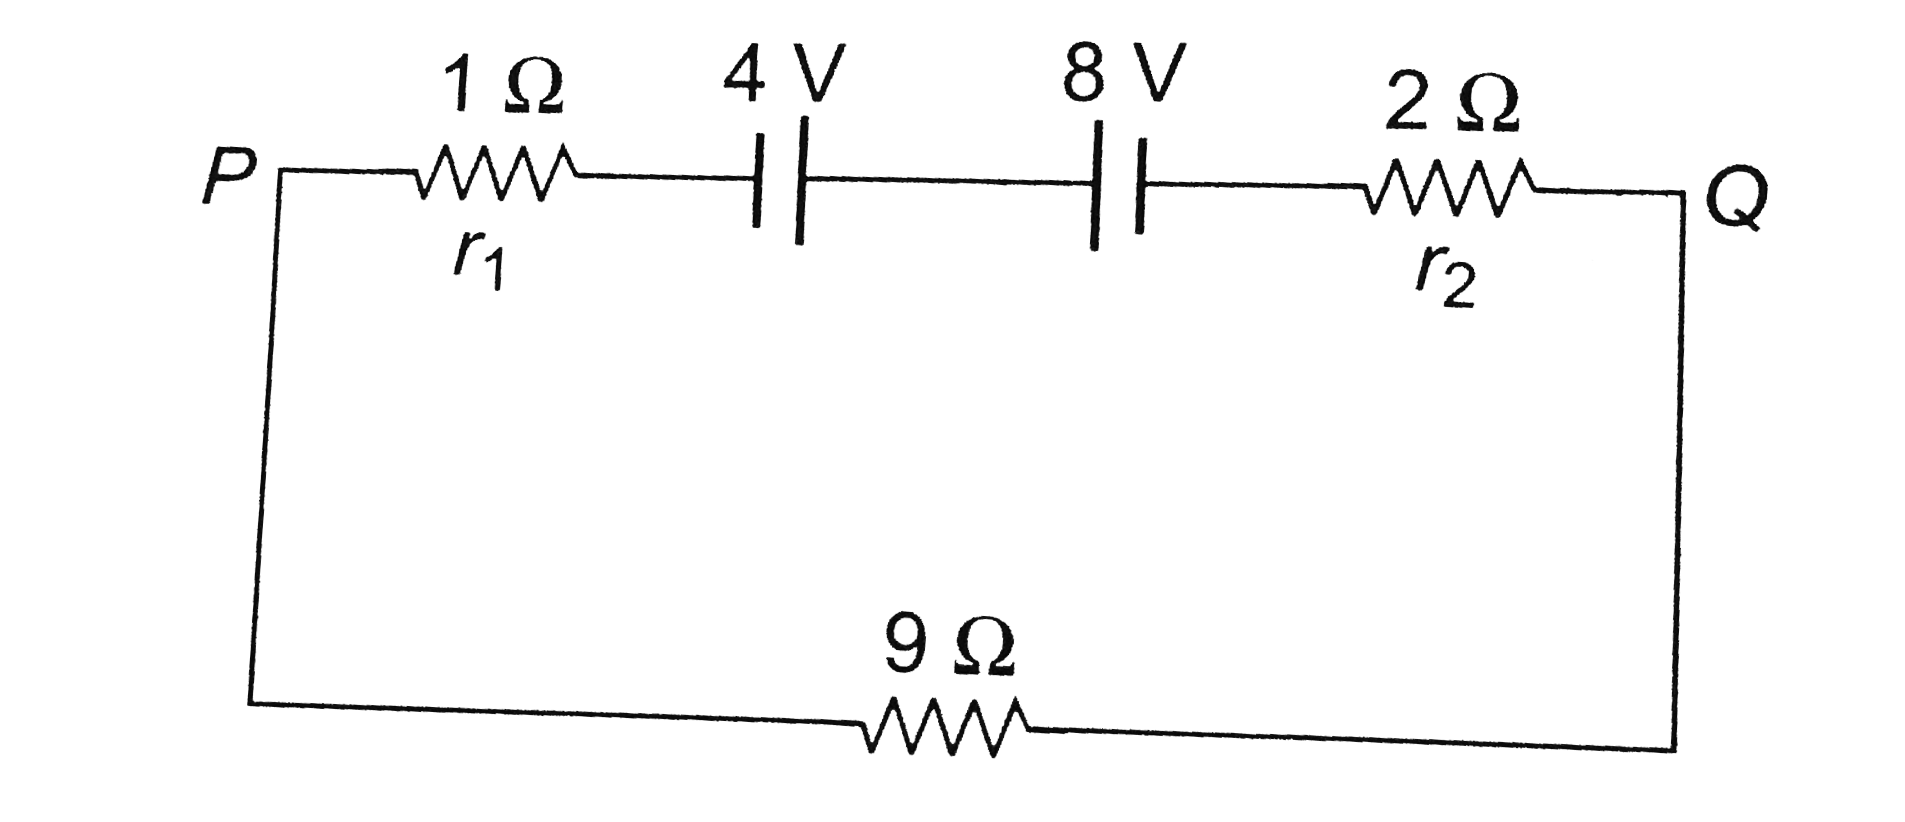 View Solution
We know that when two equal masses are placed on a line then, gravitational force on a third mass is zero due to these two masses when the third is placed at the centre of line joining the two masses. But if third mass is placed anywhere else on the x-axis, the gravitational force acts on that mass due to these two masses. Consider a system shown in figure.
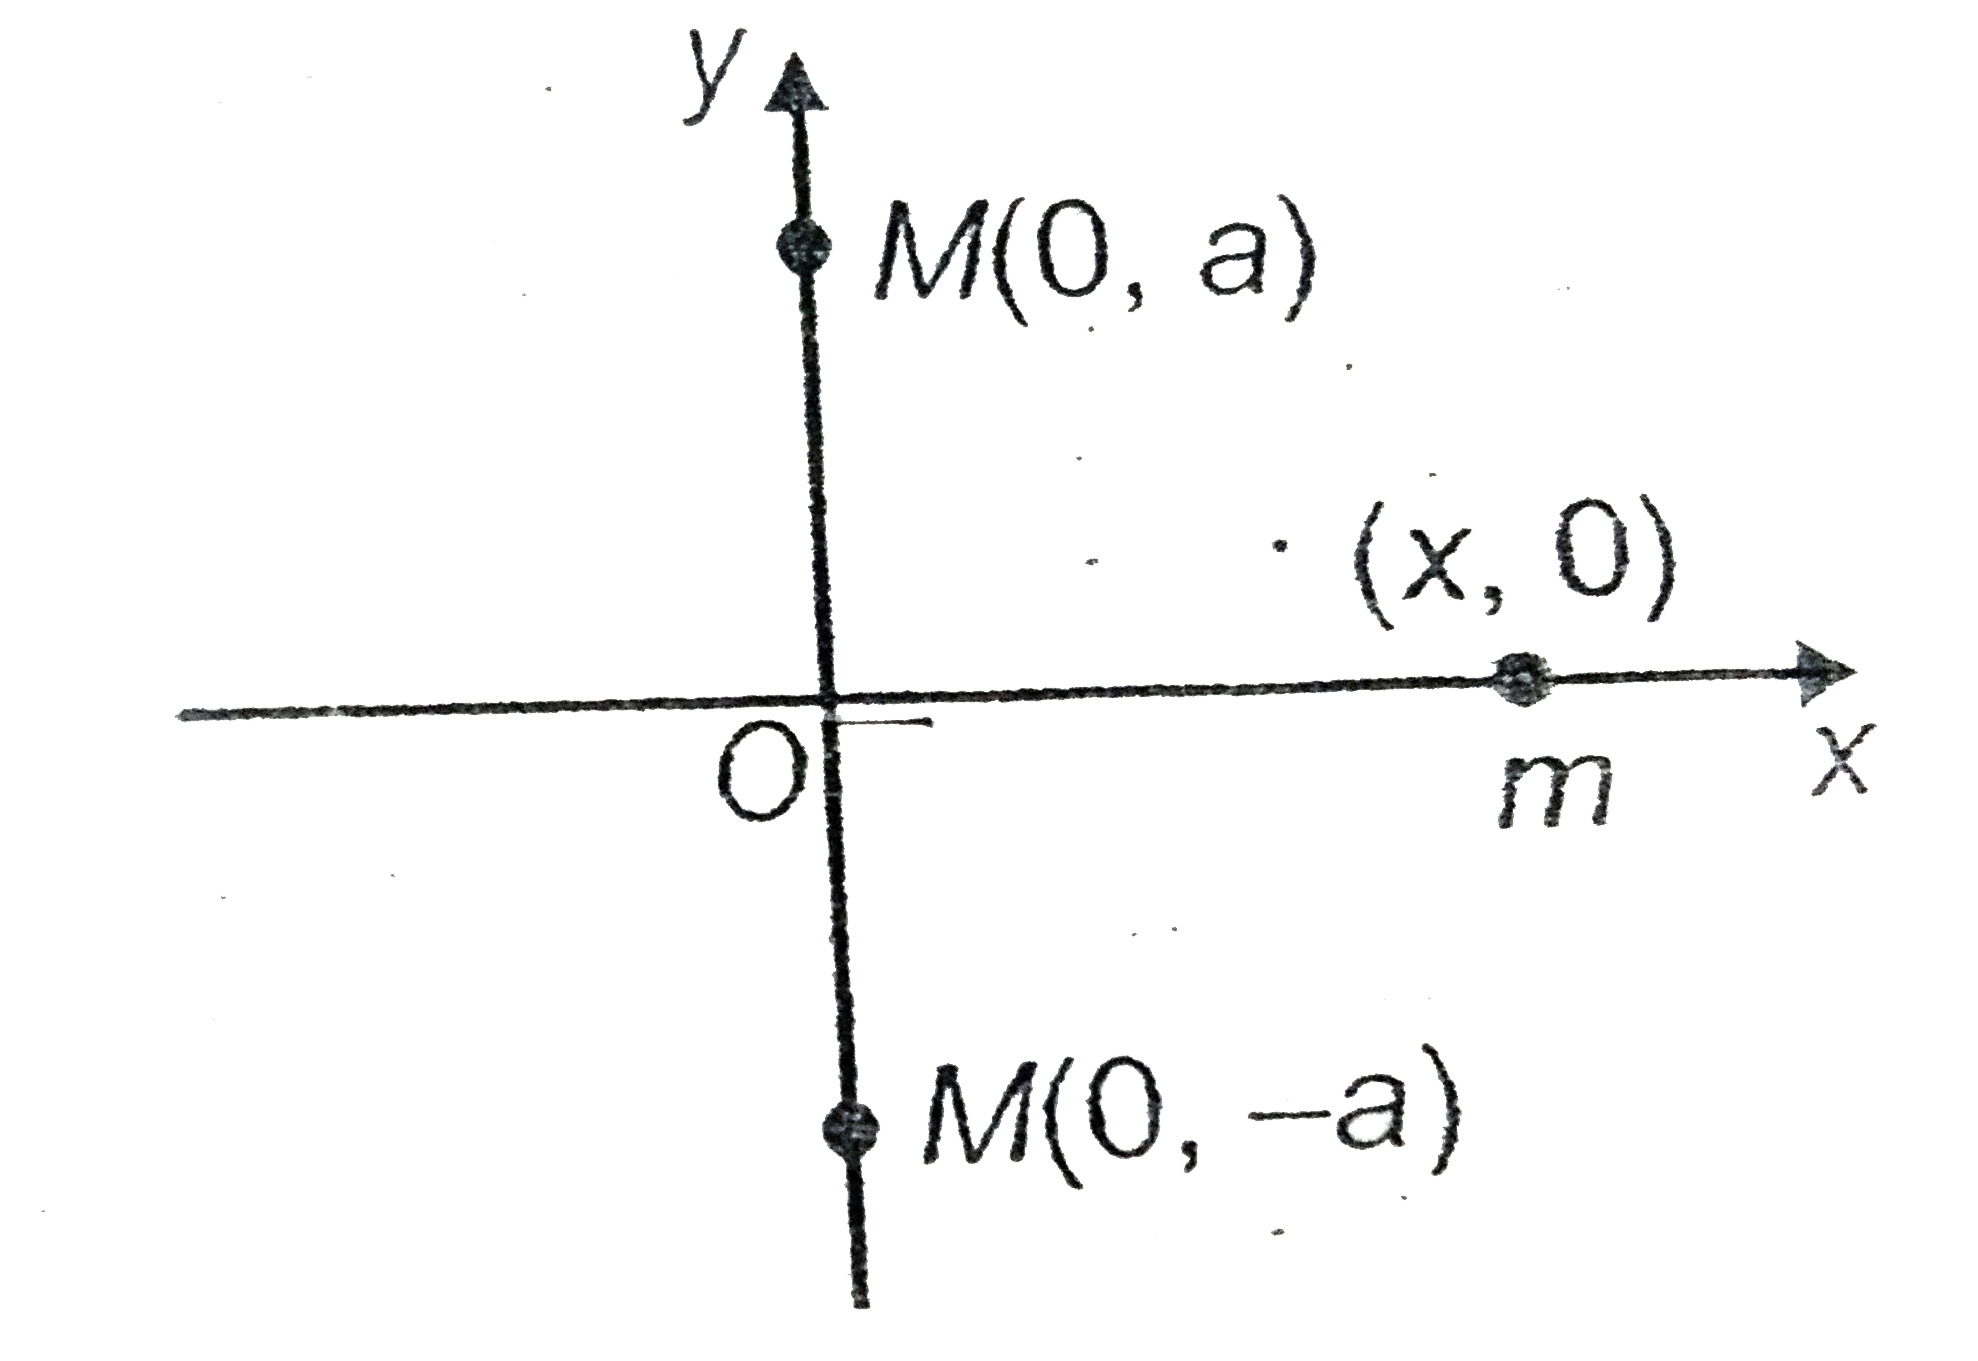
In this system two point masses of mass M each are placed at y-axis at a distance a from origin and these masses are fixed. If a third point mass of mass m is released at a distance x from origin on x-axis, then answer the following questions.
Which of the following graphs best represents the variation of force on mass m with distance x ?View SolutionTwo long parallel horizontal rails a, a distance d aprt and each having a risistance λ per unit length are joing at one end by a resistance R. A perfectly conduction rod MN of mass m is free to slide along the rails without friction (see figure). There is a uniform magnetic field of induction B normal to the plane of the paper and directed into the paper. A variable force F is applied to the rod MN such that, as the rod moves a constant current flows through R.
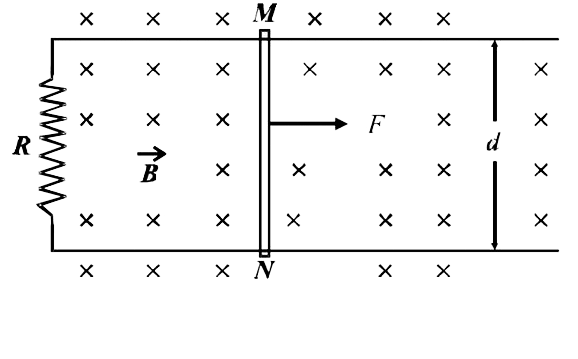
(i) Find the velocity of the rod and the applied force F as function of the distance x of the rod from R.
(ii) What fraction of the work done per second by F is converted into heat?View Solution
In the circuit shown below, the internal resistance of the cell is negligible. The distance of the slider from the left-hand end of the slide wire is l. The graph shows the variation with l of the current I in the cell.
E.M.F. of the cell is:View Solution

