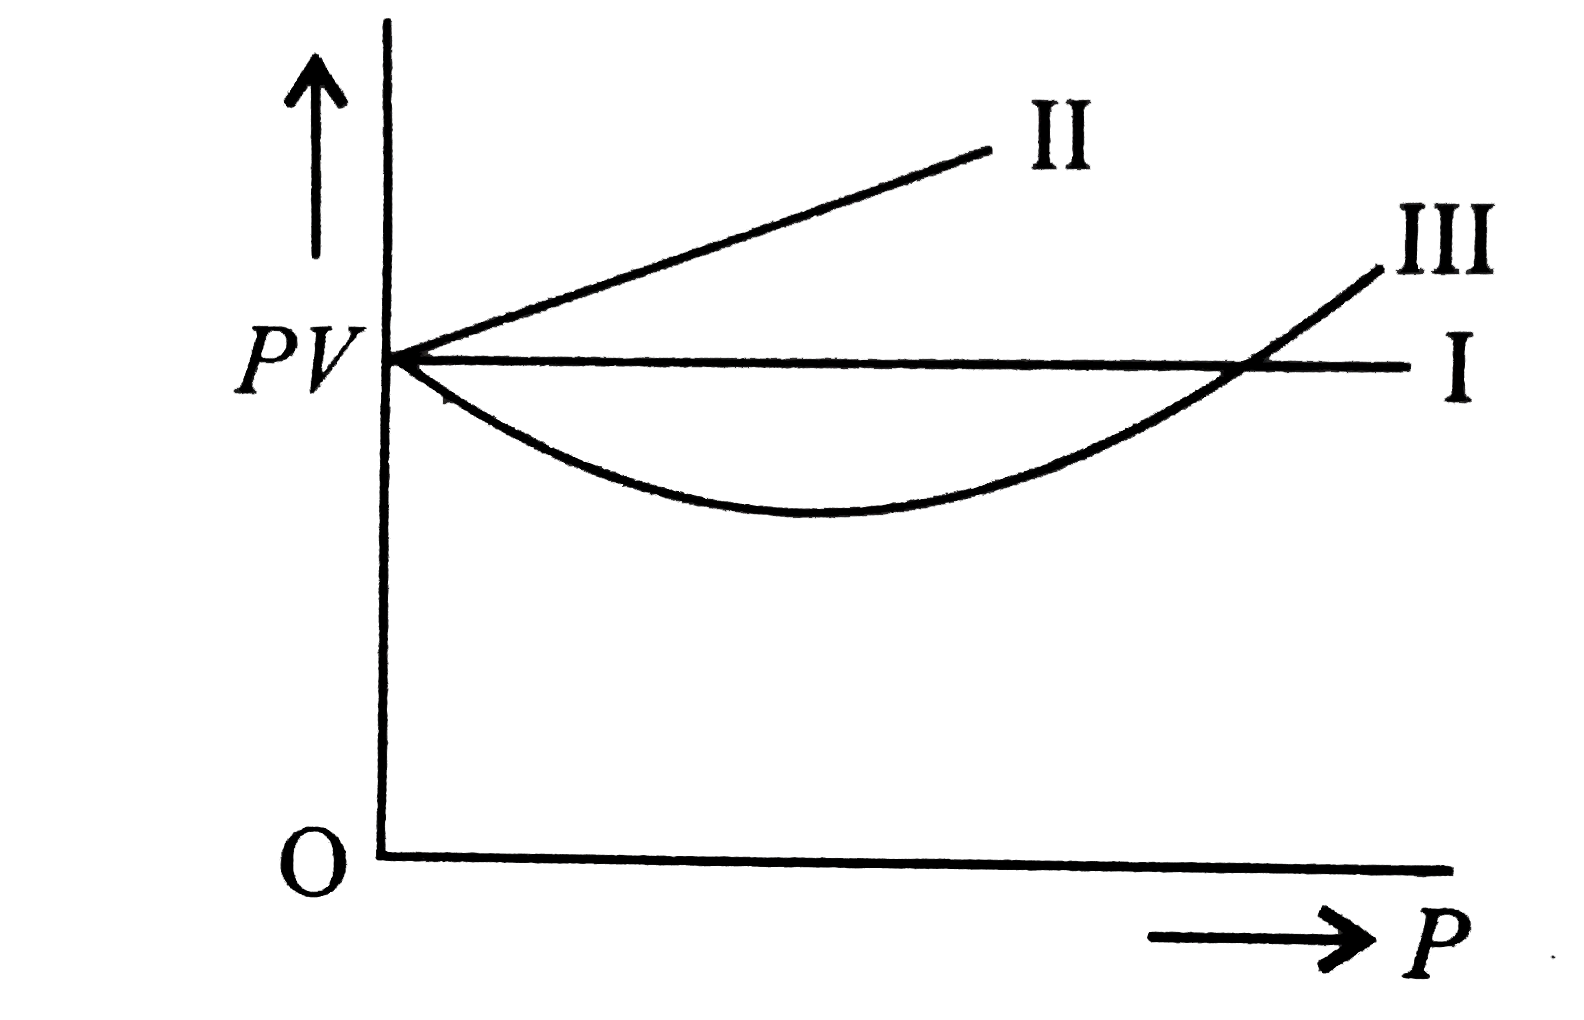
Actual graph for the given parameters in (Q.25) will be
I, III
I, II
II
I
As P increases, PV also increases, hence graph II.
Topper's Solved these Questions
- STATES OF MATTERBook:CENGAGE CHEMISTRY ENGLISHChapter:STATES OF MATTERExercise:Exercises (Assertion-Reasoning)
Explore 24 Videos
- STATES OF MATTERBook:CENGAGE CHEMISTRY ENGLISHChapter:STATES OF MATTERExercise:Exercises (Integer)
Explore 10 Videos
- STATES OF MATTERBook:CENGAGE CHEMISTRY ENGLISHChapter:STATES OF MATTERExercise:Exercises (Multiple Correcttype)
Explore 32 Videos
- SOME BASIC CONCEPTS AND MOLE CONCEPTBook:CENGAGE CHEMISTRY ENGLISHChapter:SOME BASIC CONCEPTS AND MOLE CONCEPTExercise:Archives Subjective
Explore 11 Videos
- STOICHIOMETRYBook:CENGAGE CHEMISTRY ENGLISHChapter:STOICHIOMETRYExercise:Archives Subjective
Explore 33 Videos
Similar Questions
For the given graph, which parameters will be zero?

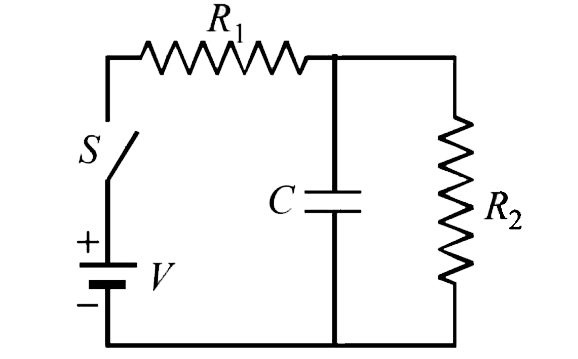
View SolutionIn the given circuit, the switch S is closed at time t = 0 . The charge Q on the capacitor at any instant t is given by Q(t)=Q(1−e−αt). Find the value of Q0 and α in terms of given parameters as shown in the circuit.
 .
.
View SolutionImpact Parameter
View SolutionArrhenius parameter (A) depends on
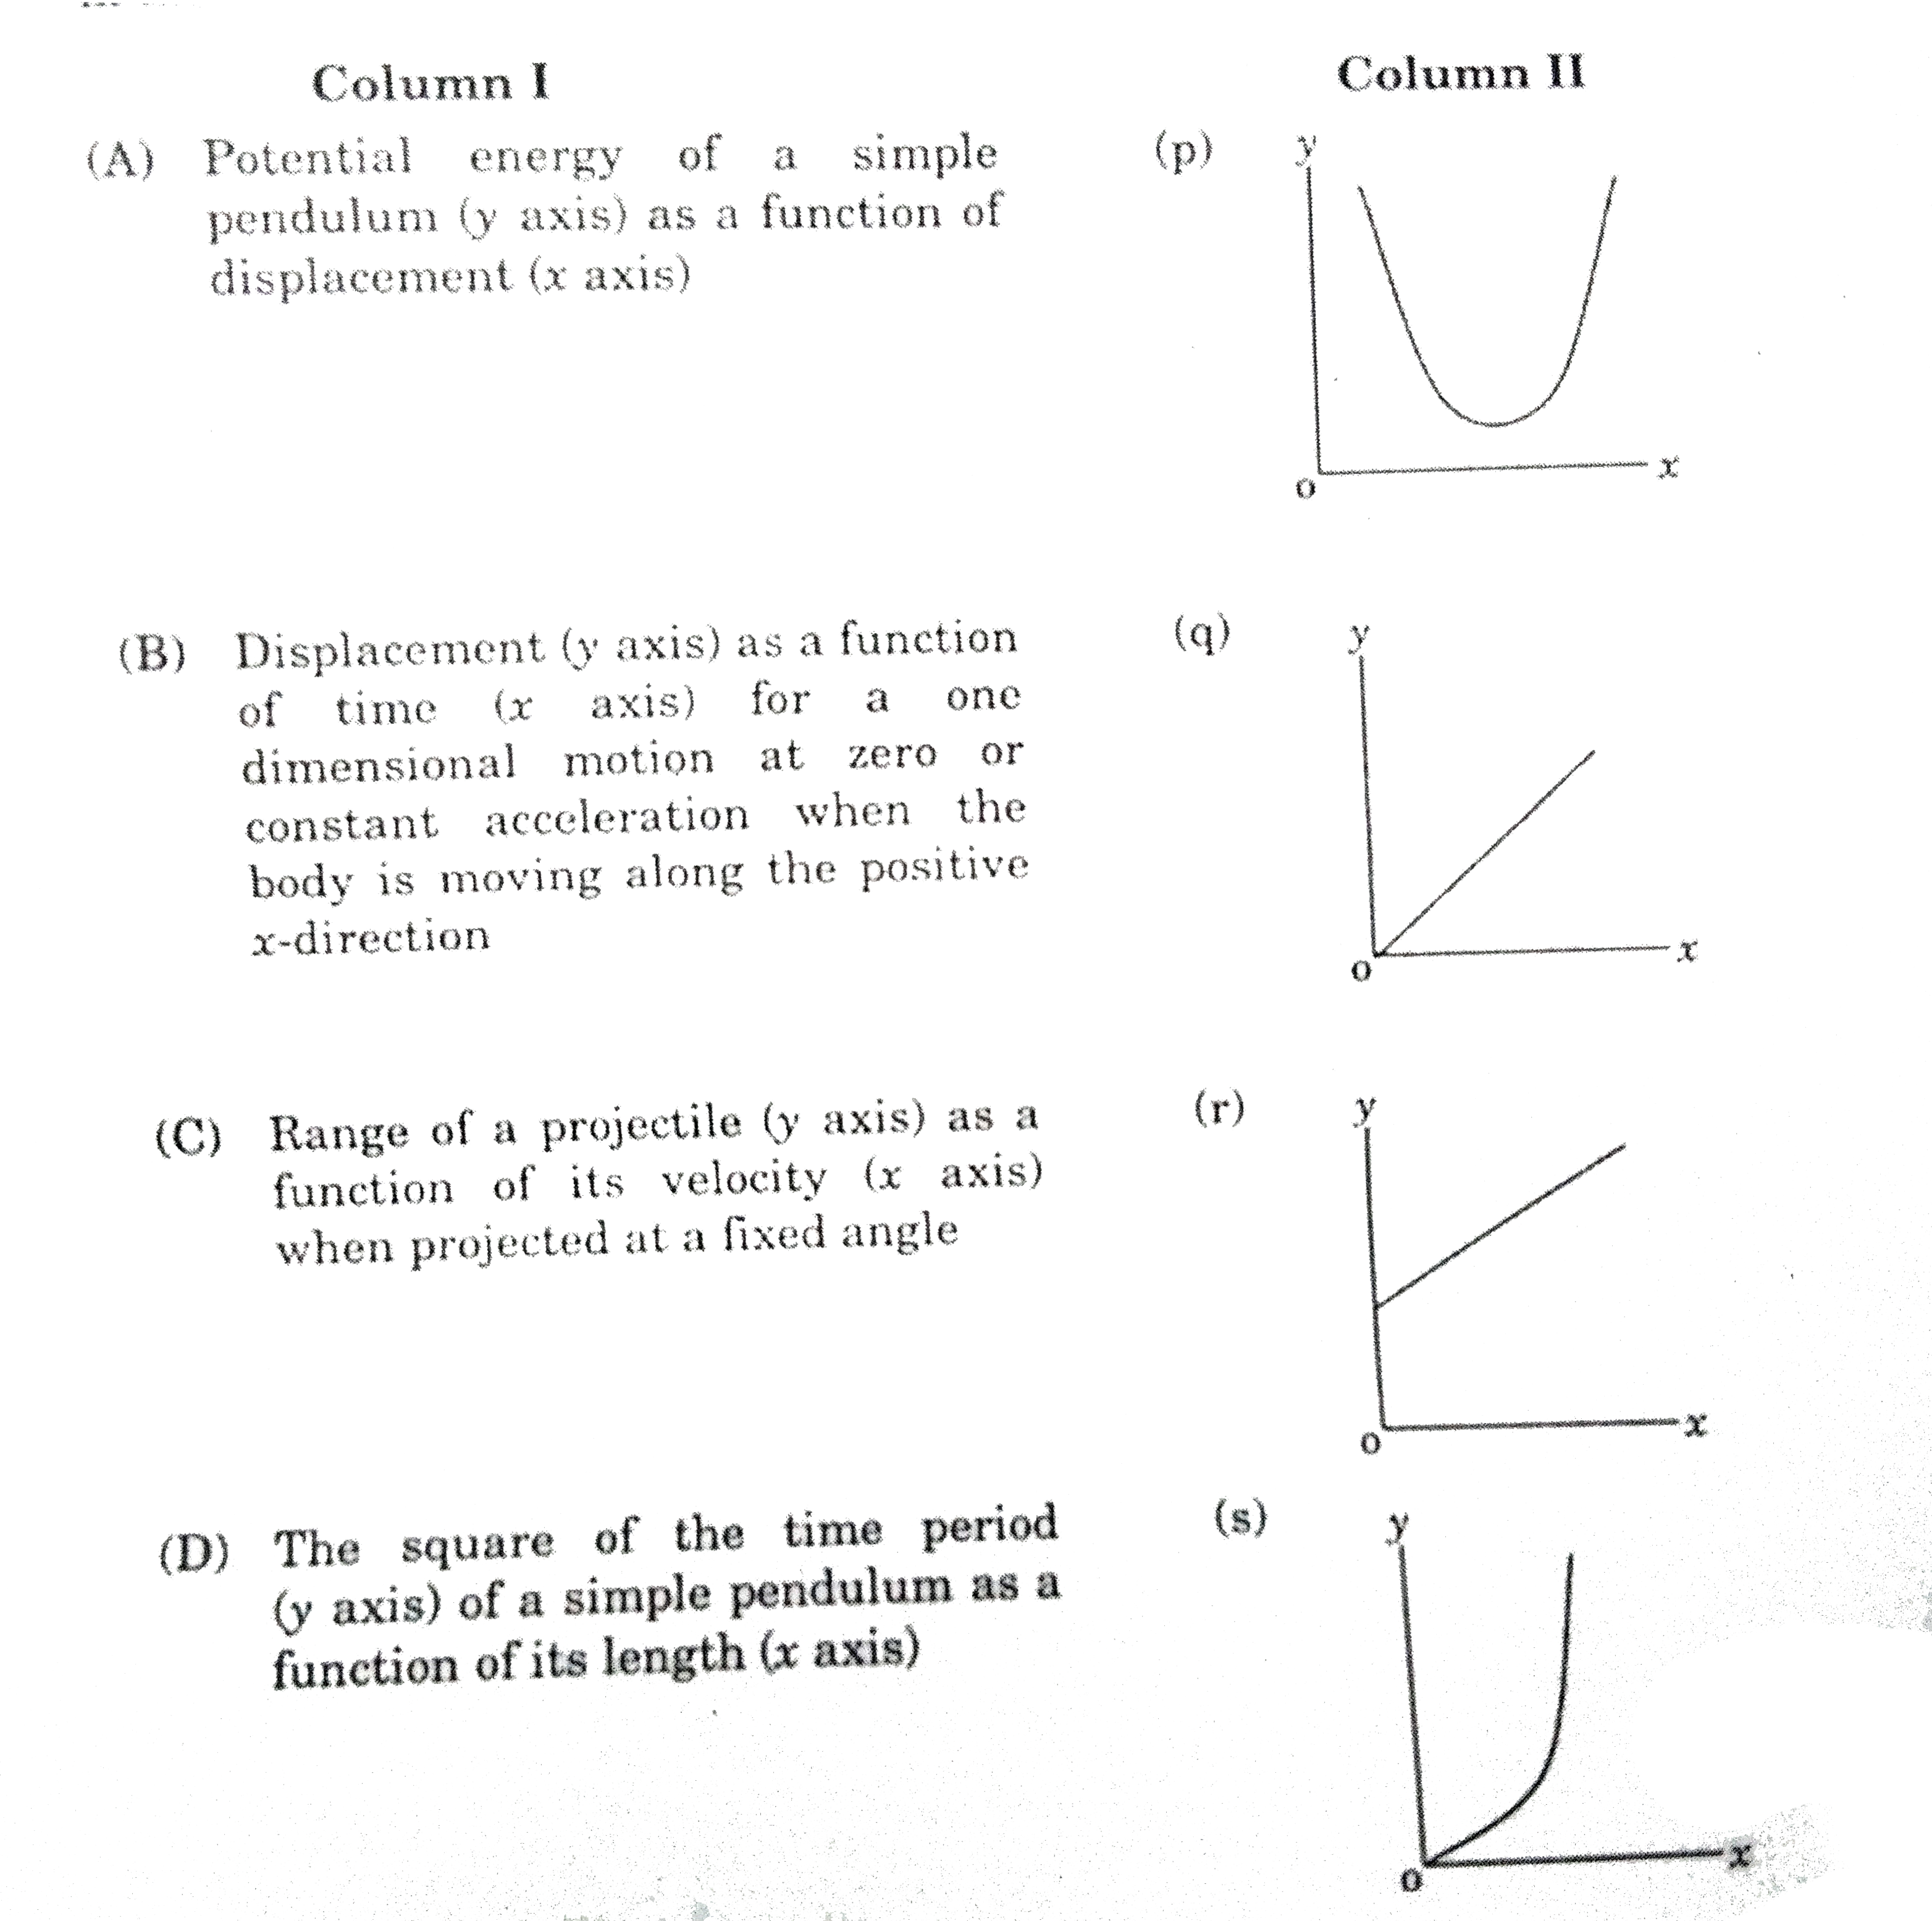
View SolutionColumn I gives a listof possible set of parameters measured in some experiments. The variations of the parameters in the form of graphs are shown in Column II. Match the set of parameters given in Column I with the graphs even in Column II. Indicate your answer by darkening the appropriate bubbles of the 4×4 matrix given in the ORS.
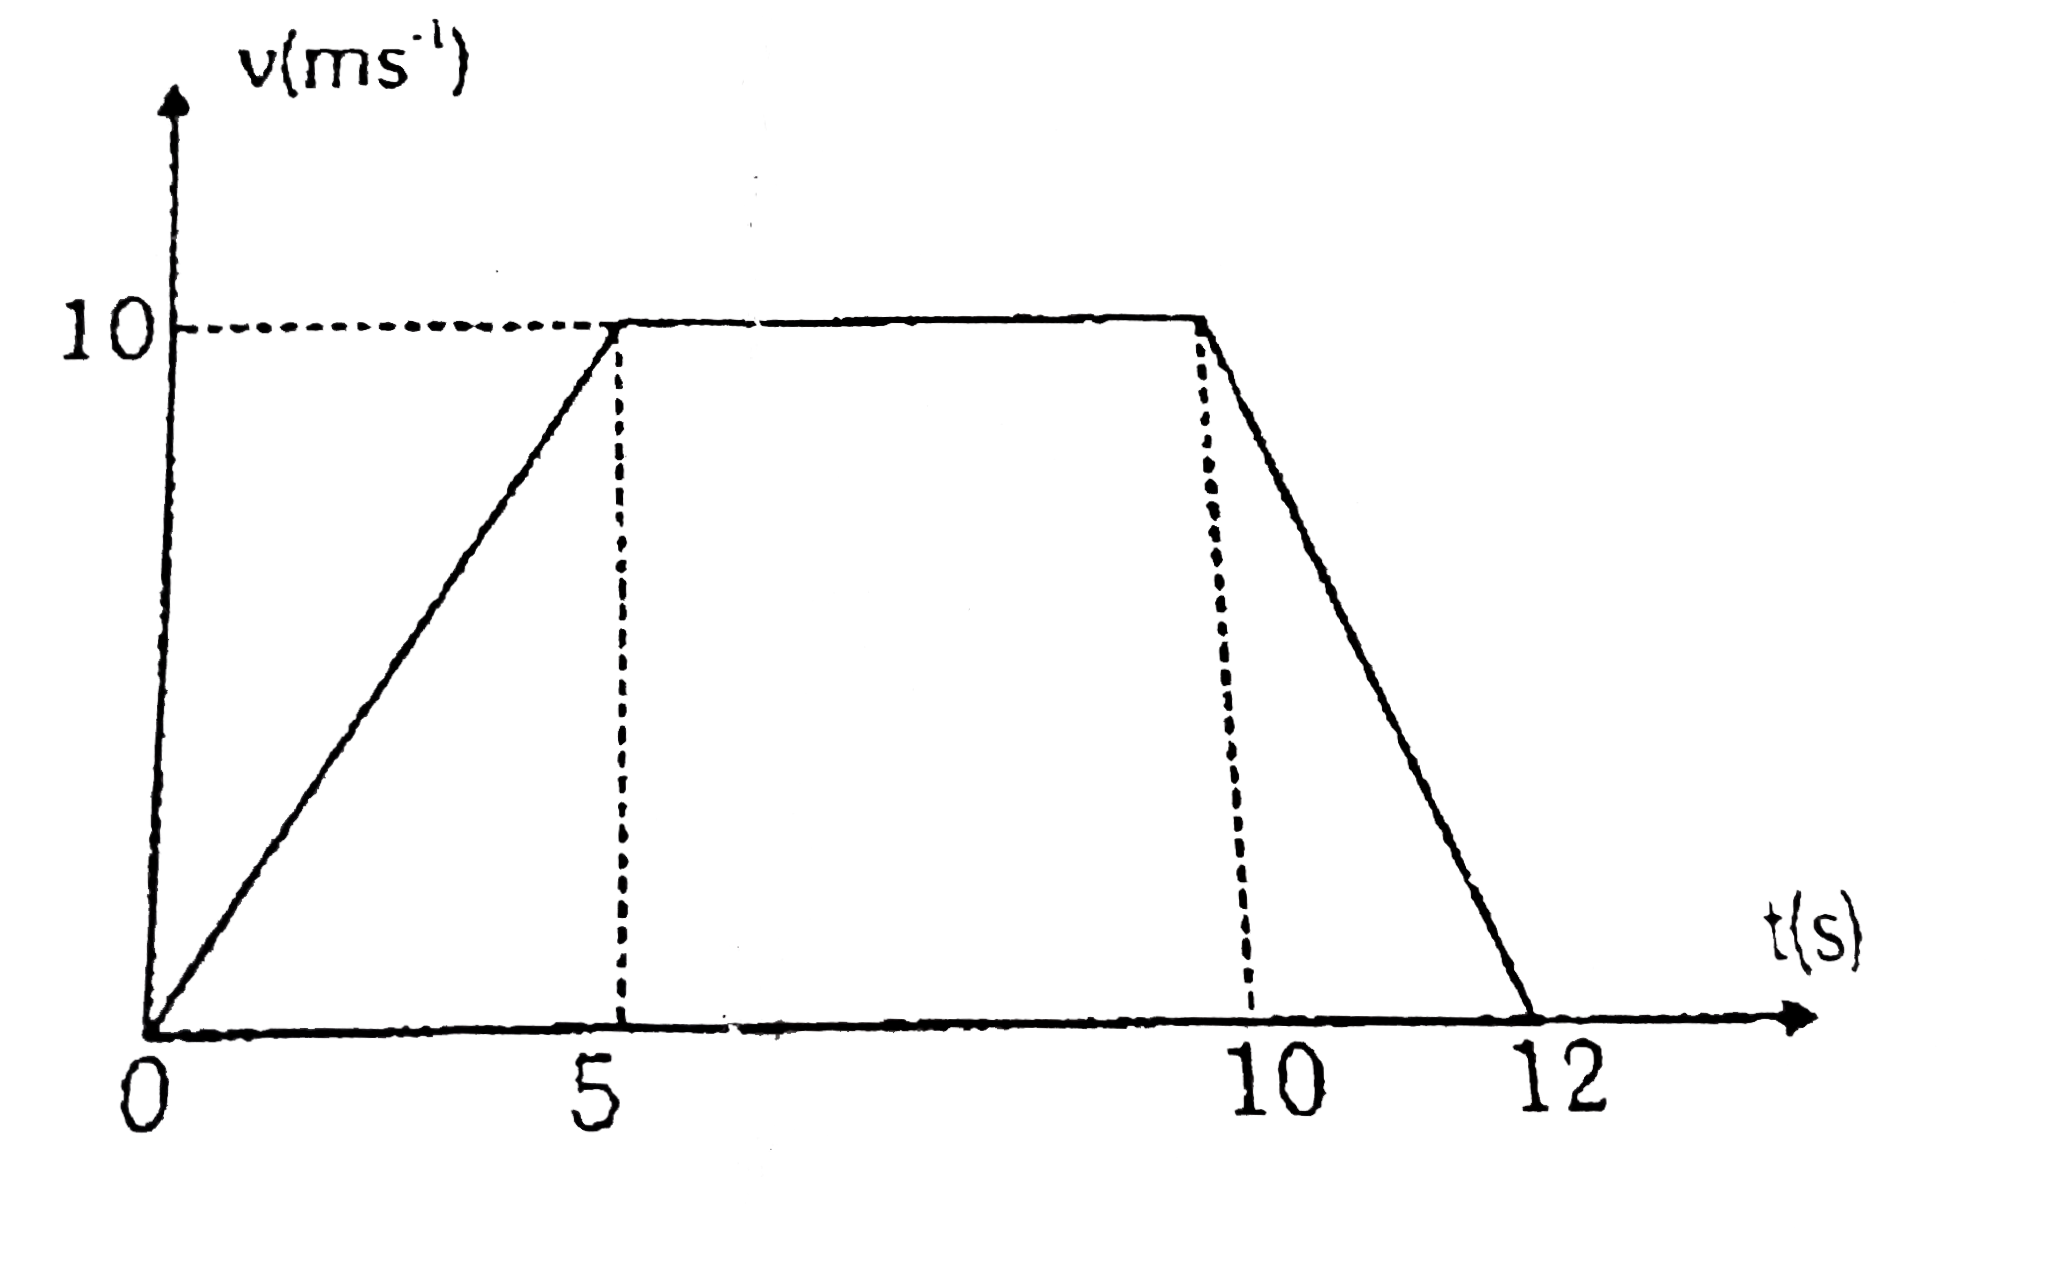
View SolutionDraw displacement time and acceleration -time graph for the given velocity-time graph
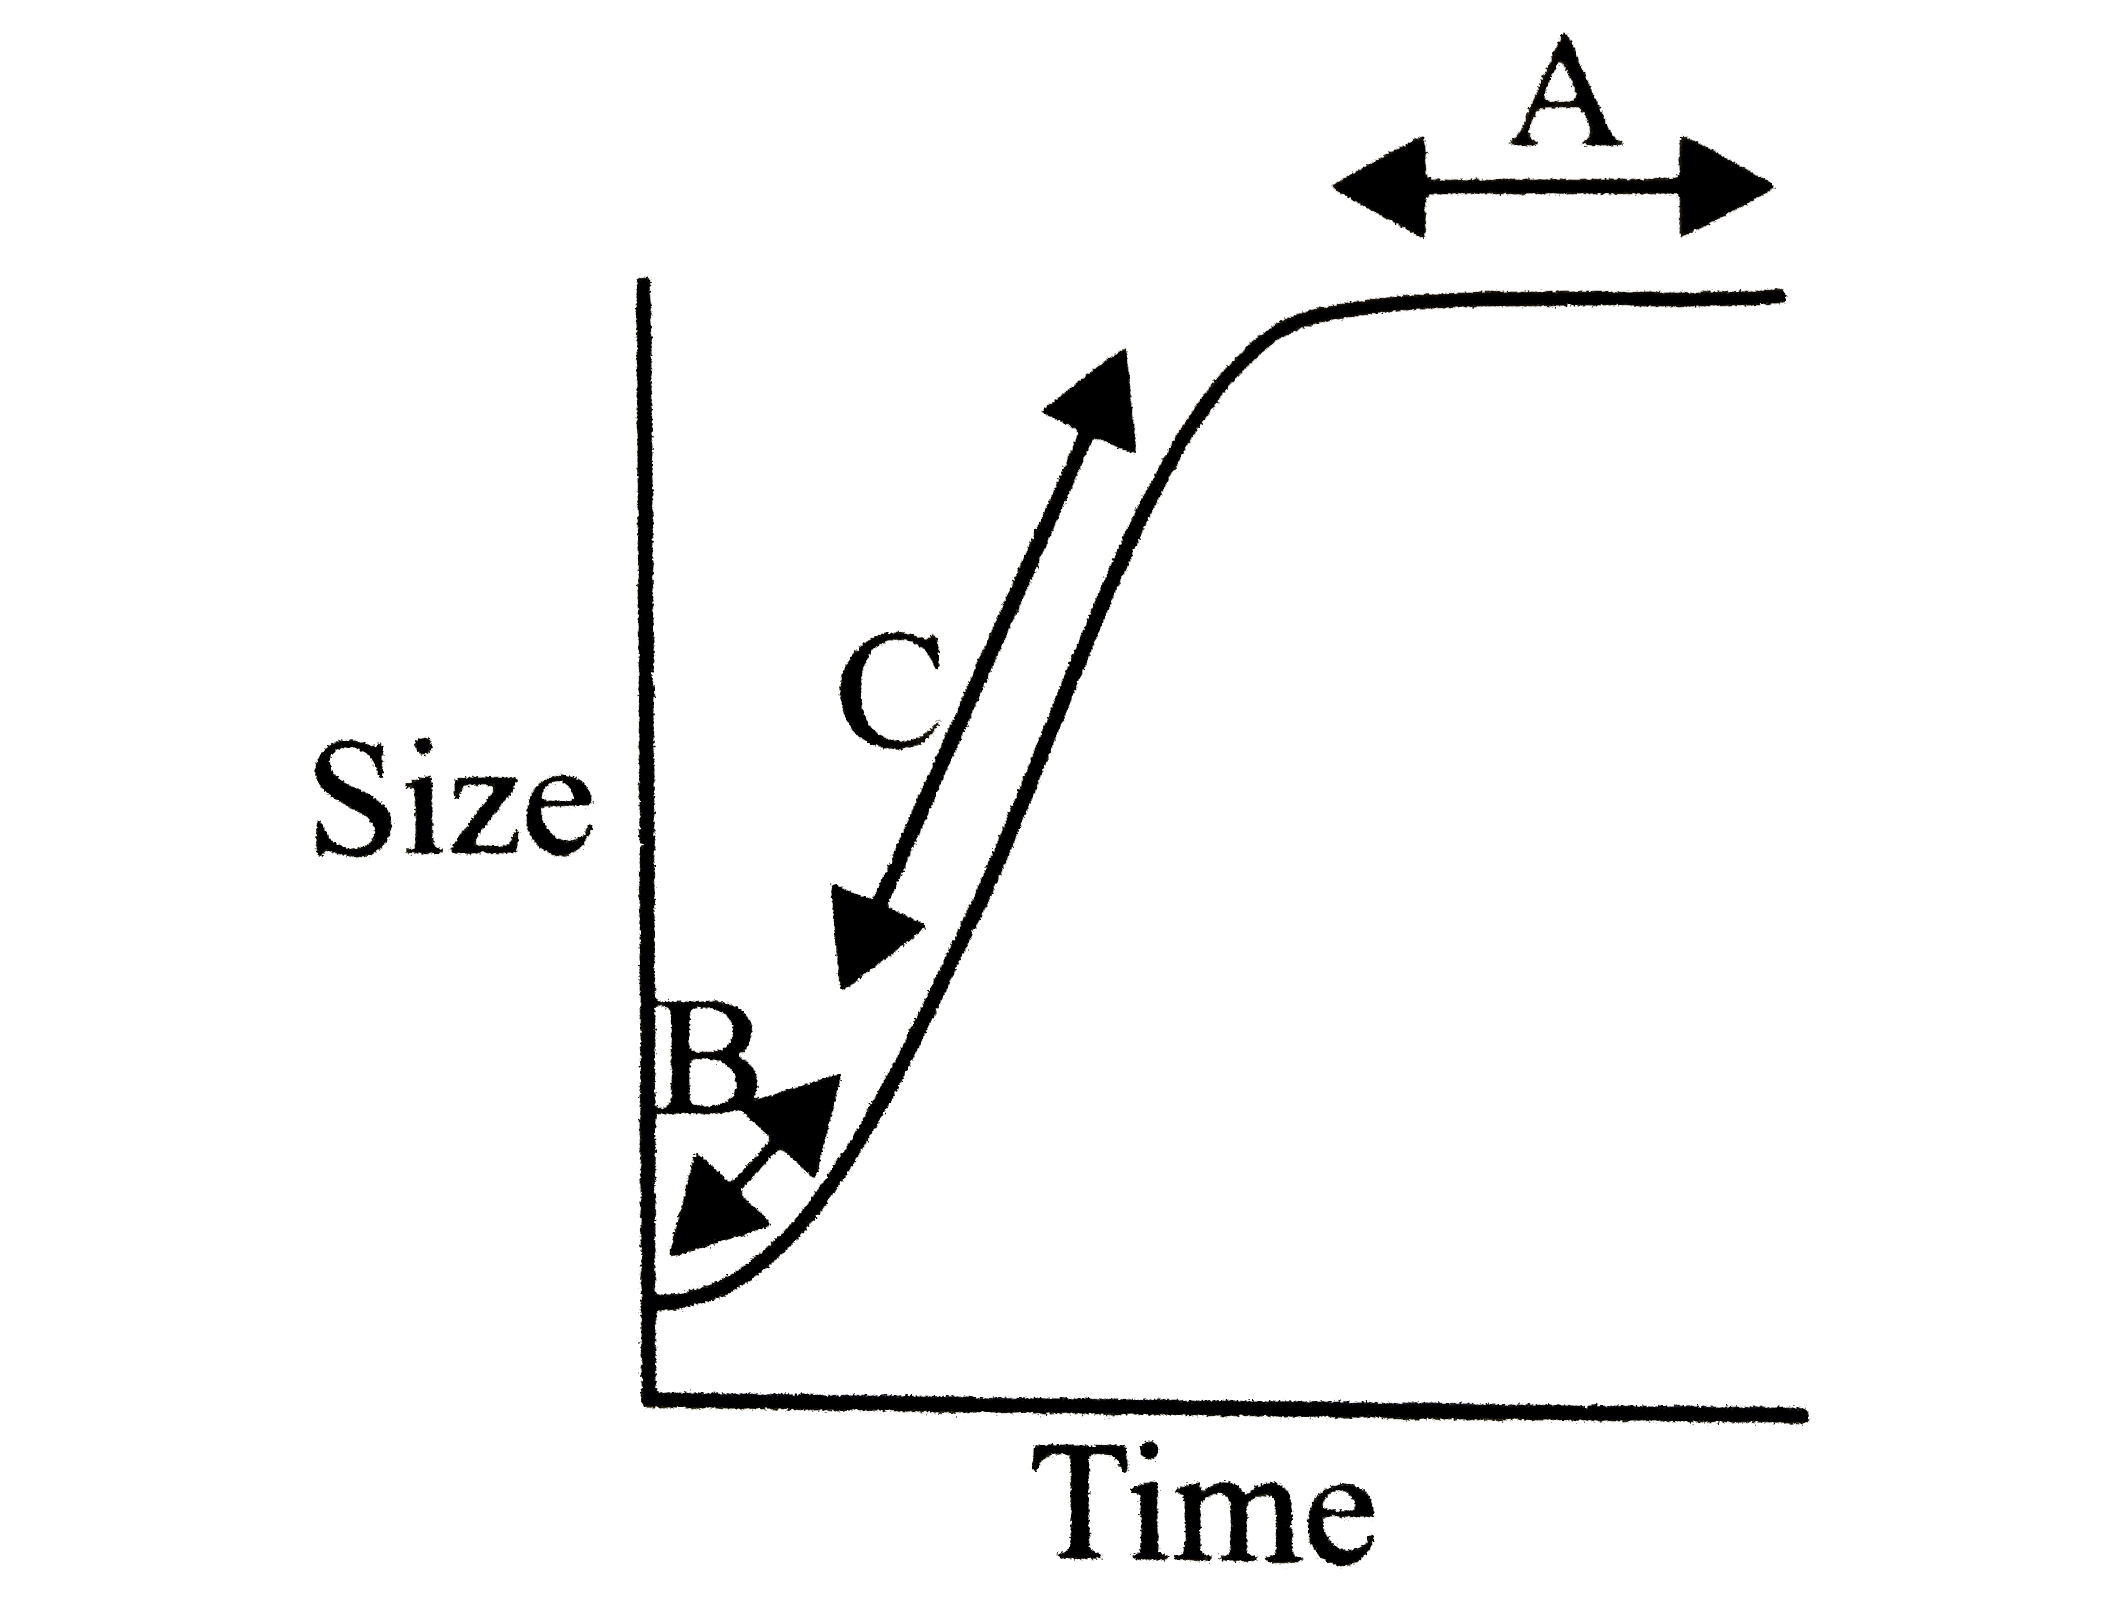
View SolutionGiven graph is drawn on the parameters of growth versus time. Here A,B and C respetively represent
View SolutionSome of the thermodynamic parameters are state variables while some are process variables. Some grouping of the parameters are given. Choose the correct one.
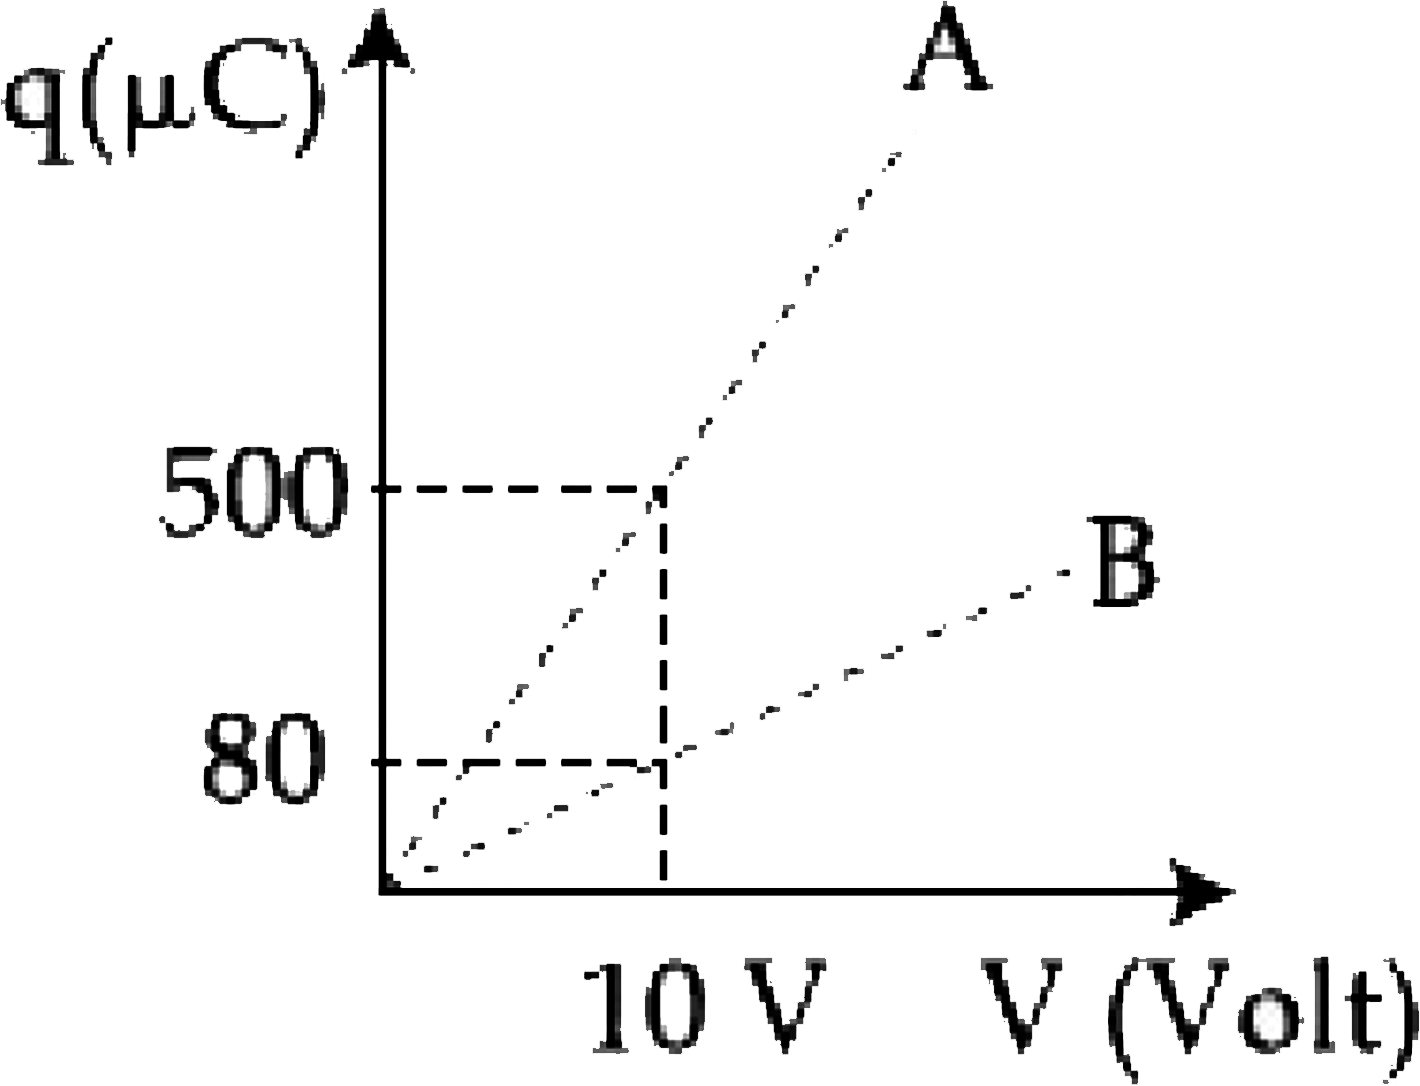
View SolutionFigure shows charge (q) versus voltage (V) graph for series and parallel combination of two given capacitors.The capacitances are :
View SolutionObserve the given graphs carefully.
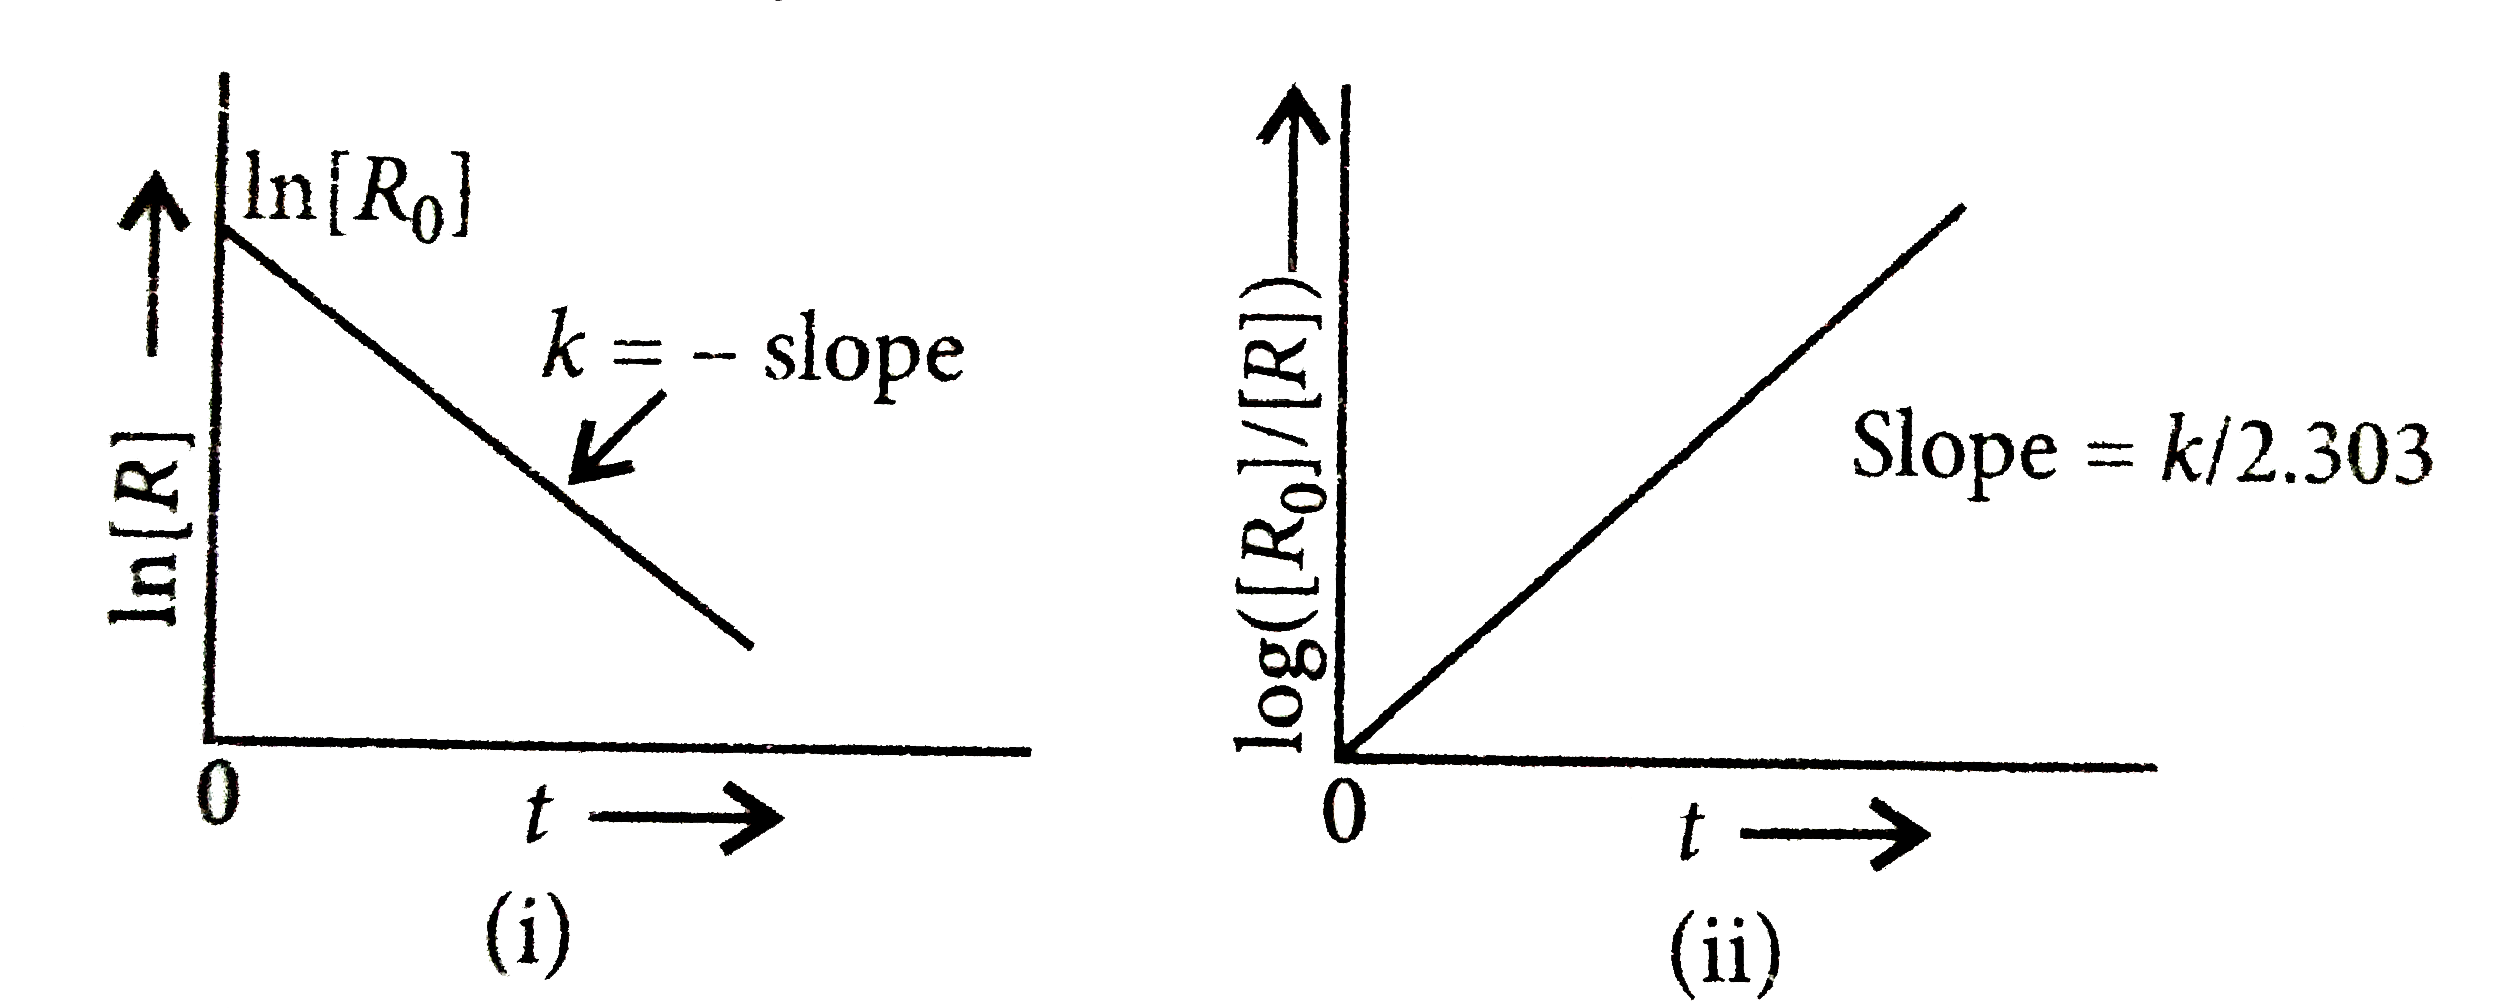
Which of the given orders are shown by the graphs respectively?
View Solution
