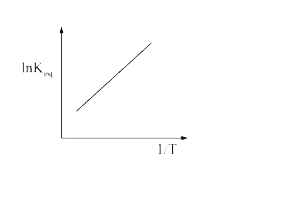
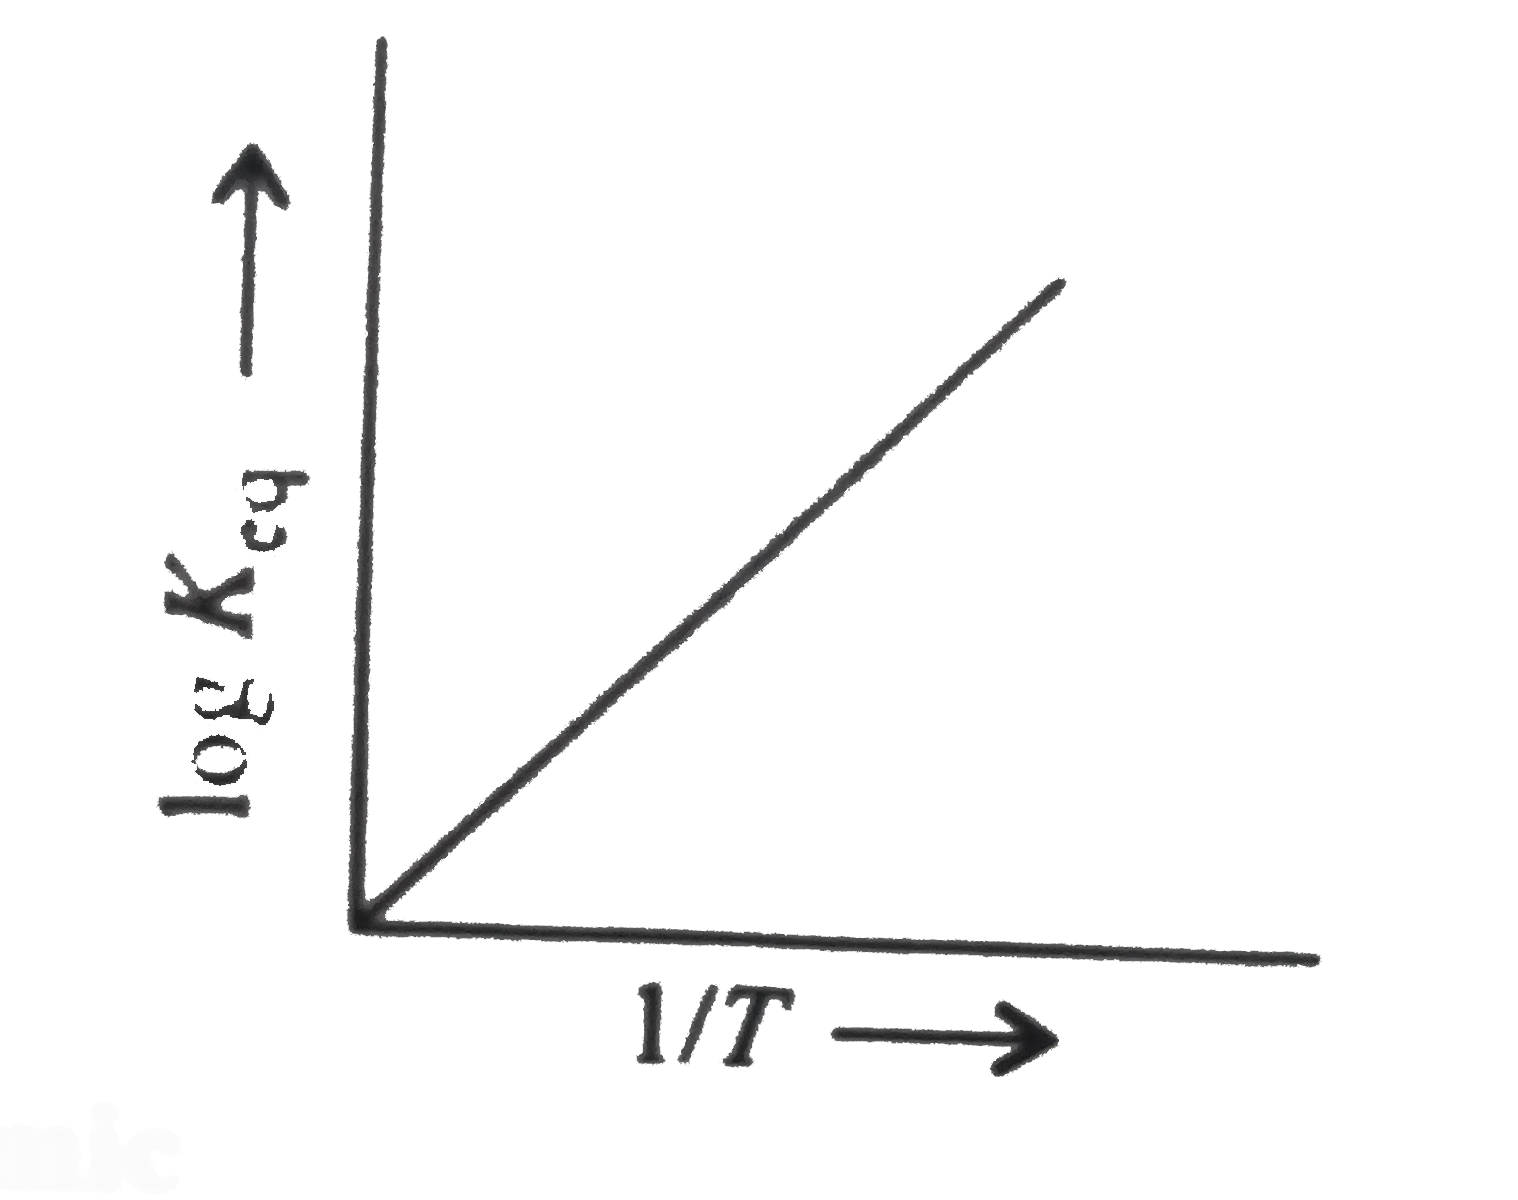
A schematic plot of log Keq vs inverse of temperature for a reaction is shown in the figure. The reaction must be:
A
Exothermic
B
Endothermic
C
One with negligible enthalpy change
D
Highly spontaneous at ordinary temperature
Video Solution
Text Solution
Kc=Ae−ΔHɵ/RT
log10Keq=log10A−ΔHɵ2.303RT
Y=C+MX
Slope of the line will be positive, when ΔHɵ=−ve, i.e. the reaction is xeothermic.
|
Topper's Solved these Questions
- CHEMICAL EQUILIBRIUMBOOK - CENGAGE CHEMISTRY ENGLISHCHAPTER - CHEMICAL EQUILIBRIUMEXERCISE - Concept Applicationexercise 7.1
53 Videos
- CHEMICAL EQUILIBRIUMBOOK - CENGAGE CHEMISTRY ENGLISHCHAPTER - CHEMICAL EQUILIBRIUMEXERCISE - Ex 7.2
40 Videos
- CHEMICAL BONDING AND MOLECULAR STRUCTUREBOOK - CENGAGE CHEMISTRY ENGLISHCHAPTER - CHEMICAL BONDING AND MOLECULAR STRUCTUREEXERCISE - Archives Subjective
15 Videos
- CLASSIFICATION AND NOMENCLATURE OF ORGANIC COMPOUNDSBOOK - CENGAGE CHEMISTRY ENGLISHCHAPTER - CLASSIFICATION AND NOMENCLATURE OF ORGANIC COMPOUNDSEXERCISE - Analytical and Descriptive Type
3 Videos
Similar Questions
Knowledge Check
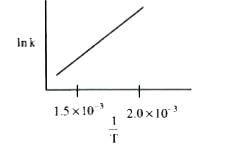
In a plot of log k vs 1/T, the slope is
A−Ea/2.303BEa/2.303RCEa/2.303D−Ea/2.303RIn a plot of log k vs 1/T, the slope is
A−Ea/2.303BEa/2.303RCEa/2.303D−Ea/2.303RIn a plot of log k vs 1/T, the slope is
A−Ea/2.303BEa/2.303RCEa/2.303D−Ea/2.303R
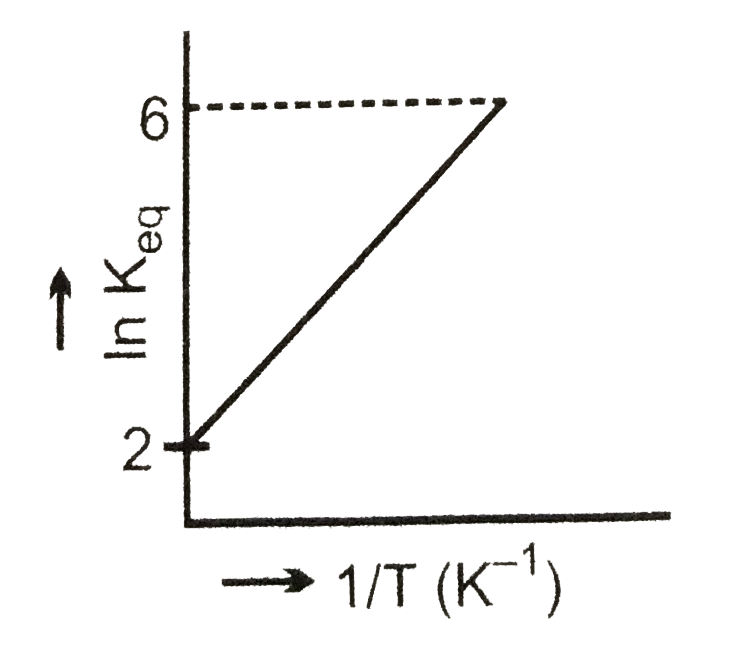
The graph relates in Keq.VslT for a reaction. The reaction must be :
View SolutionIn an experiment, the resistance of a material is plotted as a function of temperature (in some range).As shown in the figure, it is a straight line.
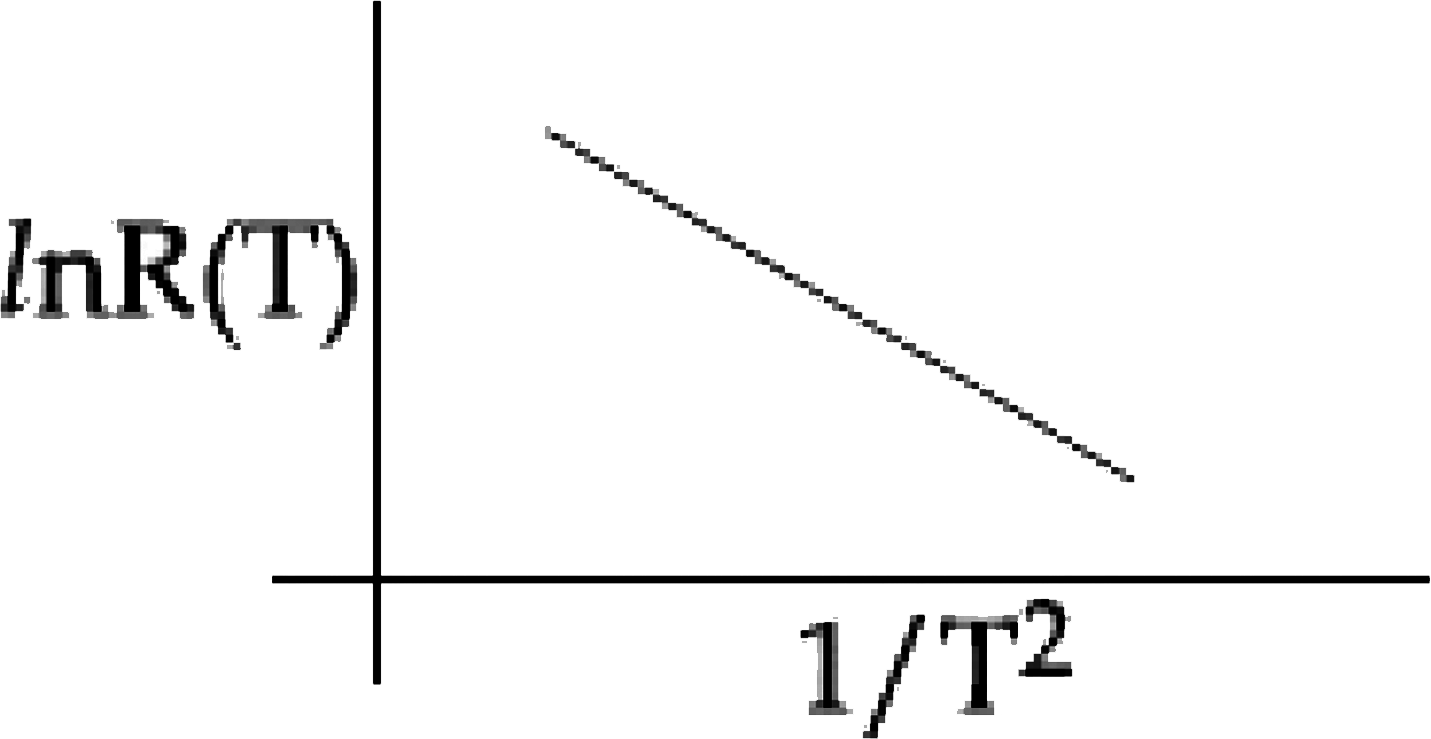
One may conclude that :
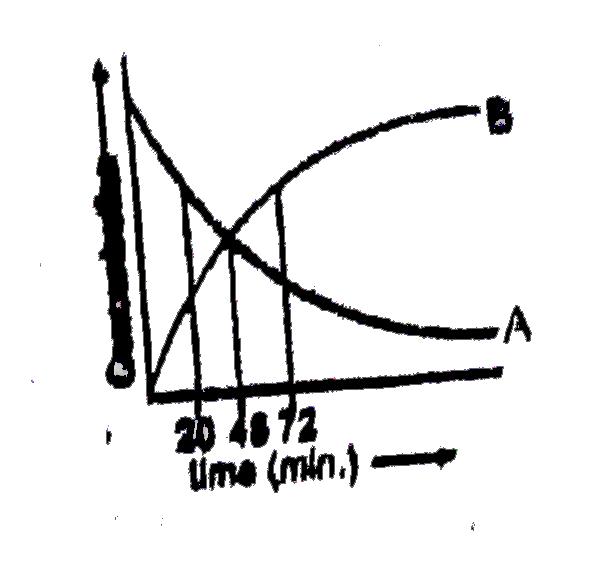
View SolutionFor a first order reaction , nA→B whose concentration vs time curve is as shown in the figure. If half -life for this reaction is 24 minutes. Find out the value of n .
View Solutionlog KpKc+log RT=0 is a relationship for the reaction :
View SolutionA plot of log (a-x) against time 't' is a straight line. This indicates that the reaction is of :
View Solution

