The following graph represents the titration of pH vs volume
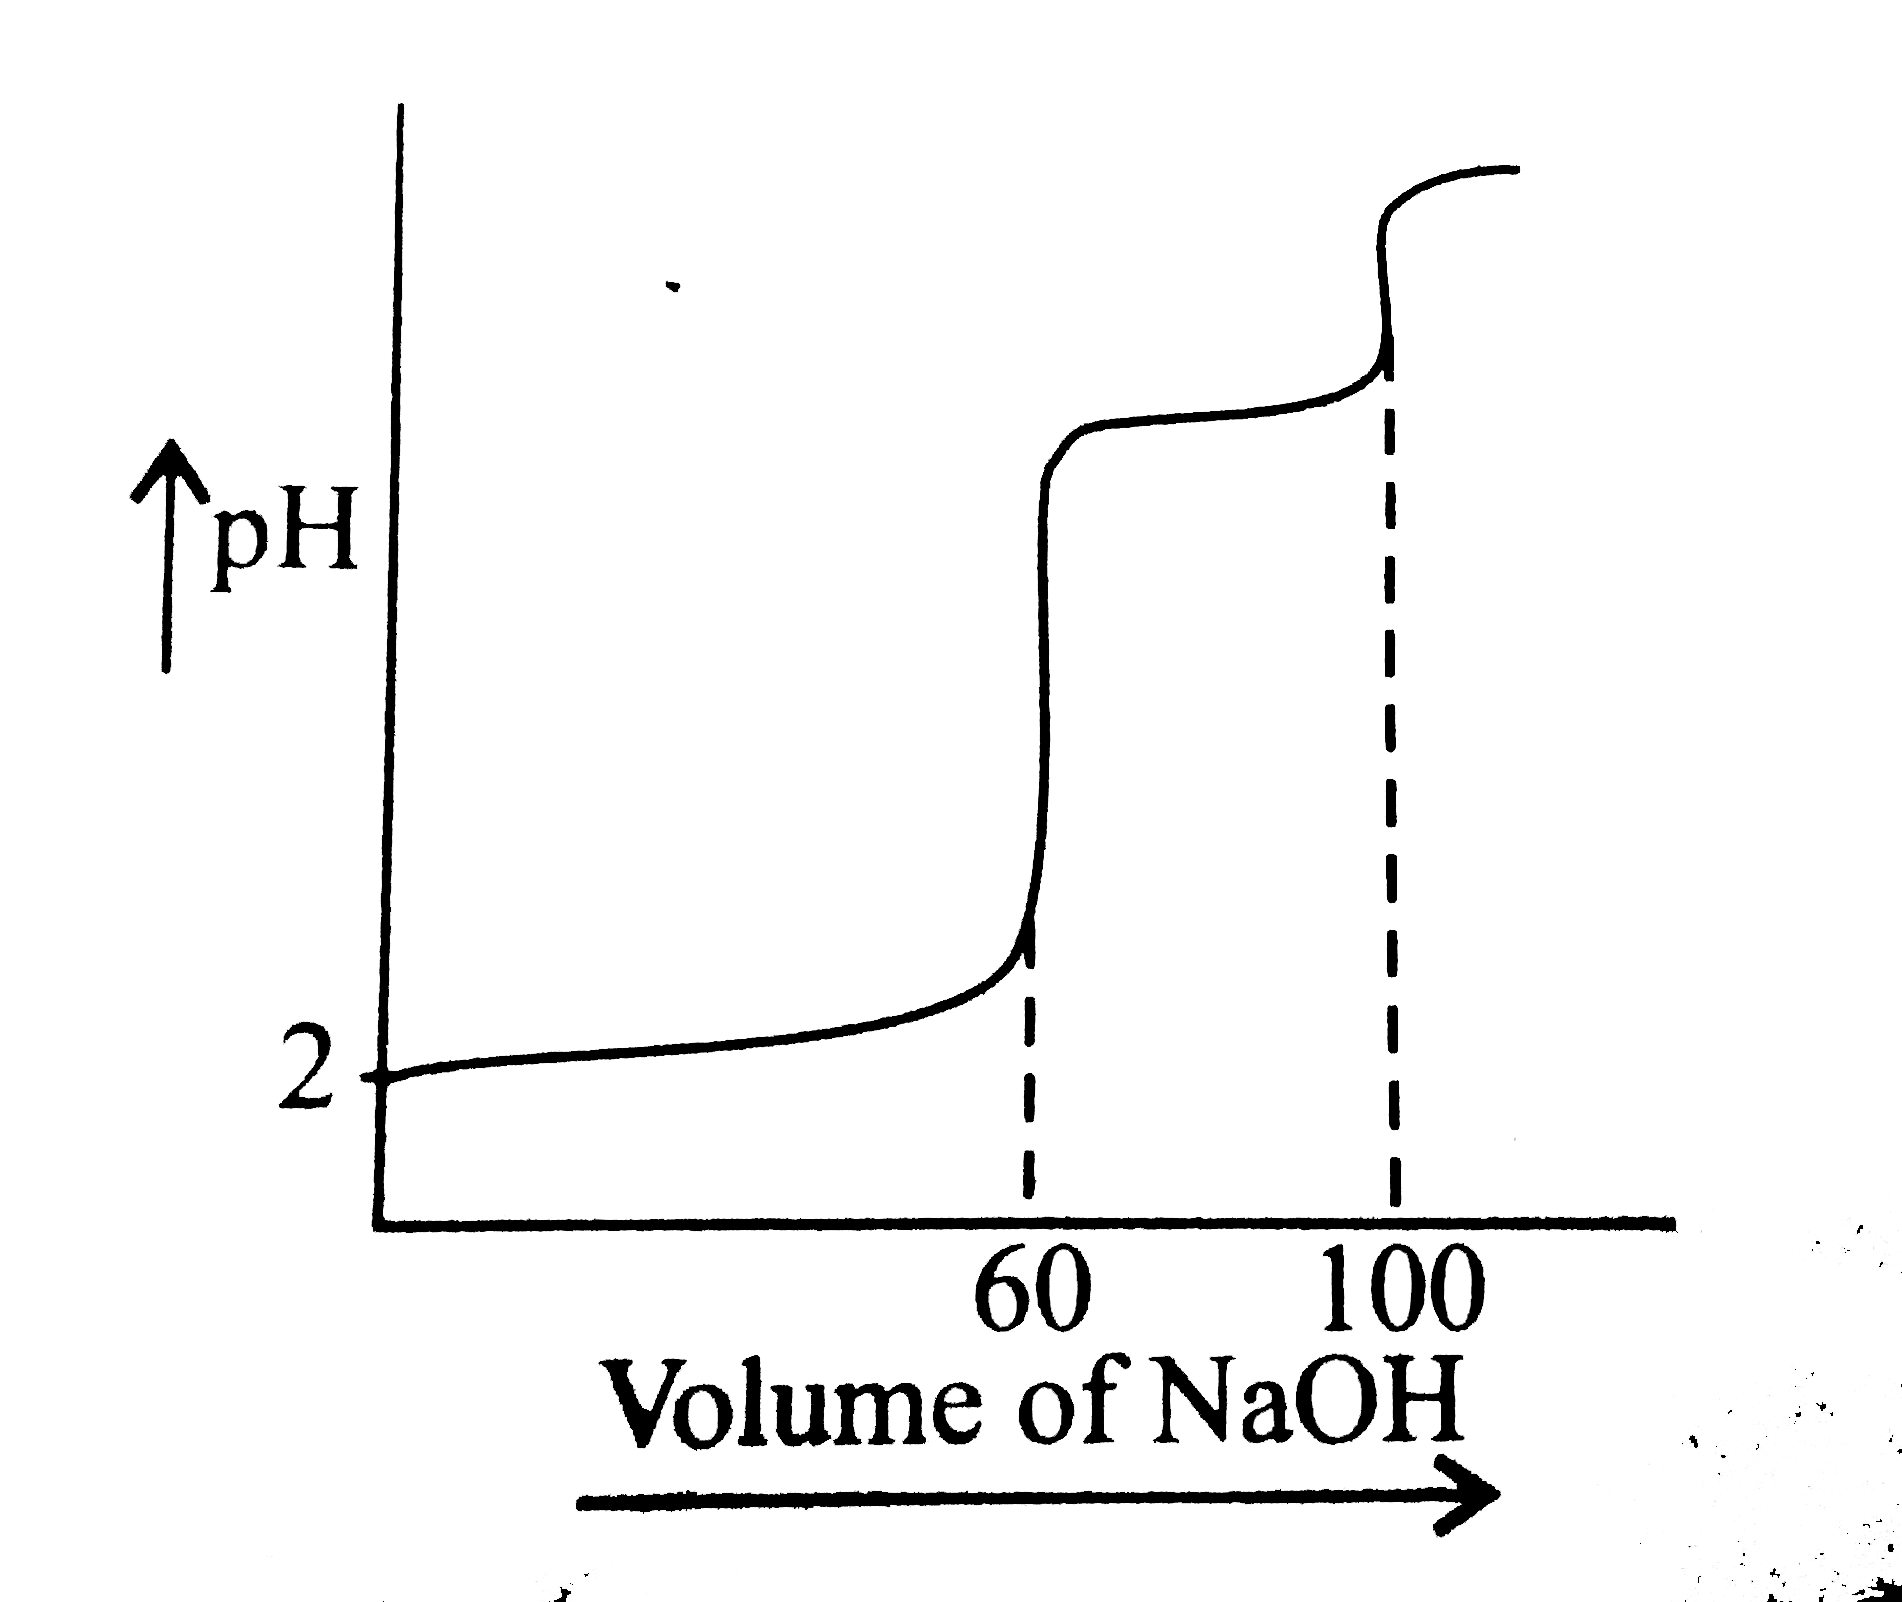
A diprotic acid.
Two monoprotic acids with the same Ka but different concentrations.
Two monoprotic acids with different Ka but the same concentration.
Two monoprotic acids with differnet Ka and different concentartions.
The correct Answer is:D
Step by step video & image solution for The following graph represents the titration of pH vs volume by Chemistry experts to help you in doubts & scoring excellent marks in Class 11 exams.
Updated on:21/07/2023Topper's Solved these Questions
- IONIC EQUILIBRIUMBOOK - CENGAGE CHEMISTRY ENGLISHCHAPTER - IONIC EQUILIBRIUMEXERCISE - Exercises Assertion-Reasoning
36 Videos
- IONIC EQUILIBRIUMBOOK - CENGAGE CHEMISTRY ENGLISHCHAPTER - IONIC EQUILIBRIUMEXERCISE - Exercises Integer
10 Videos
- IONIC EQUILIBRIUMBOOK - CENGAGE CHEMISTRY ENGLISHCHAPTER - IONIC EQUILIBRIUMEXERCISE - Exercises Multiple Correct
33 Videos
- HYDROGEN, WATER AND HYDROGEN PEROXIDEBOOK - CENGAGE CHEMISTRY ENGLISHCHAPTER - HYDROGEN, WATER AND HYDROGEN PEROXIDEEXERCISE - Subjective Archive (Subjective)
3 Videos
- ISOMERISMBOOK - CENGAGE CHEMISTRY ENGLISHCHAPTER - ISOMERISMEXERCISE - Assertion-Reasoning Type
1 Videos
Similar Questions
Ten moles of an ideal gas are filled in a closed vessel. The vessel has cylinder and piston type arrangement and pressure of the gas remains constant at 0.821 atm. Which of the following graph represents correct variation of log V vs log T?
(V = Volume in litre and T = temperature in Kelvin)
View SolutionWhich of the following pH curve represent the titration of weak acid and strong base (dotted line show equivalence point)?
View Solution
Knowledge Check
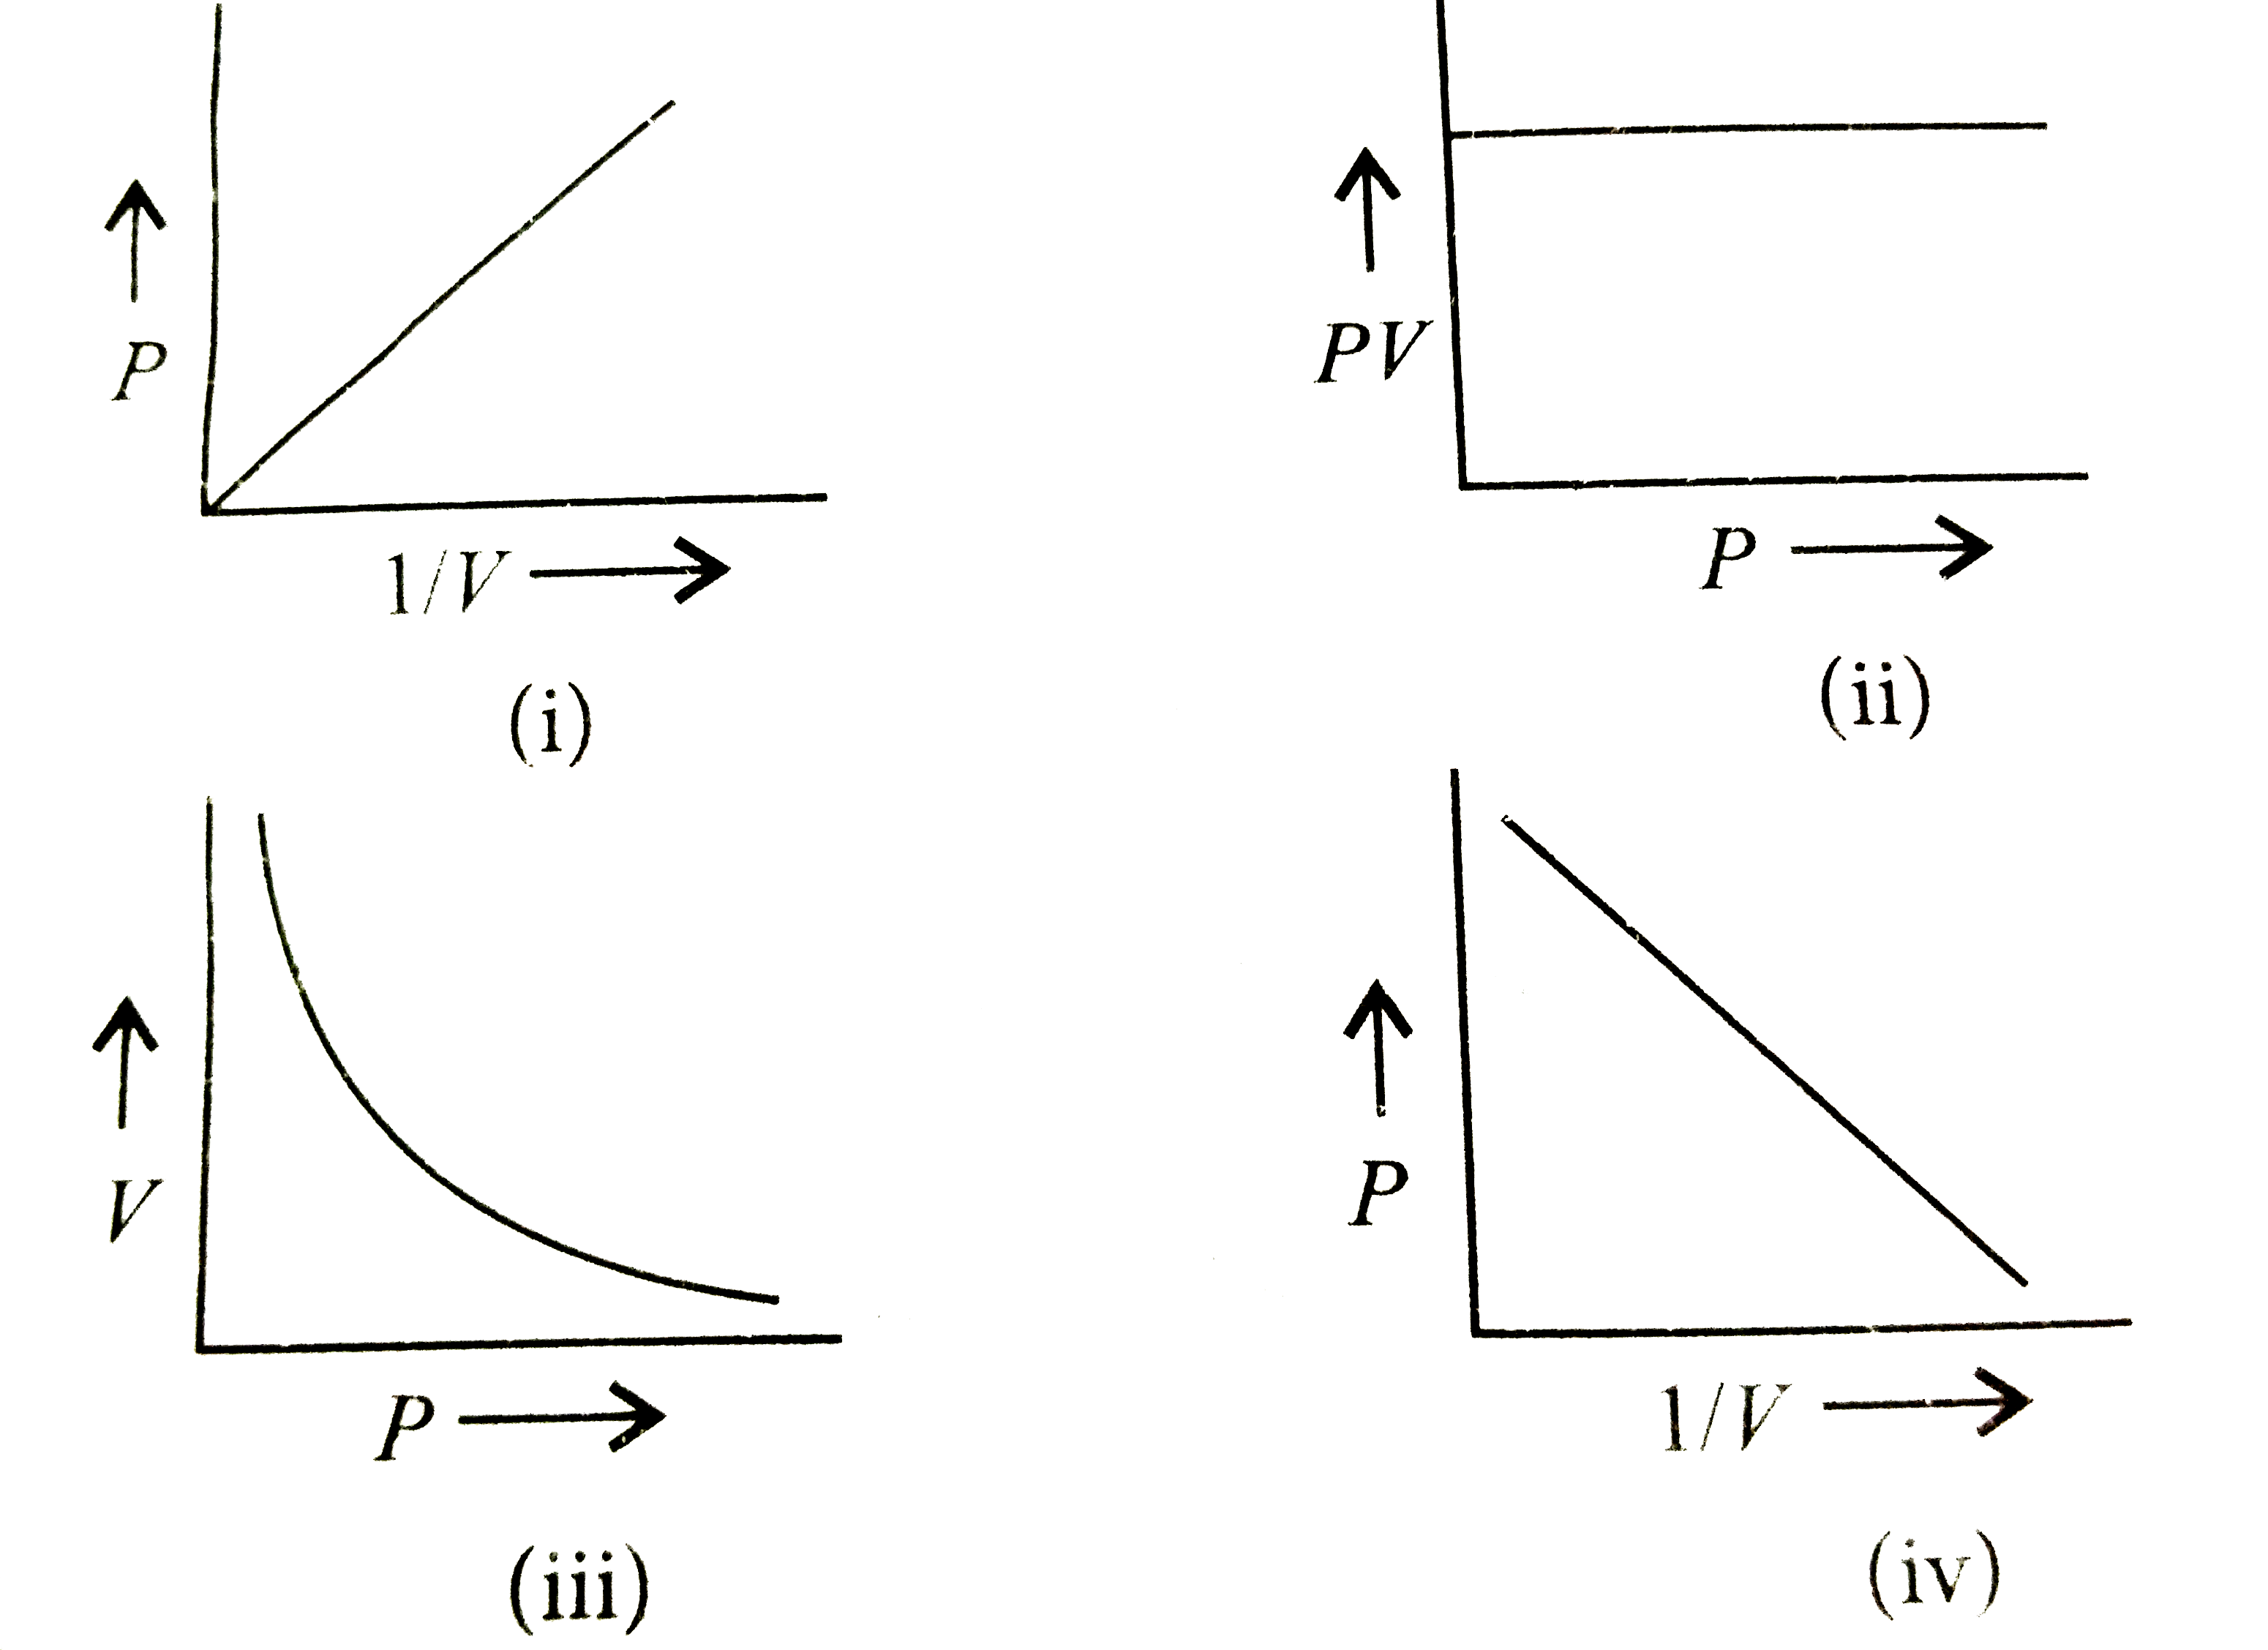
Which of the following graphs represent the behaviour of an ideal gas ?
A1.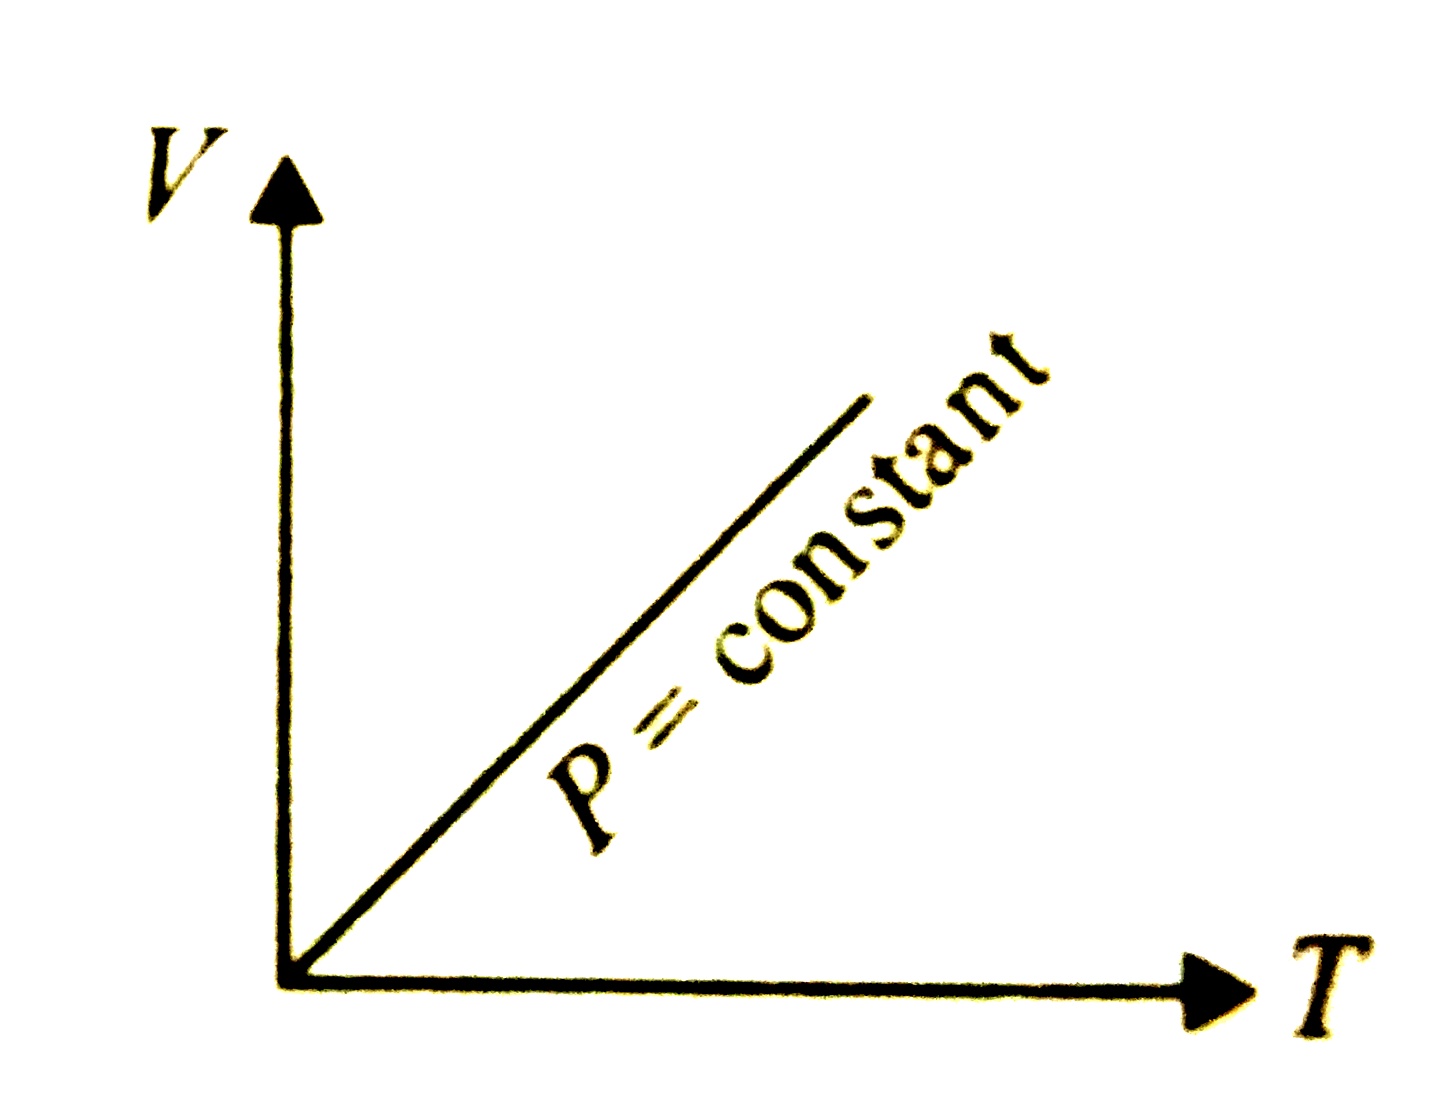 B2.
B2.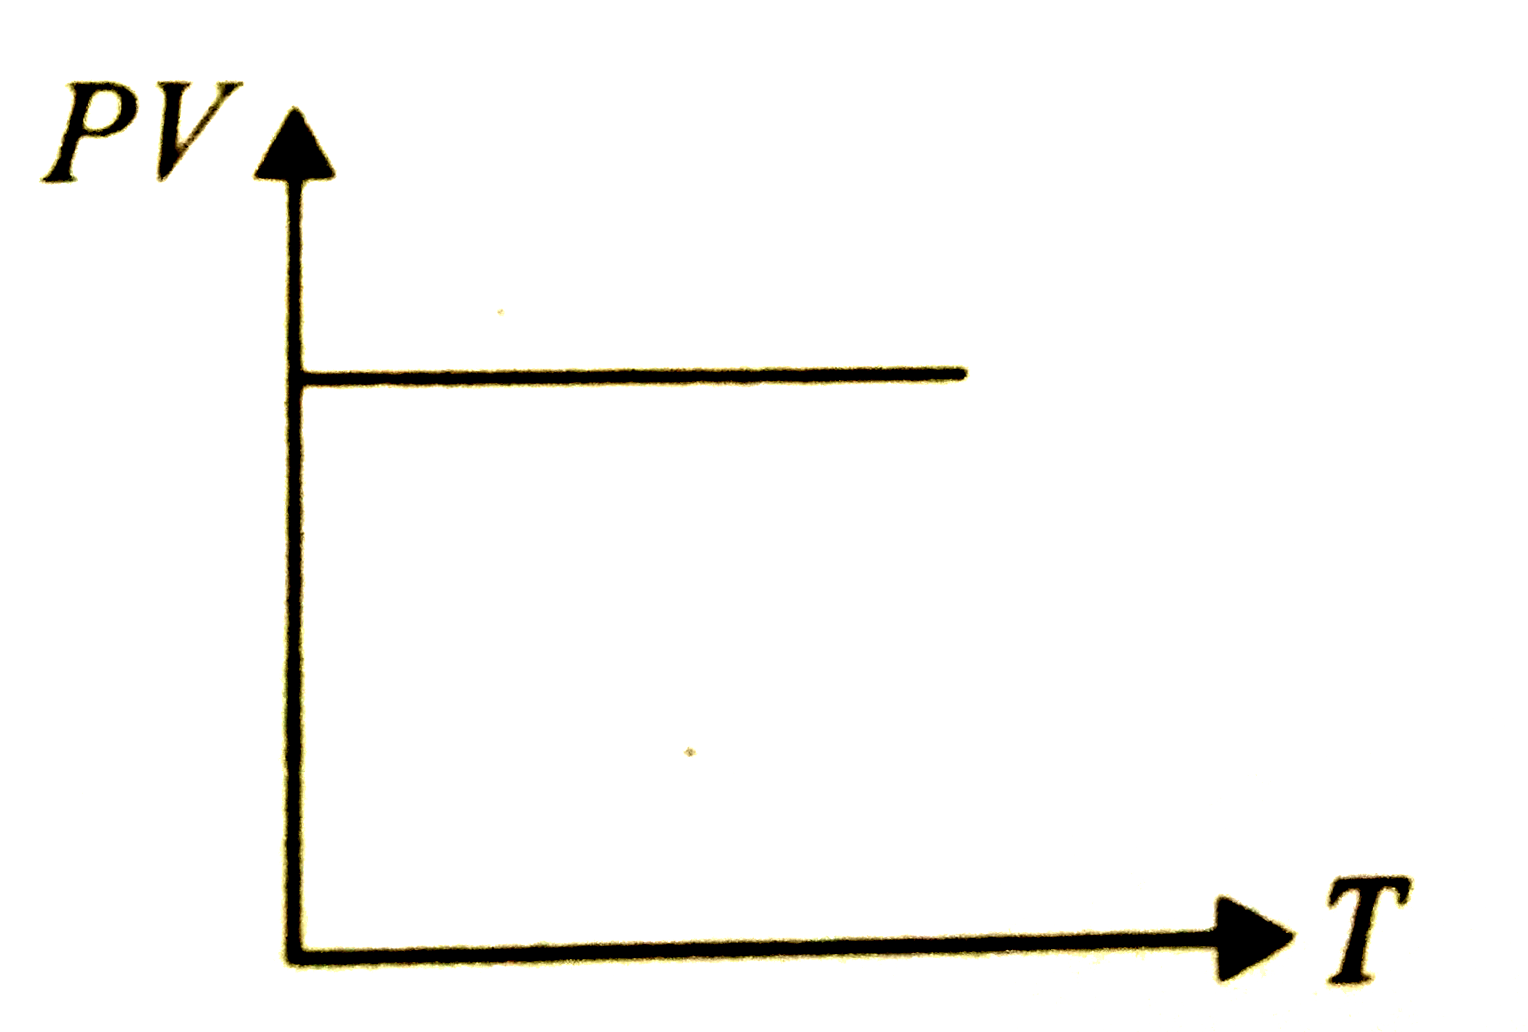 C3.
C3.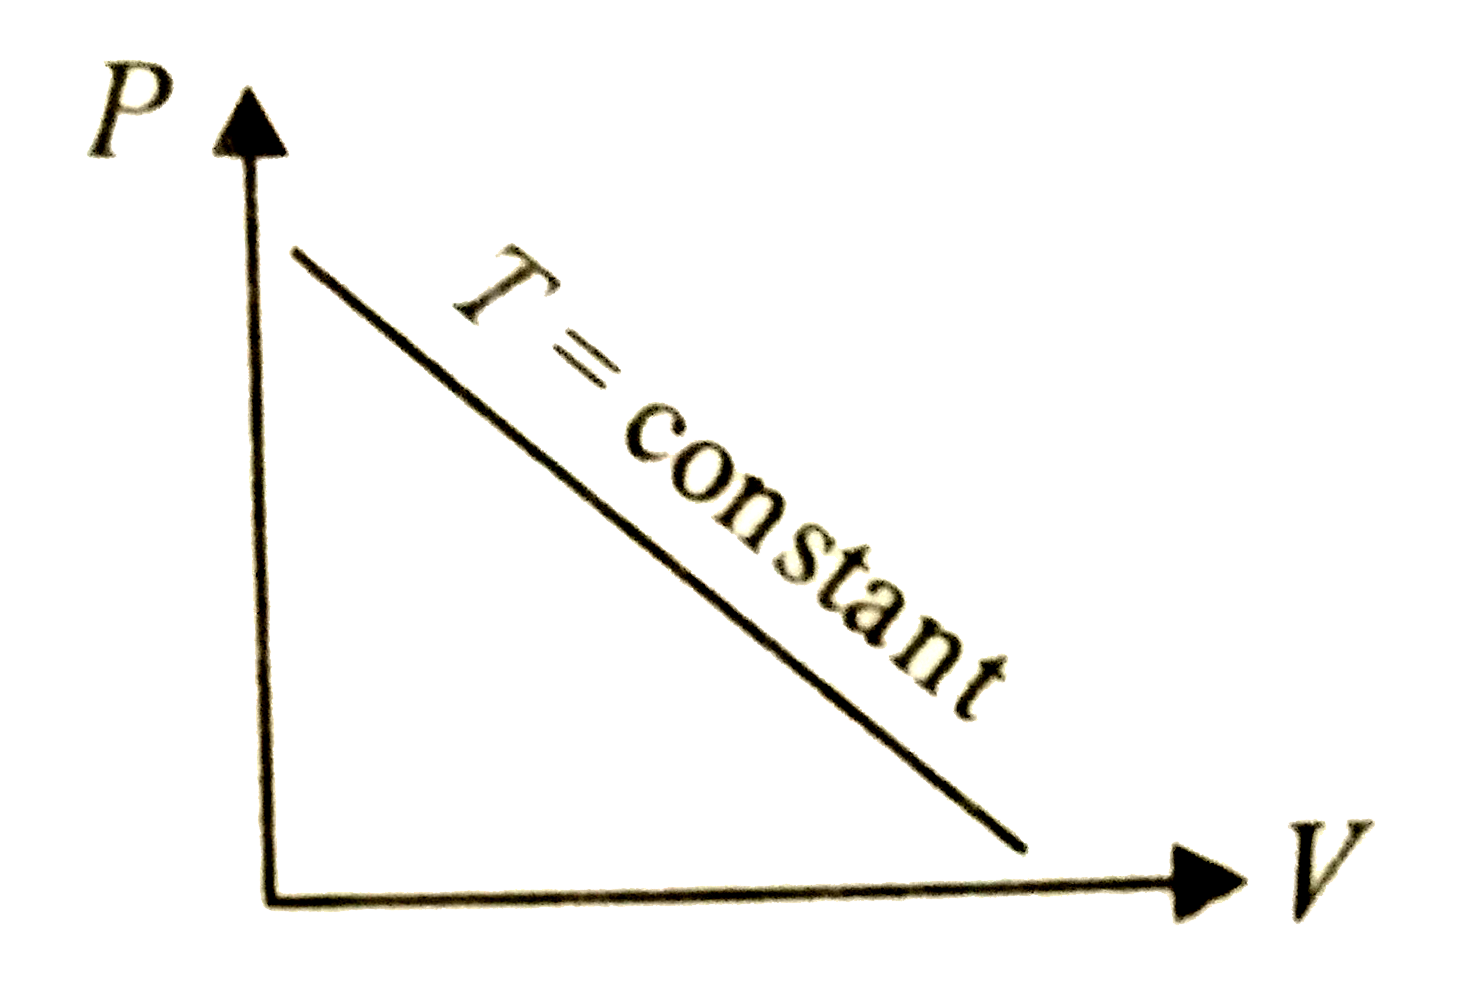 D4.
D4.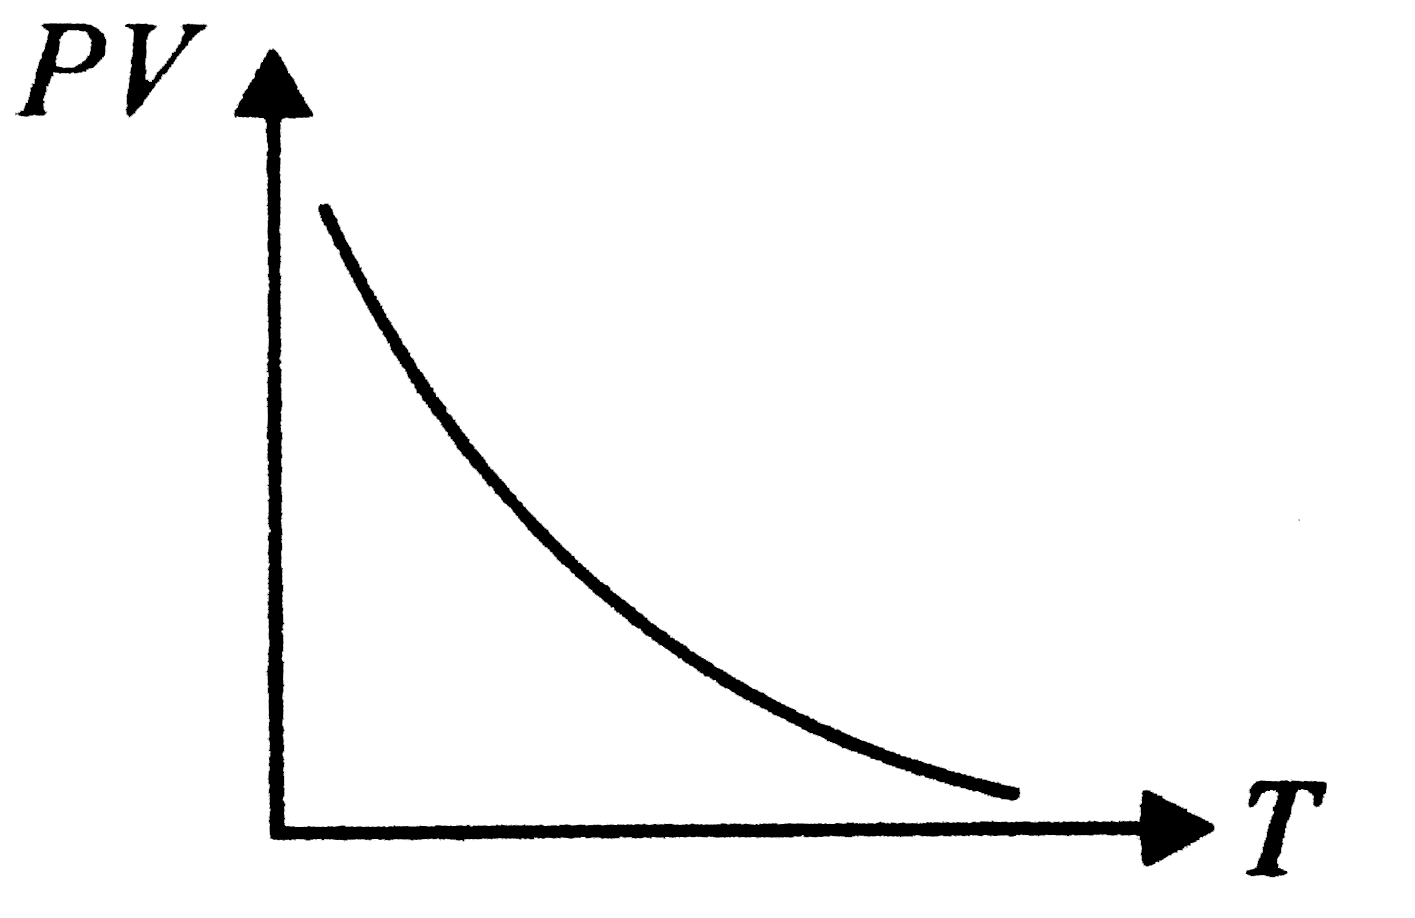
According to Arrhenius equation, rate constant k is equal to Ae−Ea/RT Which of the following options represents the graph of In k vs1T ?
A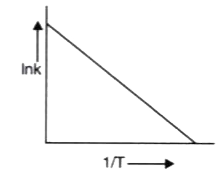 B
B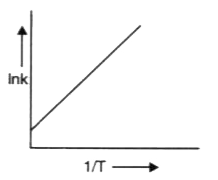 C
C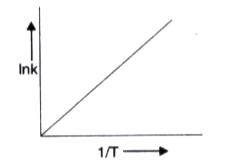 D
D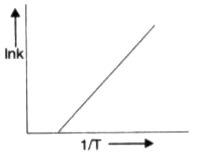
According to Arrhenius equation, rate constant k is equal to Ae−Ea/RT Which of the following options represents the graph of In k vs1T ?
A B
B C
C D
D
The following acid base titration graphs are given:
(I)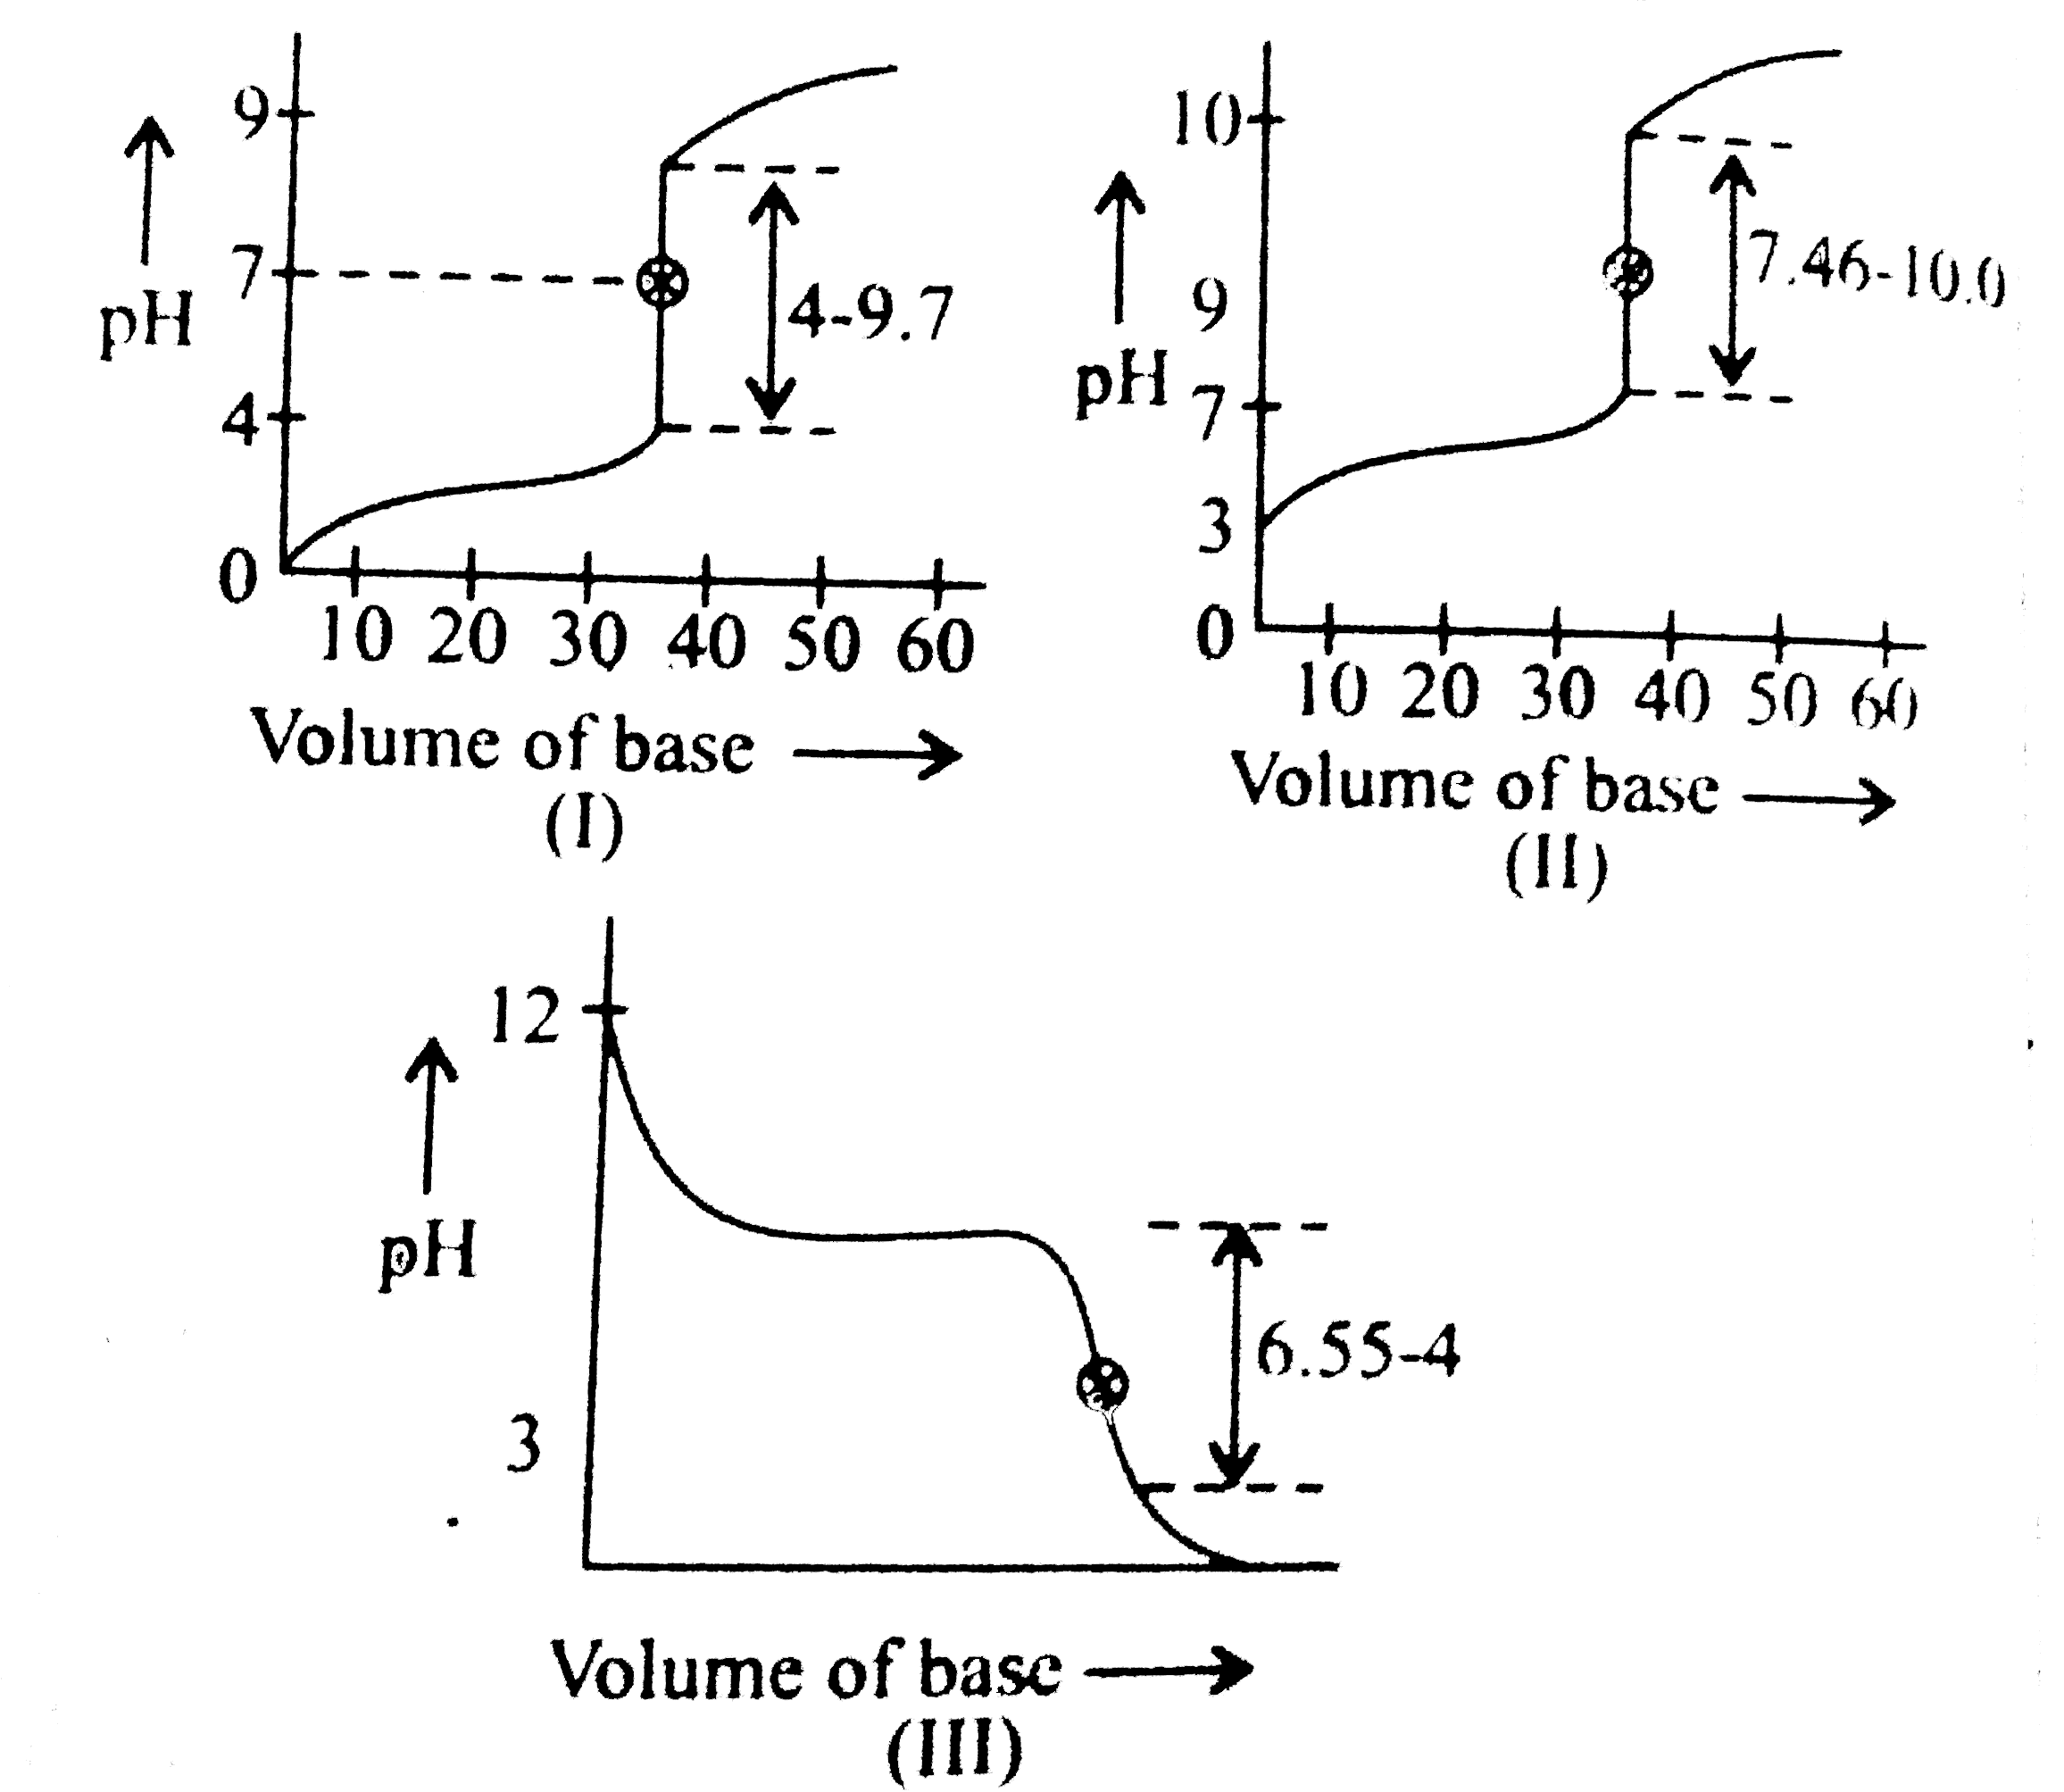
Which of the following graph represents titration of
i. NH4OH/HCl(WB/SA)
ii. HNO3/KOH(SA/SB)
iii. C6H5COOH/KOH(WA/SB)
View SolutionWhich of the following graphs represents the correct Boyle's law ?
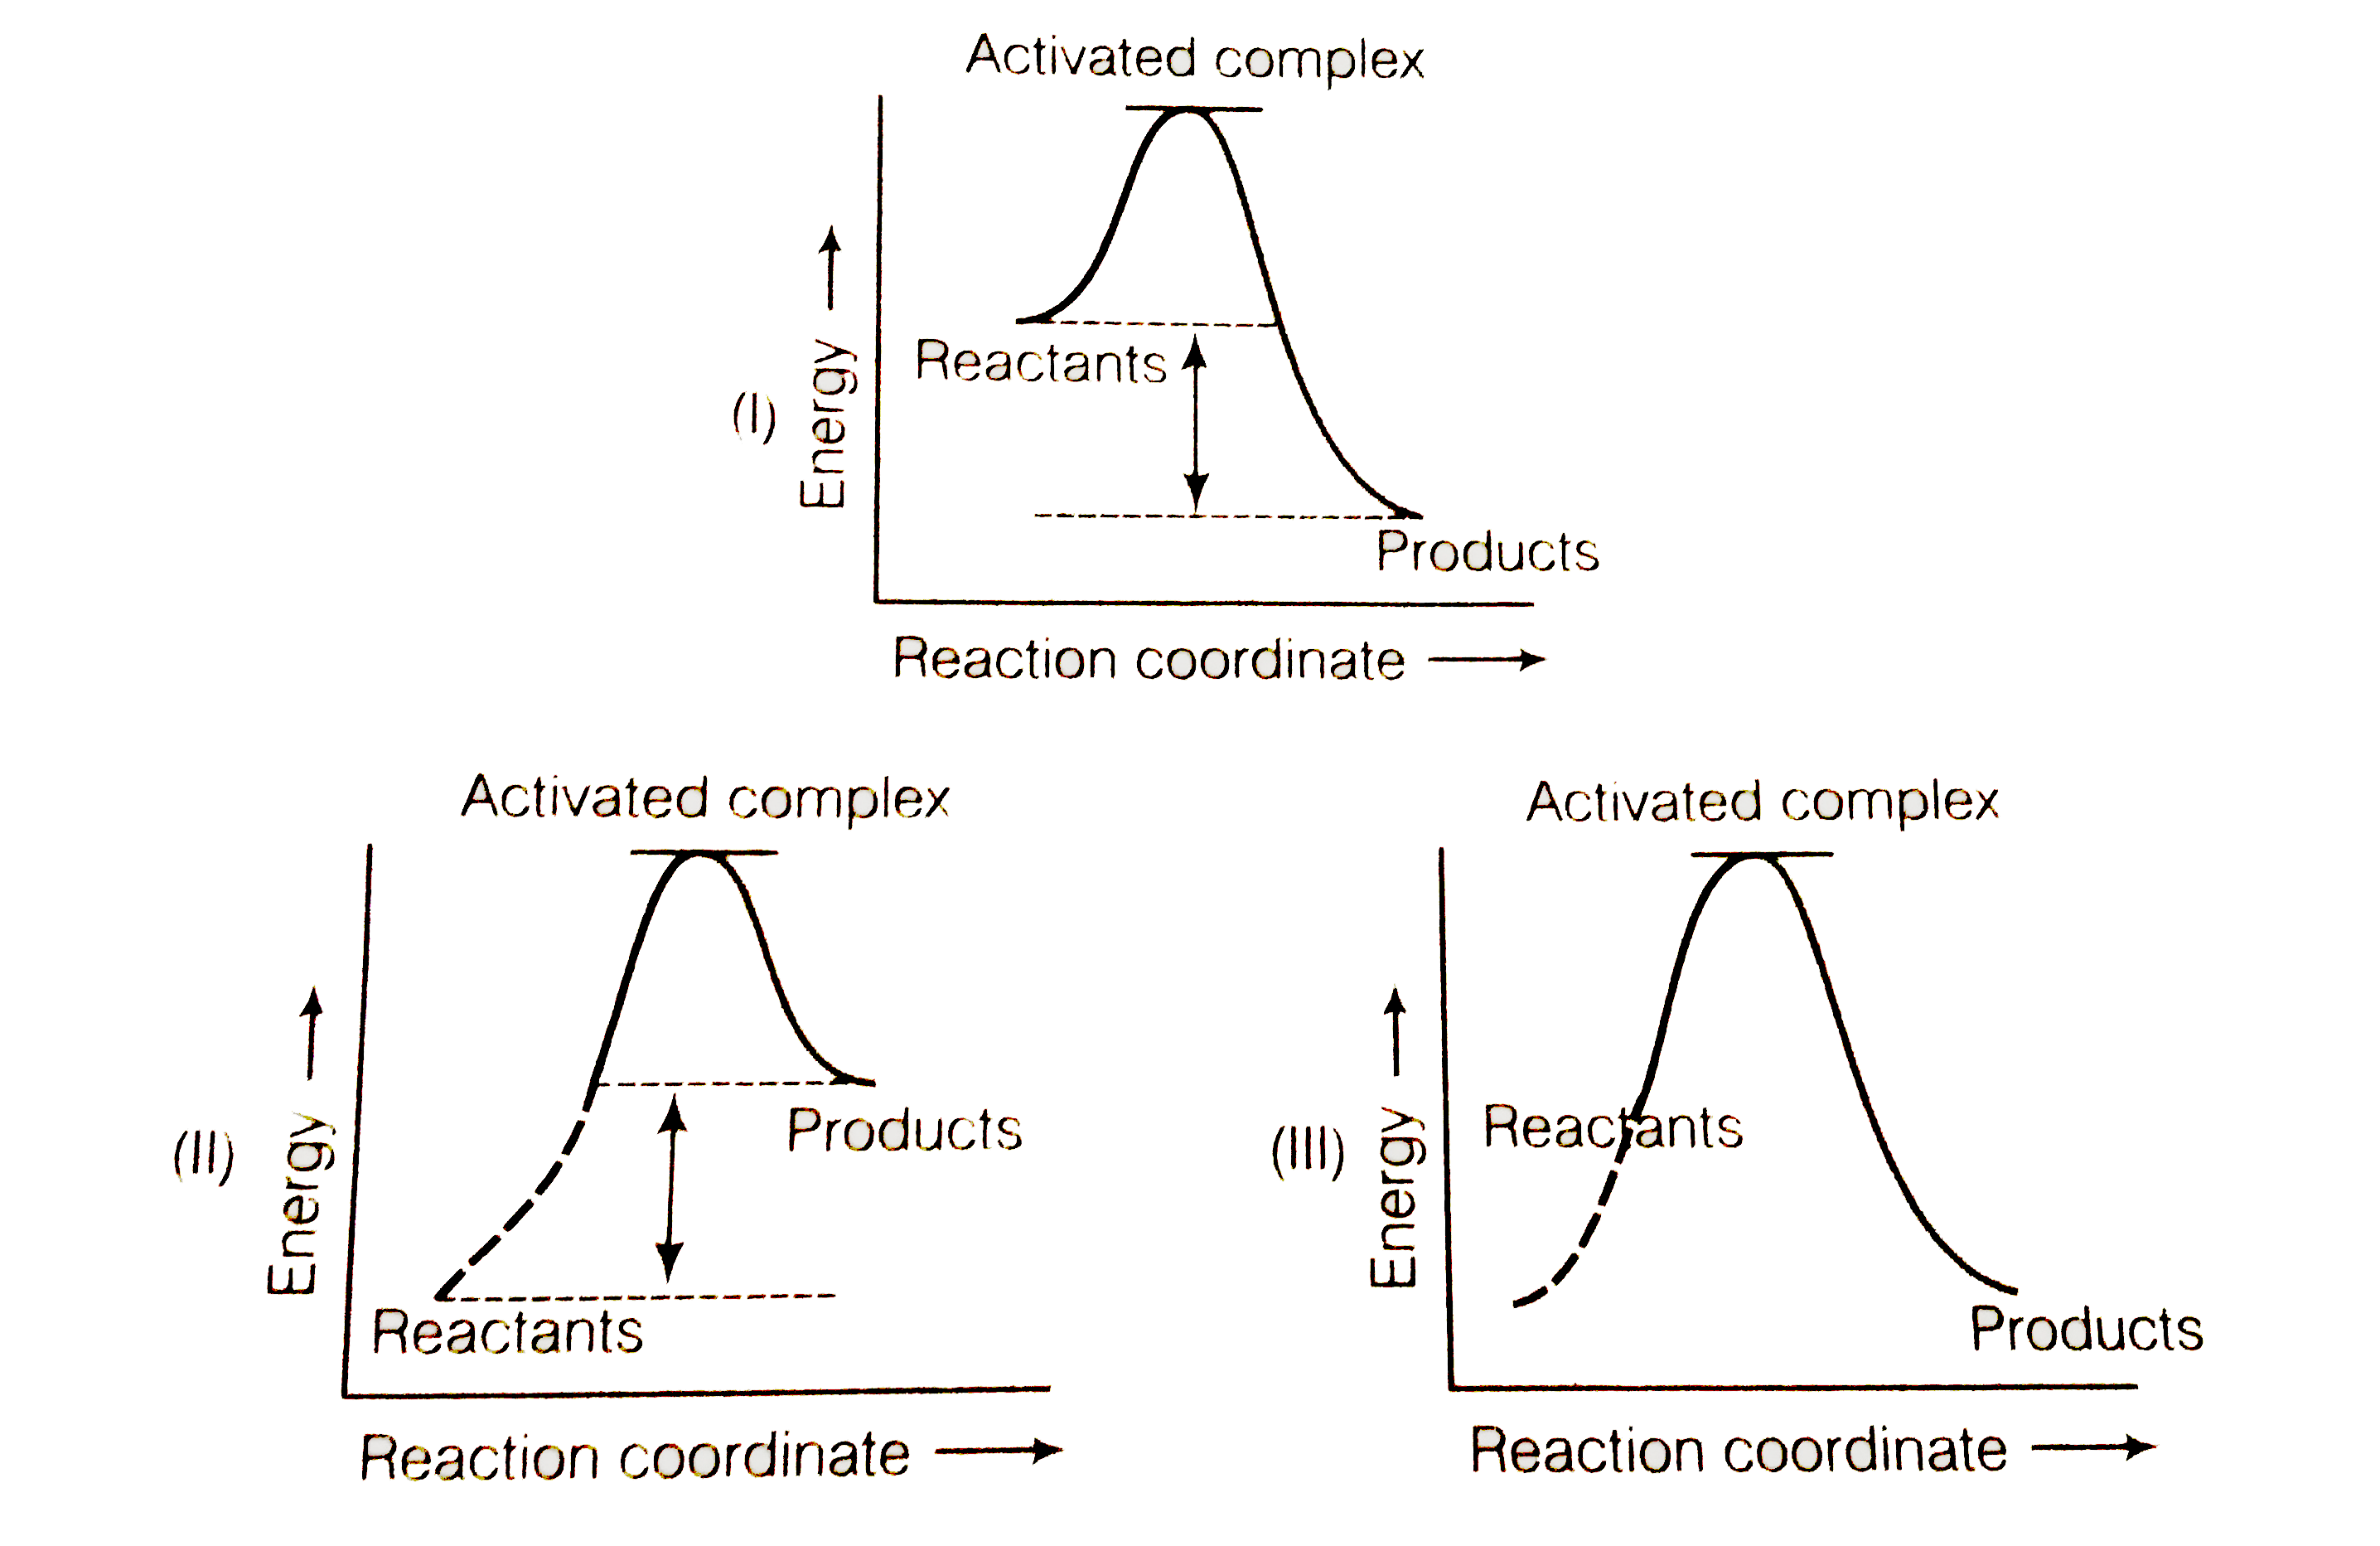
View SolutionWhich of the following graph represents exothermic reaction ?
View SolutionWhich of the following graph represents uniform motion
View SolutionAccording to Arrhenius equation, rate constant k is equal to Ae−Ea/RT Which of the following options represents the graph of In k vs1T ?
View Solution
