Select the correct statement :
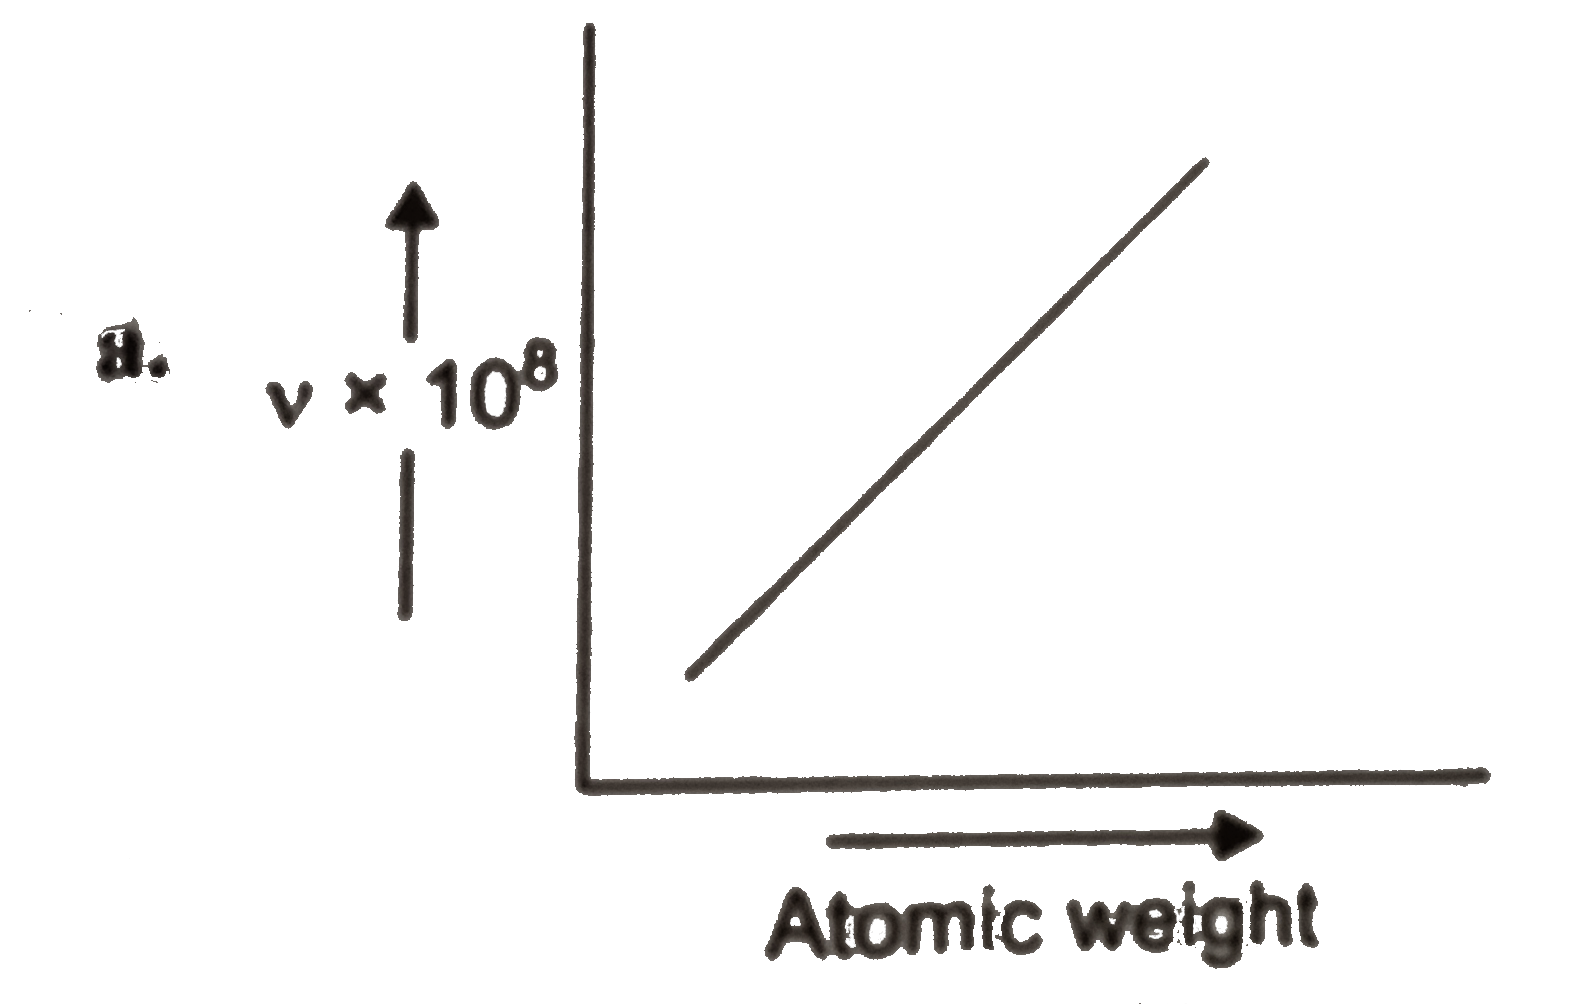
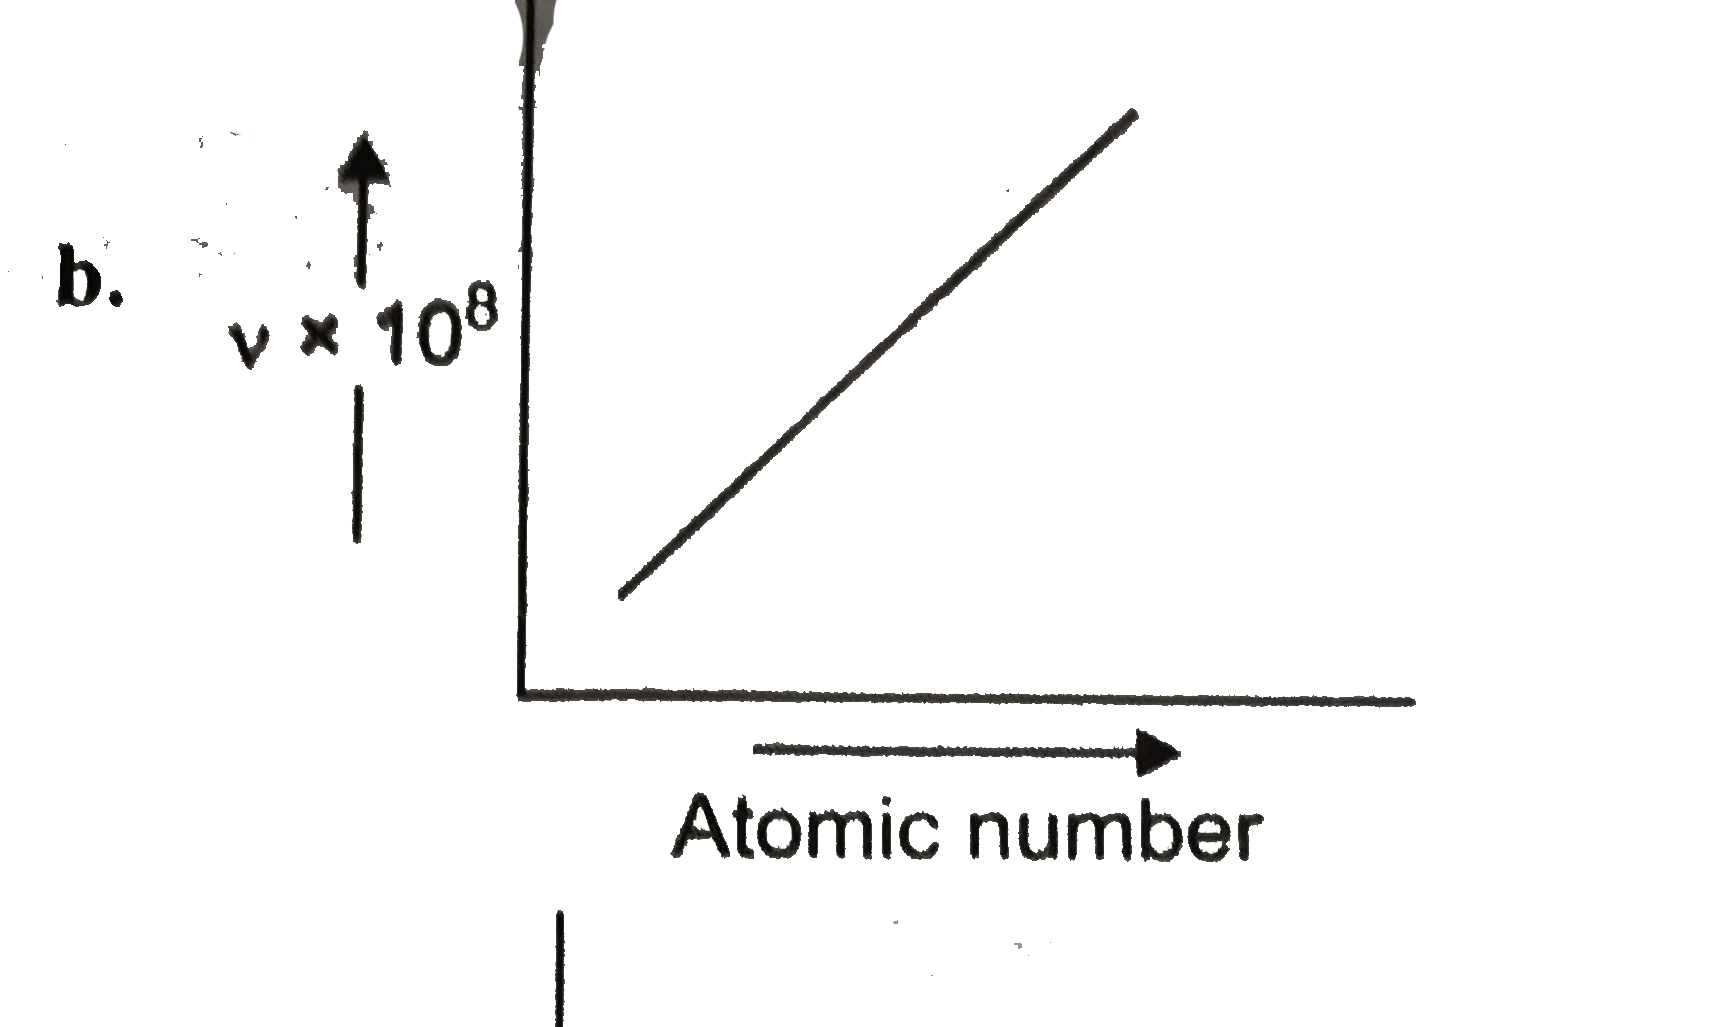
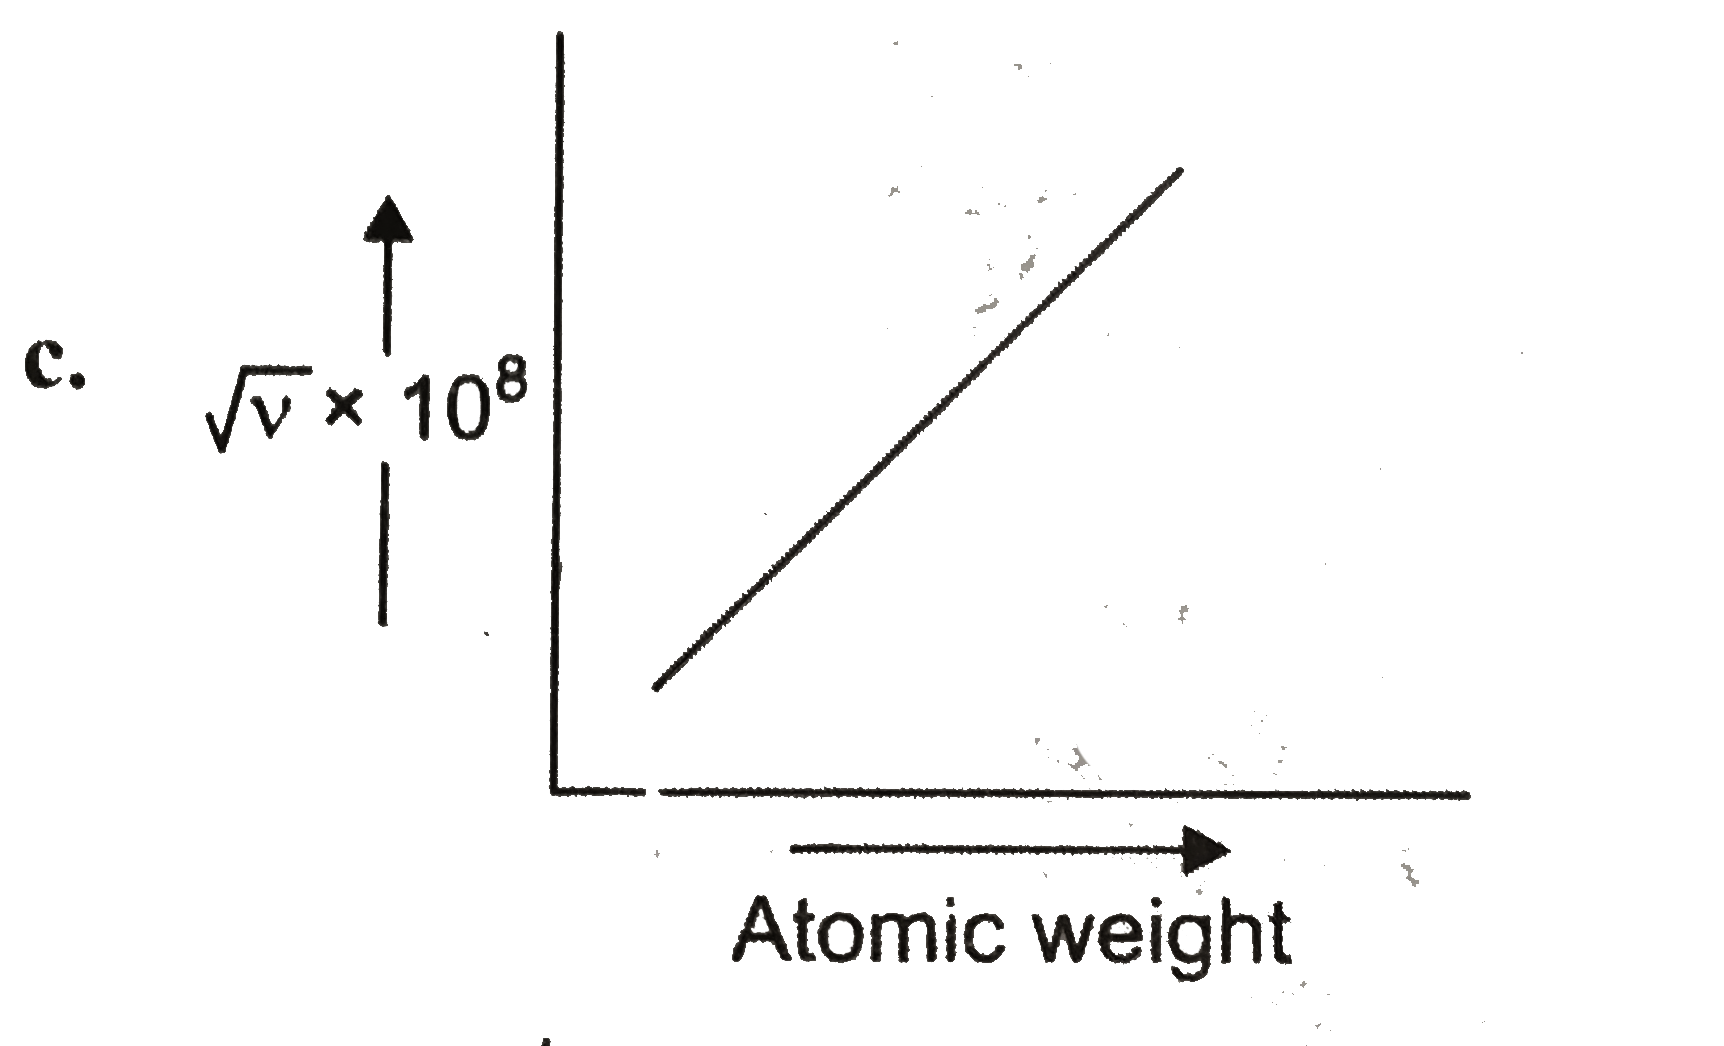
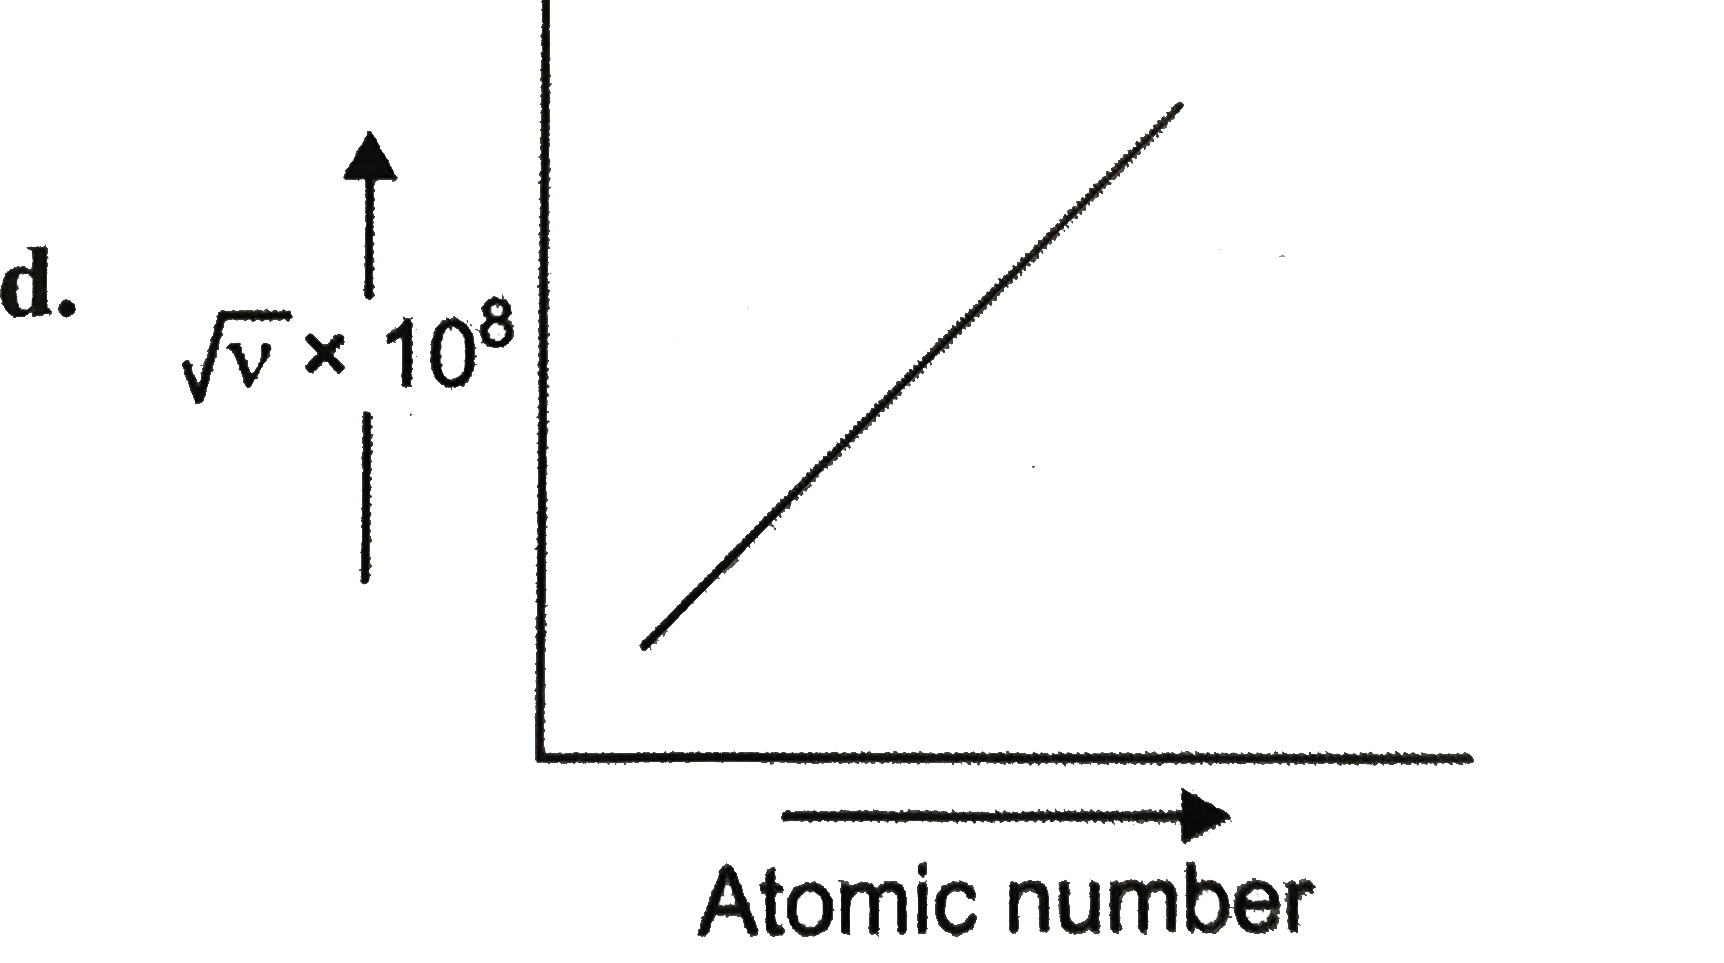
Which of the following graph represents Mosely's experiement.
(v= frequency of X-rays)


The correct Answer is:D
To solve the question regarding which graph represents Moseley's experiment, we can follow these steps:
Step 1: Understand Moseley's Experiment
Moseley's experiment established a relationship between the atomic number (Z) of elements and the frequency (ν) of the X-rays emitted by the elements.
Step 2: Identify the Relationship
According to Moseley, the atomic number (Z) is directly proportional to the frequency of X-rays. Mathematically, this can be expressed as:
Z∝ν
However, it is important to note that the correct relationship in Moseley's findings is:
Z∝√ν
This means that the atomic number is proportional to the square root of the frequency of X-rays.
Step 3: Analyze the Graphs
When plotting the relationship, we need to look for a graph that shows a straight line when plotting atomic number (Z) against the square root of frequency (√ν).
Step 4: Select the Correct Option
Among the given options, we need to identify which graph represents a linear relationship between atomic number and the square root of frequency. The correct graph will be the one that shows a straight line when atomic number is plotted on the y-axis and √ν on the x-axis.
Conclusion
After analyzing the options, the correct graph that represents Moseley's experiment is the one that corresponds to the relationship between atomic number and the square root of frequency, which is given in option D.
Final Answer
The correct answer is Option D.
---
Moseley's experiment established a relationship between the atomic number (Z) of elements and the frequency (ν) of the X-rays emitted by the elements.
According to Moseley, the atomic number (Z) is directly proportional to the frequency of X-rays. Mathematically, this can be expressed as:
Z∝ν
However, it is important to note that the correct relationship in Moseley's findings is:
Z∝√ν
This means that the atomic number is proportional to the square root of the frequency of X-rays.
When plotting the relationship, we need to look for a graph that shows a straight line when plotting atomic number (Z) against the square root of frequency (√ν).
Among the given options, we need to identify which graph represents a linear relationship between atomic number and the square root of frequency. The correct graph will be the one that shows a straight line when atomic number is plotted on the y-axis and √ν on the x-axis.
After analyzing the options, the correct graph that represents Moseley's experiment is the one that corresponds to the relationship between atomic number and the square root of frequency, which is given in option D.
The correct answer is Option D.
Topper's Solved these Questions
- PERIODIC CLASSIFICATION OF ELEMENTS AND GENERAL INORGANIC CHEMISTRYBOOK - CENGAGE CHEMISTRY ENGLISHCHAPTER - PERIODIC CLASSIFICATION OF ELEMENTS AND GENERAL INORGANIC CHEMISTRYEXERCISE - Ex 1.2
1 Videos
- PERIODIC CLASSIFICATION OF ELEMENTS AND GENERAL INORGANIC CHEMISTRYBOOK - CENGAGE CHEMISTRY ENGLISHCHAPTER - PERIODIC CLASSIFICATION OF ELEMENTS AND GENERAL INORGANIC CHEMISTRYEXERCISE - Ex 1.2(Objective)
22 Videos
- PERIODIC CLASSIFICATION OF ELEMENTS AND GENERAL INORGANIC CHEMISTRYBOOK - CENGAGE CHEMISTRY ENGLISHCHAPTER - PERIODIC CLASSIFICATION OF ELEMENTS AND GENERAL INORGANIC CHEMISTRYEXERCISE - Ex 1.1 (Very Short)
22 Videos
- P-BLOCK GROUP 14 - CARBON FAMILYBOOK - CENGAGE CHEMISTRY ENGLISHCHAPTER - P-BLOCK GROUP 14 - CARBON FAMILYEXERCISE - Exercises Archives (Subjective)
9 Videos
- PURIFICATION OF ORGANIC COMPOUNDS AND QUALITATIVE AND QUANTITATIVE ANALYSISBOOK - CENGAGE CHEMISTRY ENGLISHCHAPTER - PURIFICATION OF ORGANIC COMPOUNDS AND QUALITATIVE AND QUANTITATIVE ANALYSISEXERCISE - Assertion Reasoning Type
5 Videos
Similar Questions
Select the correct statements among the followings
View SolutionSelect the correct statement from the following .
View SolutionSelect the correct statement from the following.
View SolutionSelect the incorrect statement from the following
View SolutionSelect the correct statement from the following
View SolutionSelect the correct statement from the following
View SolutionSelect the correct statement from the following.
View SolutionSelect the correct statement from the following.
View SolutionSelect the correct statement from the following
View SolutionSelect the correct Statement from the following.
View Solution
