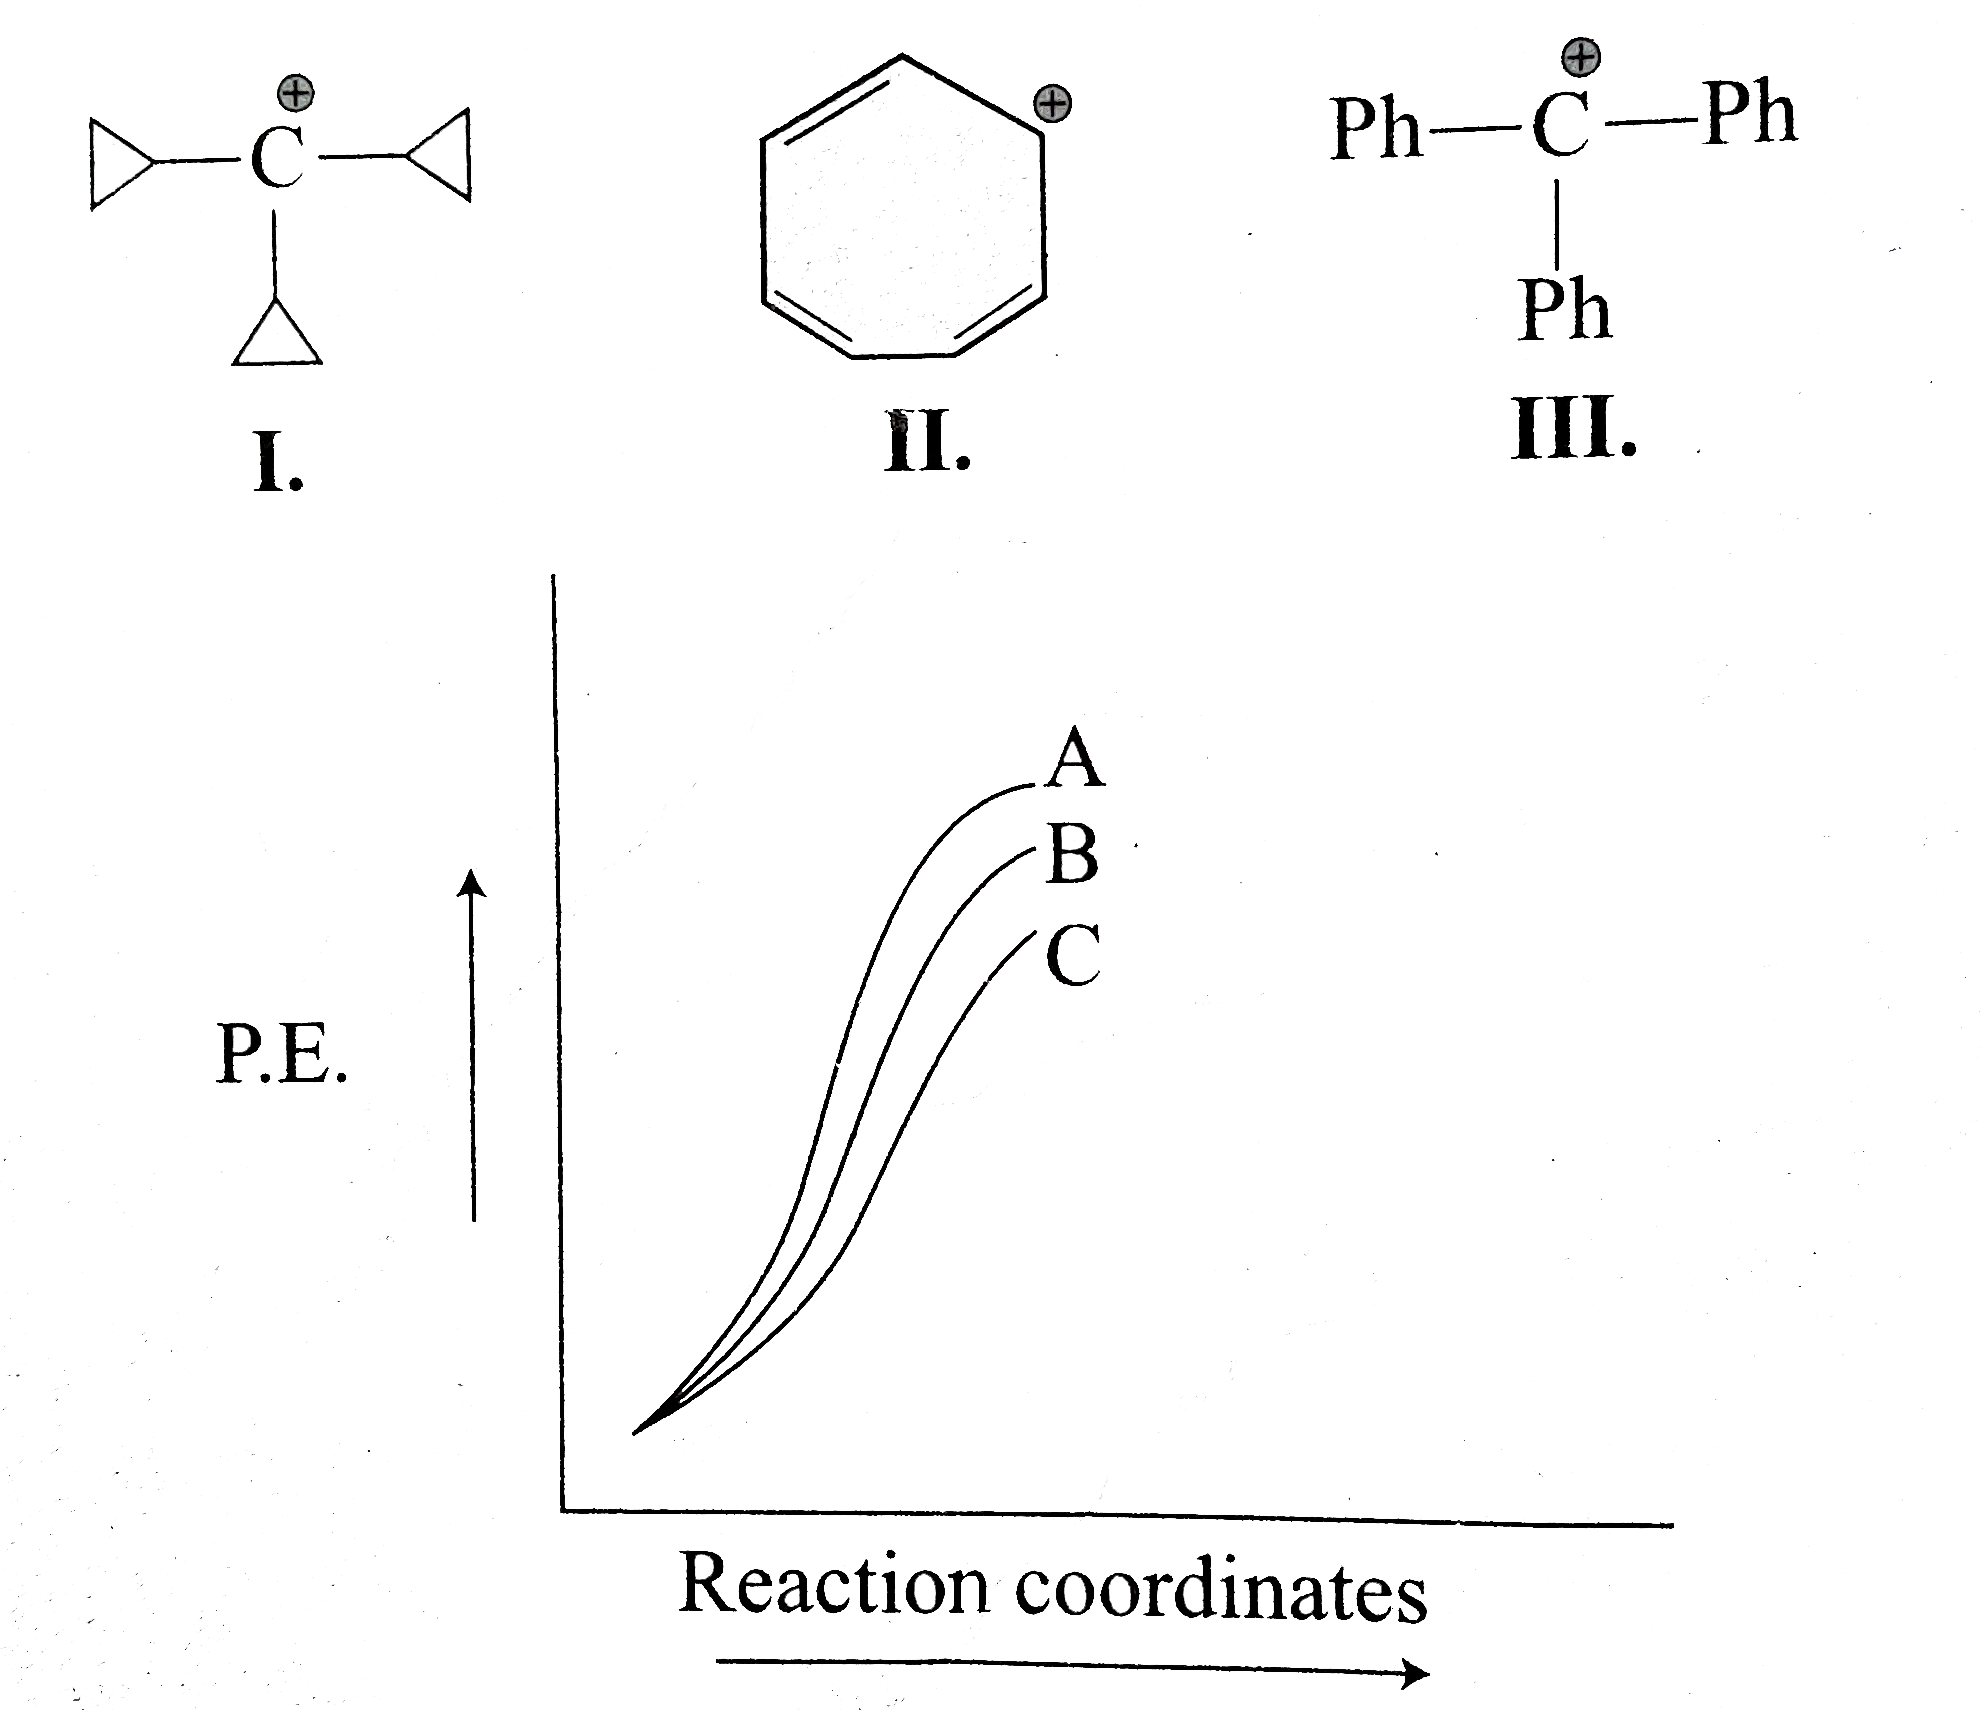
In the following graph, stability of different carbocations have been shows :

Match the potential energy curve with carbocation.
A
IIIIlIABC
B
IIIlIIBAC
C
IIIlIICBA
D
IIIIIlCAB
Video Solution
Text Solution
The correct Answer is:C
( c) The larger the stability, the smaller the P.E , hence I>II>III.
|
Topper's Solved these Questions
- GENERAL ORGANIC CHEMISTRYBOOK - CENGAGE CHEMISTRY ENGLISHCHAPTER - GENERAL ORGANIC CHEMISTRYEXERCISE - Assertion-Reasoning
5 Videos
- GENERAL ORGANIC CHEMISTRYBOOK - CENGAGE CHEMISTRY ENGLISHCHAPTER - GENERAL ORGANIC CHEMISTRYEXERCISE - Archives
12 Videos
- GENERAL ORGANIC CHEMISTRYBOOK - CENGAGE CHEMISTRY ENGLISHCHAPTER - GENERAL ORGANIC CHEMISTRYEXERCISE - Multiple Correct
22 Videos
- CLASSIFICATION AND NOMENCLATURE OF ORGANIC COMPOUNDSBOOK - CENGAGE CHEMISTRY ENGLISHCHAPTER - CLASSIFICATION AND NOMENCLATURE OF ORGANIC COMPOUNDSEXERCISE - Analytical and Descriptive Type
3 Videos
- HYDROGEN, WATER AND HYDROGEN PEROXIDEBOOK - CENGAGE CHEMISTRY ENGLISHCHAPTER - HYDROGEN, WATER AND HYDROGEN PEROXIDEEXERCISE - Subjective Archive (Subjective)
3 Videos
Similar Questions
Knowledge Check
Stability of alkyl carbocations can be explained by
Ainductive effect onlyBhyperconjugation onlyCboth inductive effect and hyperconjugationDelectromeric effect onlyWhich of the following is the most stabilized carbocation ?
A B
B C
C D
D
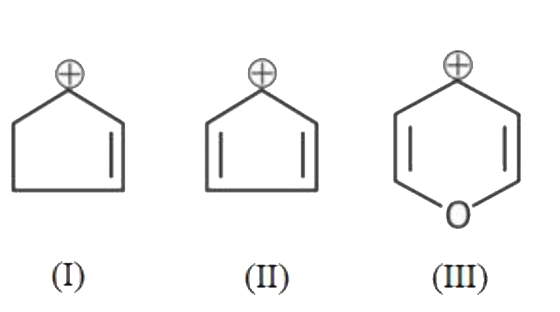
Compare the stability of following carbocations .

View SolutionWhich of the following is the most stabilized carbocation ?
View SolutionArrange stability of the given carbocation in decreasing order :

View SolutionWhich of the following is the most stable carbocation here ?
View SolutionWhich of the following is the most stable carbocation?
View SolutionWhich amongst the following is the most stable carbocation?
View Solution

