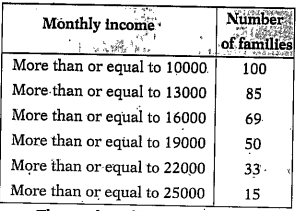
Consider the following frequency distribution. The number of families having income range from ₹16000 to ₹19000 is ....... Solution in Telugu
19
10
20
none
Step by step video & image solution for Consider the following frequency distribution. The number of families having income range from ₹16000 to ₹19000 is ....... by Maths experts to help you in doubts & scoring excellent marks in Class 10 exams.
Updated on:21/07/2023Topper's Solved these Questions
- STATISTICSBOOK - VGS PUBLICATION-BRILLIANTCHAPTER - STATISTICSEXERCISE - EXERCISE 14 .4
2 Videos
- SIMILAR TRIANGLES BOOK - VGS PUBLICATION-BRILLIANTCHAPTER - SIMILAR TRIANGLES EXERCISE - CREATIVE BITS FOR CCE MODEL EXAMINATION
90 Videos
- SUMMATIVE ASSESSMENTBOOK - VGS PUBLICATION-BRILLIANTCHAPTER - SUMMATIVE ASSESSMENTEXERCISE - SUMMATIVE ASSESSMENT
61 Videos
Similar Questions
The following distribution gives the daily income of 50 workers of a factory .
Daily (in Rupees)Number of workers250−30012300−35014350−4008400−4506450−50010
Convert the distribution above to a lessthan type cumulative frequency distribution, and draw its ogive .
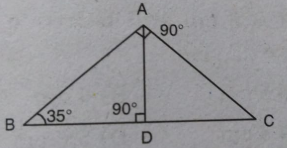
View SolutionFrom the figure ,∠DAC……….

View SolutionRamu says, "If log10x=0, value of x=0". Do you agree with him ? Give reason.
View SolutionMatch the following lists:

View SolutionHow many lines of symmetry does the above figure have ?
View SolutionWhich of the following are correct chain isomers of butane ? (i)
View SolutionDetermine the point of symmetry of a regular hexagon.
View SolutionDtermine the images of the following figure about the given line :
View SolutionMatch the following Column A to Column B

View SolutionMatch the following Column A to Column B

View SolutionMatch the following Column A to Column B

View SolutionThe inequation represented by the graph given below is :
View SolutionThe inequation that best describes the graph given below is _________
View SolutionThe inequation that best describes the following graph is _________
View SolutionWhich inequations represent the shaded region in the given figure
View Solution
