In a dinner party both fish and meat were served. Some took only fish and some only meat. There were some vegetarians who did not accept either. The rest accepted both fish and meat. Which of the following Venn-diagrams correctly this situation ?
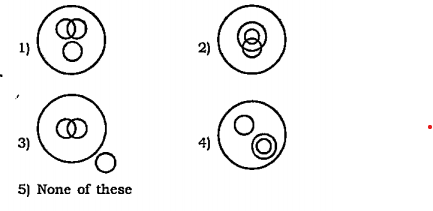
1,
Topper's Solved these Questions
Similar Questions
In a feast organised in connection with a marriage, some of the participants were vegetarians, some others were non-vegetarians. Another group was of non vegetarians not eating meat and yet another group of people eating meat but not fish. Which of the following represents this statistics?

View SolutionIn the accounts department of a company, there are some who are only chartered accountants and some who are only cost accountants. A few hold both chartered and cost accountancy qualifications. Besides these there are others who hold Management accountancy qualifications. Some of these management accountants have also done either chartered or cost accountancy or both. Which of the following figures represents these facts ?

View Solution
Knowledge Check
In the accounts department of a company, there are some who are only chartered accountants and some who are only cost accountants. A few hold both chartered and cost accountancy qualifications. Besides these there are others who hold Management accountancy qualifications. Some of these management accountants have also done either chartered or cost accountancy or both. Which of the following figures represents these facts ?
A B
B C
C D
D
Use the statement given below to answer the questions that follow.in
All good athletes want to win and all athletes who want to win, eat a well-balanced diet, therefore, all athletes who do not eat a well-balanced diet are bad athletes.
A rare kind of fish is used in extracting an ingredient for some of the most exotic dishes in Burma. It takes at least five fishes to produce 500 grams of this product. Therefore, environmentalists are worried that the fish will soon be extinct. Which of the following would put to rest the doubts about the extinction of the fish?AThe government monitors the production of this ingredient.BThe ingredient is used only in exotic dishes that are very costly.CThis fish is found only in the Polar Regions.DThis fish propagates very fast and is already overcrowding the ponds where it is foundThere are 70 students in a class. Of them, 50 students like cricket. 35 like both cricket and football and some like only football. Select the Venn diagram that correctly represents the given information.
A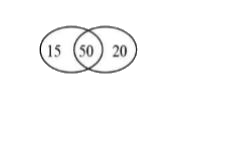 B
B C
C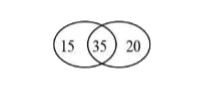 D
D
Each of question given below is based on the given diagram. You have to take the given diagram to be true even if it seems to be at variance with commonly known facts and then decide which of the five alternatives following each question logically follows from the given diagram. The diagram comprises three circles showing people from three different countries who have travelled to either , both or none of the countries mentioned in the diagram.
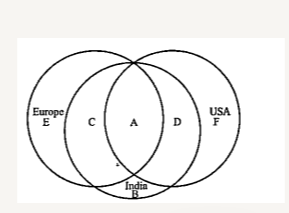
Which of the following represents Indians who have travelled only to Europe but not to the USA?
1) Only C
2) Only B
3) Only A
4) A and C
5) Only E
View SolutionEach of question given below is based on the given diagram. You have to take the given diagram to be true even if it seems to be at variance with commonly known facts and then decide which of the five alternatives following each question logically follows from the given diagram. The diagram comprises three circles showing people from three different countries who have travelled to either , both or none of the countries mentioned in the diagram.
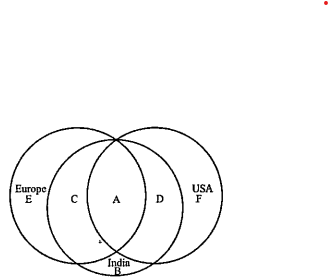
Which of the following represents those Europeans who have travelled only the USA but not to India?
1) Only C
2) Only A
3) F and C
4) Only D
5)Not illUStrated in the diagram
View SolutionIn a given question below is a statement followed by two conclusions numbered I and II. You have to assume everything in the statement to be true, then consider the two conclusions together and decide which of them logically follows beyond a reasonable doubt from the information given in the statement.
Give answer
(a) if only conclusion I follows, (b) if only conclusion II follows,
(c) if either I or II follows,
(d) if neither I nor II follows: and
(e) if both I and II follow
Statement: The President of XYZ Party indicated that 25 independent members of Legislative Assembly (M.L.As) are seriously considering various options of joining some political party. But in any case all of them collectively will join one only.
Conclusion: I. The 25 independent M.L.As wil join XYZ party in a short period of time.
II. The 25 independent M.L.As will join some other political party in a short period of time.
View SolutionThe president of India was recently on a visit to South Korea and Mongolia. During her visit some agreements were signed by both the countries. Which of the following was a common area on which India signed agreements with South Korea and Mongolia both?
View SolutionJanice was on cloud nine. Starting from today, she would be going fishing with her father every Saturday. Janice had always wanted to go fishing. She liked to feel the cool breeze blowing on her face. She was always in awe of the many colourful fish that made their home in the sea. Janice checked her fishing equipment again. Everything she needed was in her haversack, neatly packed as they had been three days ago Hearing her father call her, she dashed down the stairs and into his car. Janice could not stop talking about the fishing trip on their way there. She wanted to catch a big fish for dinner that night. She also wanted to compete with her father to see who could catch up on her other favourite activity - reading. Janice's brother did not like fishing, Not only did he feel that it was too time-consuming, he also felt that little skill was needed for the activity. "It's all a matter of luck," he always said. You just leave the rod at one stop and wait for the fish to bite” Janice disagreed with her brother's point of view. She knew that different types of fish needed different types of bait. She also knew that experienced fisherman would know exactly which part of the ocean contained the species of fish that they were interested in, the fisherman had extensive knowledge of marine life. They had knowledge of the food chain which they used to determine where the fish were located. Knowing that dolphins ate tuna, they knew that they would be able to find tuna where the dolphins usually lived.
When Janice reached the pier, she took out her equipment and ran towards the boat her father owned. She could not wait for the day to start.
According to Janice's brother a fishing trip would be successful if the person fishing _____
View Solution
