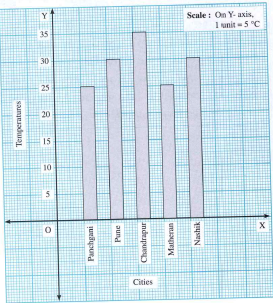
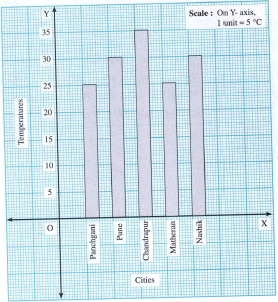
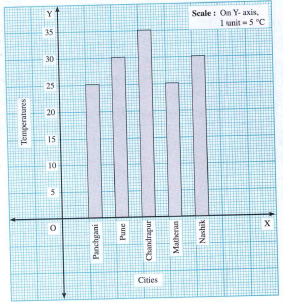
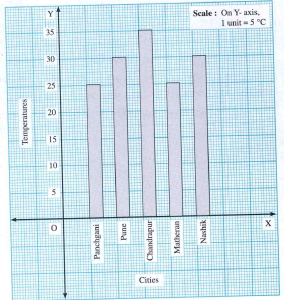
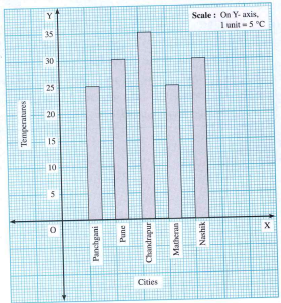
This bar graph shows the temperatures in degree Celsius in different cities on a certain day in February. Observe the graph and answer the questions :
What is the difference between the maximum temperatures of Panchgani and Chandrapur ?
 Solution in Marathi
The maximum temperature of Panchgani was 25∘C. The maximum temperature of Chandrapur was 35∘C. The difference in the temperature of these two cities was 35∘C−25∘C=10∘C.
Topper's Solved these Questions
Similar Questions
What would be the yearly interest on ₹ 6000 at 10 p.c.p.a. ?
02:11View SolutionObserve the figure and name
Collinear points
 02:45View Solution
Determine the point of symmetry of a regular hexagon.
02:17View SolutionMatch the following Column A to Column B
 05:41View Solution
Match the following Column A to Column B
 02:10View Solution
Match the following Column A to Column B
 02:17View Solution
The inequation represented by the graph given below is :
02:10View SolutionThe inequation that best describes the graph given below is _________
02:41View SolutionThe inequation that best describes the following graph is _________
01:07View SolutionFrom the following figure, the correct observation is :- ltimg src="https://d10lpgp6xz60nq.cloudfront.net/physics_images/ALN_PHY_R03_E08_015_Q01.png" width="80%"gt
00:52View SolutionThis bar graph shows the temperatures in degree Celsius in different cities on a certain day in February. Observe the graph and answer the questions :
What data is shown on the vertical and the horizontal lines ?
 00:59View Solution
This bar graph shows the temperatures in degree Celsius in different cities on a certain day in February. Observe the graph and answer the questions :
Which city had the highest temperature ?
 00:52View Solution
This bar graph shows the temperatures in degree Celsius in different cities on a certain day in February. Observe the graph and answer the questions :
Which cities had equal maximum temperatures ?
 01:06View Solution
This bar graph shows the temperatures in degree Celsius in different cities on a certain day in February. Observe the graph and answer the questions :
Which cities had a maximum temperature of 30∘C ?
 02:17View Solution
This bar graph shows the temperatures in degree Celsius in different cities on a certain day in February. Observe the graph and answer the questions :
What is the difference between the maximum temperatures of Panchgani and Chandrapur ? 01:49View Solution
This bar graph shows the temperatures in degree Celsius in different cities on a certain day in February. Observe the graph and answer the questions :
What data is shown on the vertical and the horizontal lines ?
 02:09View Solution

