The composition of air can be best represented by drawing a :
pie chart
bar graph
line graph
histogram
The correct Answer is:A
To solve the question regarding how to best represent the composition of air, we can follow these steps:
1. Understand the Composition of Air:
Air is primarily composed of several gases, including nitrogen (approximately 78%), oxygen (approximately 21%), argon (approximately 0.93%), carbon dioxide (approximately 0.04%), and trace amounts of other gases.
2. Identify the Purpose of Representation:
We want to visually represent the proportions of these gases in air. This will help in understanding the relative amounts of each component in a clear and concise manner.
3. Choose the Right Graphical Representation:
Among the various options like pie charts, bar graphs, line graphs, and histograms, a pie chart is particularly effective for showing parts of a whole. Since we are dealing with percentages of different gases that make up the entire composition of air, a pie chart will allow us to see how much each gas contributes to the total.
4. Draw the Pie Chart:
To create the pie chart, we would represent the entire circle as 100%. Each gas will occupy a segment of the pie based on its percentage in the air. For example:
- Nitrogen: 78% (largest segment)
- Oxygen: 21% (second largest segment)
- Argon: 0.93% (small segment)
- Carbon Dioxide: 0.04% (very small segment)
- Other gases: Trace amounts (even smaller segments)
5. Label the Pie Chart:
Each segment of the pie chart should be labeled with the name of the gas and its percentage to provide clarity on what each part represents.
Final Conclusion:
The composition of air can be best represented by drawing a pie chart, as it effectively illustrates the proportions of different gases that make up the air we breathe.
---
Air is primarily composed of several gases, including nitrogen (approximately 78%), oxygen (approximately 21%), argon (approximately 0.93%), carbon dioxide (approximately 0.04%), and trace amounts of other gases.
We want to visually represent the proportions of these gases in air. This will help in understanding the relative amounts of each component in a clear and concise manner.
Among the various options like pie charts, bar graphs, line graphs, and histograms, a pie chart is particularly effective for showing parts of a whole. Since we are dealing with percentages of different gases that make up the entire composition of air, a pie chart will allow us to see how much each gas contributes to the total.
To create the pie chart, we would represent the entire circle as 100%. Each gas will occupy a segment of the pie based on its percentage in the air. For example:
- Nitrogen: 78% (largest segment)
- Oxygen: 21% (second largest segment)
- Argon: 0.93% (small segment)
- Carbon Dioxide: 0.04% (very small segment)
- Other gases: Trace amounts (even smaller segments)
Each segment of the pie chart should be labeled with the name of the gas and its percentage to provide clarity on what each part represents.
The composition of air can be best represented by drawing a pie chart, as it effectively illustrates the proportions of different gases that make up the air we breathe.
Topper's Solved these Questions
- MOTION AND TIMEBOOK - LAKHMIR SINGH & MANJIT KAURCHAPTER - MOTION AND TIMEEXERCISE - EXERCISE
108 Videos
- LIGHTBOOK - LAKHMIR SINGH & MANJIT KAURCHAPTER - LIGHTEXERCISE - EXERCISEE
130 Videos
- WINDS, STORMS AND CYCLONESBOOK - LAKHMIR SINGH & MANJIT KAURCHAPTER - WINDS, STORMS AND CYCLONESEXERCISE - EXERCISE
92 Videos
Similar Questions
Knowledge Check
The structure of ozone can best be represented by
A..:O=+O−..O:B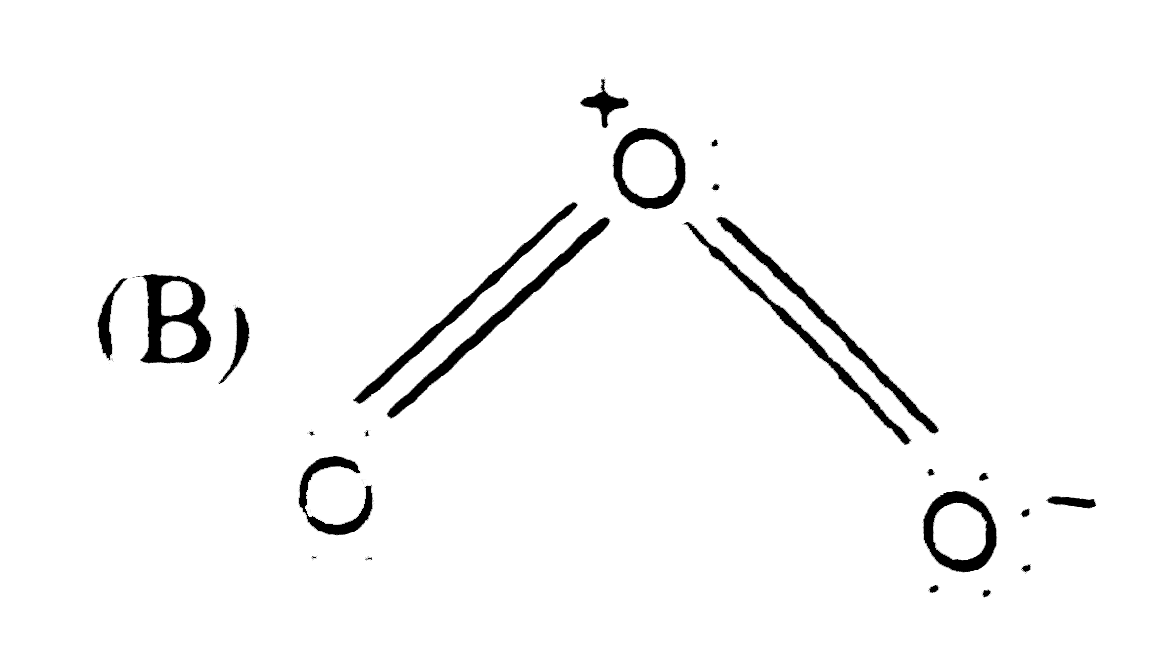 C
C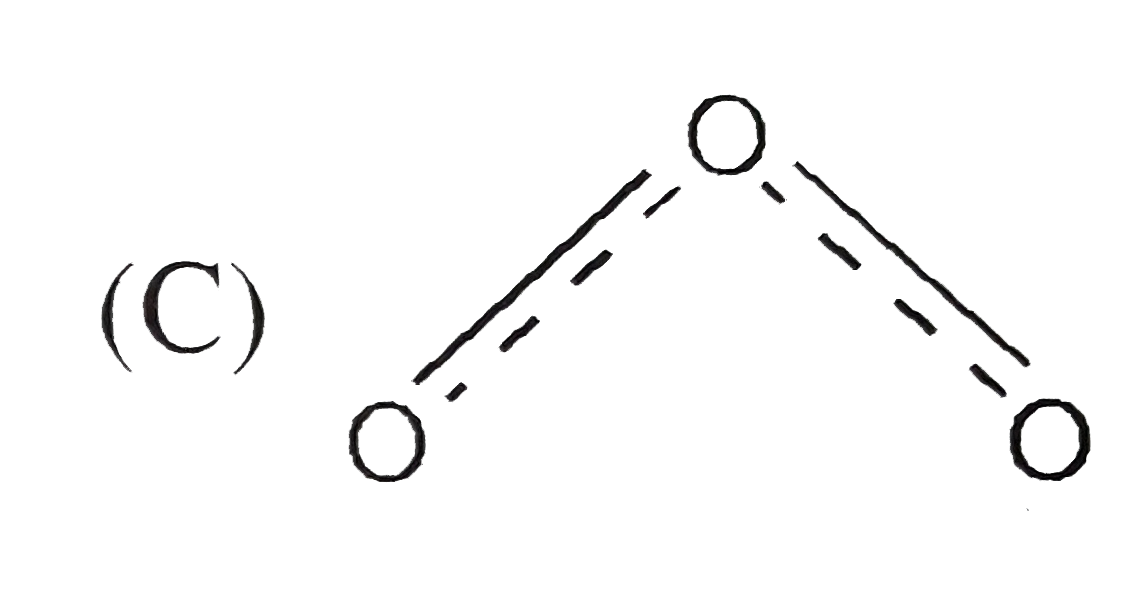 D..:O=..O ..O:
The H-Bonds in solid HF can be best represented as :
AH-F---H-F---H-FB C
C D
D
The H-bonds in solid HF can be best represented as :
AH−F….H−F…H−FB C
C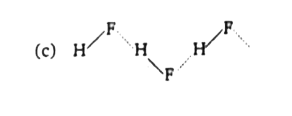 D
D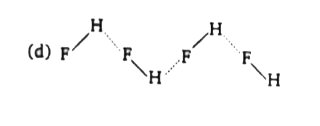
A monosomic organism can best be represented
View SolutionThe quantity of motion of a body is best represented by
View SolutionIf animals that live on land and the animals that live in water are represented by two big circles and animals that live both in water and on land are represented by a small circle, the combination of these three can be best represented as
View SolutionThe quantity of motion of a body is best represented by .
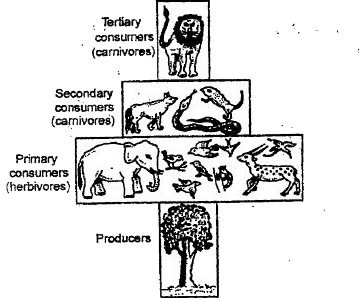
View SolutionThe given figure best represents
View Solution

