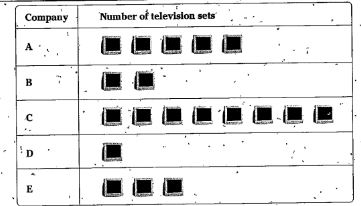
The sale of television sets of different companies on a day is shown in the pictograph given below. Which company had the least sale? Solution in Telugu
Step by step video & image solution for The sale of television sets of different companies on a day is shown in the pictograph given below. Which company had the least sale? by Maths experts to help you in doubts & scoring excellent marks in Class 6 exams.
Similar Questions
Find the area of the figure given below.
 02:21View Solution
The area of the shaded part in the figure given below is ______.
 02:03View Solution
The inequation represented by the graph given below is :
02:10View SolutionThe inequation that best describes the graph given below is _________
02:17View SolutionThe inequation that best describes the following graph is _________
02:10View SolutionWhich inequations represent the shaded region in the given figure
04:23View SolutionThe sale of television sets of different companies on a day is shown in the pictograph given below. How many TVs of company A were sold?
02:08View SolutionThe sale of television sets of different companies on a day is shown in the pictograph given below. Which company sold 15 TV sets? scale:each Telivision=5 Telivisions
04:09View Solution

