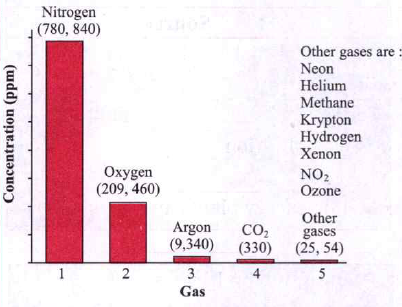
Plot a graph showing the proportion of various gases in earth's atmosphereSolution in Marathi
Topper's Solved these Questions
Similar Questions
Enlists the units of classification.
View SolutionWhich of the following noble gases is present in the Earth's atmosphere in maximum percentage by volume?
View SolutionWhich one of the following gases is placed second in respect of abundance in the Earth's atmosphere?
View SolutionThe figure shows relative contributions of various green house gases to the total global warming. (i) Name the gases (a) and (b) (ii) Explain how increase in green-house gases in earth's atmosphere leads to rise in sea level?
View Solutionवायुमण्डल के विभिन्न घटको के नाम तथा उनका अनुपात लिखिए |
View SolutionWhat would happen, if the greenhouse gases were totally missing in the earth's atmosphere ?
View SolutionThe scattering of sunlight by the atoms or molecules of the gases in the earth's atmosphere is known as ________ scattering.
View Solutionतरंगदैर्घ्य के साथ लेंस कि शक्ति में परिवर्तन प्रदर्शित करने वाला ग्राफ प्लॉट कीजिये
View SolutionWhat would happen, if the greenhouse gases were totally missing in the earth's atmosphere?
View SolutionLother Meyer plotted a graph showing the variation of
View SolutionExplain the various regions of earth's atmosphere.
View SolutionState the proportion of carbon present in the earth's crust and atmosphere.
View SolutionThe earth's atmosphere are divided into various regions like _____, _____, _____ and _____.
View SolutionName the gases that were found in primitive earth's atmosphere.
View SolutionState the effect of green house gases on the temperature of earth's atmosphere.
View SolutionName the radiations which are absorbed by the green house gases in the earth's atmosphere.
View Solution

