Draw a displacement-distance graph for two waves A and B such that the amplitude of wave A is three times that of wave B.
To draw a displacement-distance graph for two waves A and B, where the amplitude of wave A is three times that of wave B, follow these steps:
1. Understand the Concept of Amplitude:
- Amplitude is the maximum displacement of points on a wave from the rest position. In this case, wave A has an amplitude that is three times that of wave B.
2. Define the Amplitudes:
- Let the amplitude of wave B be represented as AB.
- Therefore, the amplitude of wave A will be AA=3×AB.
3. Set Up the Axes:
- Draw a horizontal axis to represent distance (x-axis).
- Draw a vertical axis to represent displacement (y-axis).
4. Plot Wave B:
- Since wave B has an amplitude of AB, plot the wave oscillating between +AB and −AB.
- The wave should have a sinusoidal shape, starting from the origin, reaching its maximum at +AB, returning to the axis, reaching its minimum at −AB, and then returning to the axis again.
5. Plot Wave A:
- For wave A, which has an amplitude of AA=3×AB, plot the wave oscillating between +3AB and −3AB.
- Similarly, this wave will also have a sinusoidal shape, starting from the origin, reaching its maximum at +3AB, returning to the axis, reaching its minimum at −3AB, and then returning to the axis again.
6. Label the Graph:
- Clearly label the two waves as Wave A and Wave B.
- Indicate the amplitudes on the graph: AA=3AB for wave A and AB for wave B.
7. Finalize the Graph:
- Ensure that both waves are drawn accurately and that the amplitude relationship is clear.
- Amplitude is the maximum displacement of points on a wave from the rest position. In this case, wave A has an amplitude that is three times that of wave B.
- Let the amplitude of wave B be represented as AB.
- Therefore, the amplitude of wave A will be AA=3×AB.
- Draw a horizontal axis to represent distance (x-axis).
- Draw a vertical axis to represent displacement (y-axis).
- Since wave B has an amplitude of AB, plot the wave oscillating between +AB and −AB.
- The wave should have a sinusoidal shape, starting from the origin, reaching its maximum at +AB, returning to the axis, reaching its minimum at −AB, and then returning to the axis again.
- For wave A, which has an amplitude of AA=3×AB, plot the wave oscillating between +3AB and −3AB.
- Similarly, this wave will also have a sinusoidal shape, starting from the origin, reaching its maximum at +3AB, returning to the axis, reaching its minimum at −3AB, and then returning to the axis again.
- Clearly label the two waves as Wave A and Wave B.
- Indicate the amplitudes on the graph: AA=3AB for wave A and AB for wave B.
- Ensure that both waves are drawn accurately and that the amplitude relationship is clear.
Topper's Solved these Questions
Similar Questions
Draw a displacement-distance graph of a wave and mark on it, the amplitude of wave by the letter a and wavelength of wave by the letter λ
View SolutionDraw displacement-time graph of a wave and show on it the amplitude and time period of wave.
View SolutionFigure below shows the distance-displacement graph of two waves A and B. Compare (i) the amplitude, (ii) the wavelength of the two waves.

View SolutionThe transversal displacement Vs time graph for two waves A and B which travel along the same string are shown in the figure. Their average intensity ratio IA/IB is
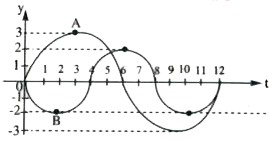
View SolutionThe displacement vs time graph for two waves A and B which travel along the same string arre shown in the figure. Their intensity ratio IA∣IB is
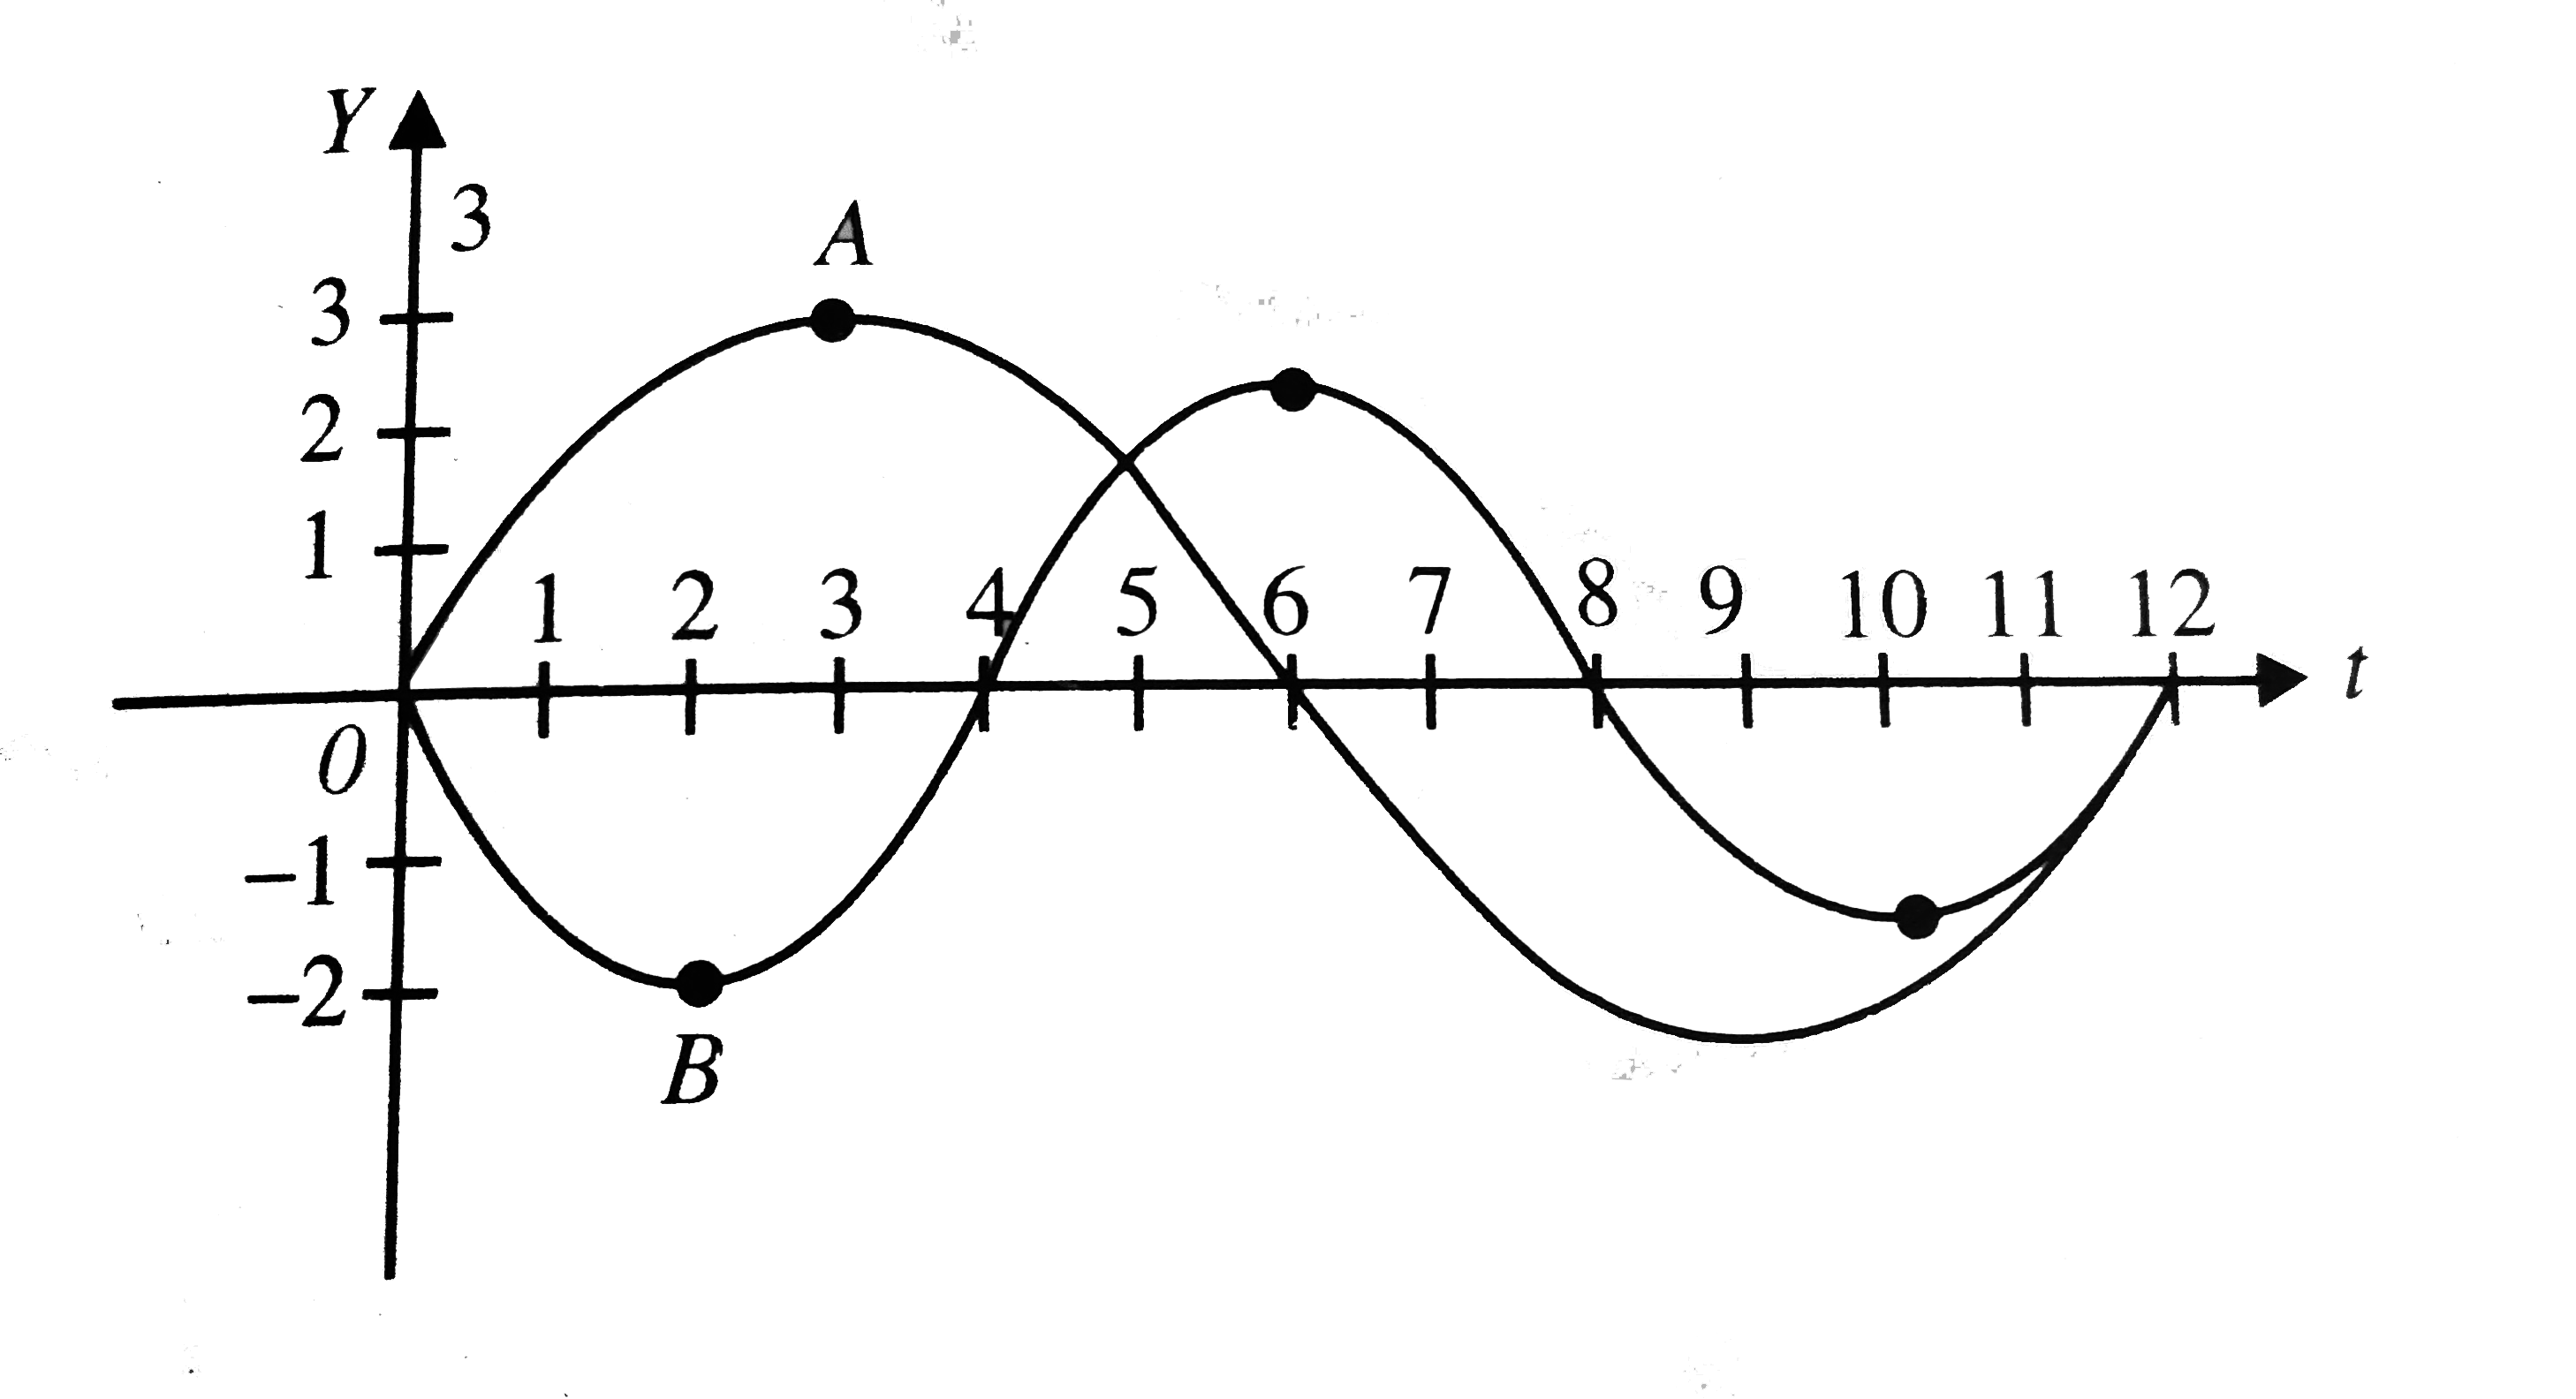
View SolutionThe displacement vs time graph for two waves A and B which travel along the same string arre shown in the figure. Their intensity ratio IA∣IB is

View SolutionIn Fig. , A and B represent the displacement distance graphs for two sound waves when they pass through air.
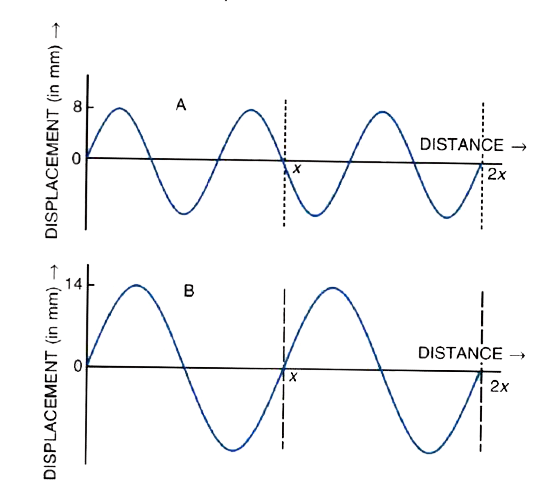
What is the relation between their
wavelengths
View SolutionDisplacement distance graph of two sound waves A and B, travelling in a medium, are as shown in the diagram below:
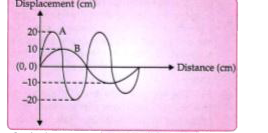
Study the two sound waves and compare their :
Amplitudes
View SolutionDisplacement distance graph of two sound waves A and B, travelling in a medium, are shown in the diagram below.
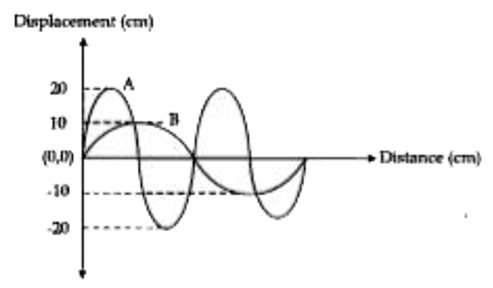
Study the two sound waves and compare their :
(i) Amplitudes, (ii) Wavelengths
View SolutionDisplacement distance graph of two sound waves A and B, travelling in a medium, are as shown in the diagram below:
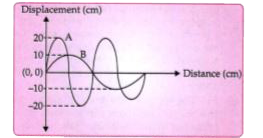
Study the two sound waves and compare their :
Wavelengths
View Solution
