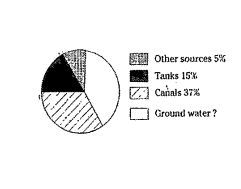
In the above pie diagram , sources v area under irrgation is shown . Then ground water percentage is..
 Solution in Telugu
0.4
0.45
0.43
0.48
Step by step video & image solution for In the above pie diagram , sources v area under irrgation is shown . Then ground water percentage is.. by Biology experts to help you in doubts & scoring excellent marks in Class 10 exams.
Updated on:21/07/2023Topper's Solved these Questions
- NATURAL RESOURCESBOOK - VGS PUBLICATION-BRILLIANTCHAPTER - NATURAL RESOURCESEXERCISE - CREATIVE QUESTIONS FOR NEW MODEL PAPER (4 MARK QUESTIONS)
23 Videos
- MOSQUITOESS WOESBOOK - VGS PUBLICATION-BRILLIANTCHAPTER - MOSQUITOESS WOESEXERCISE - EXERCISE
3 Videos
- NATURE IS A SACRED PLACEBOOK - VGS PUBLICATION-BRILLIANTCHAPTER - NATURE IS A SACRED PLACEEXERCISE - Fill in the blanks
14 Videos
Similar Questions
Forests are renewable resource. Write four sentences supporting this. (OR)
"Forest is a renewable resource". Do you agree ? Justify.
View SolutionWhich of the following disease is caused by mosquito bite?
View SolutionWe believe in…………
View SolutionThe following table shows the percentage of vehicles passing a signal. Find out the measures of the central angles to show the information by a pie diagram. Hence draw the pie diagram.

View SolutionArea under different crops in a certain village is given below. Represent it by pie diagram:

View SolutionArea under different crops in a certain village is given below. Represent it by a pie diagram:

View SolutionThe percentage of expenditure on different heads in a budget of a state is as shown below :

Draw a pie diagram to represent the information .
View SolutionArea under different crops n a certain village is given below : Represent, it by a pie diagram:

View SolutionArea under different crops n a certain village is given below : Represent, it by a pie diagram:

View SolutionWhat is the percentage of water in the ground ?
View SolutionDraw a pie diagram to show the water sources and area under irrigation in our state.
View SolutionDraw a pie diagram showing percentage consumption of some resources in India.
View SolutionWhat percentage of the land area is irrigated by other water sources?
View SolutionStudy the table give below and draw the given diagrams/ maps.
Area and Production of Rice in Major States.

a. Construct a multiple bar diagram to show area under rice in each state.
b. Construct a pie diagram to show the percentage of area under rice in each state.
c. Construct a dot map to show the production of rice in each state.
d. Construct a Choropleth map to show the percentage of production of rice in states.
View Solution55মিটার লম্বা বাঁশের 11 মিটার কাদা ও জলের নীচে আছে। বাঁশটির শতকরা কত কাদা ও জলের উপরে আছে?
View SolutionCarefully observe the given diagram/chart and answer the questions based on it.
(1) Observe the following pie-chart showing the major sources of energy.

Refer to the pie-chart above and arrange the sources of energy in an ascending order.
View Solution
