Find out the correct diagrammatic representation of organismic response w.r.t. Regulators
The correct Answer is:C
To solve the question regarding the correct diagrammatic representation of organismic response with respect to regulators, we need to understand the concept of regulators and how they maintain homeostasis.
1. Understand Regulators: Regulators are organisms that maintain a stable internal environment (homeostasis) despite changes in external conditions. This includes thermoregulation (temperature control) and osmoregulation (pH and water balance).
2. Identify Homeostasis: In regulators, the internal conditions remain constant even when the external environment varies significantly. For example, humans maintain an internal body temperature of approximately 37 degrees Celsius regardless of external temperatures ranging from freezing to very hot.
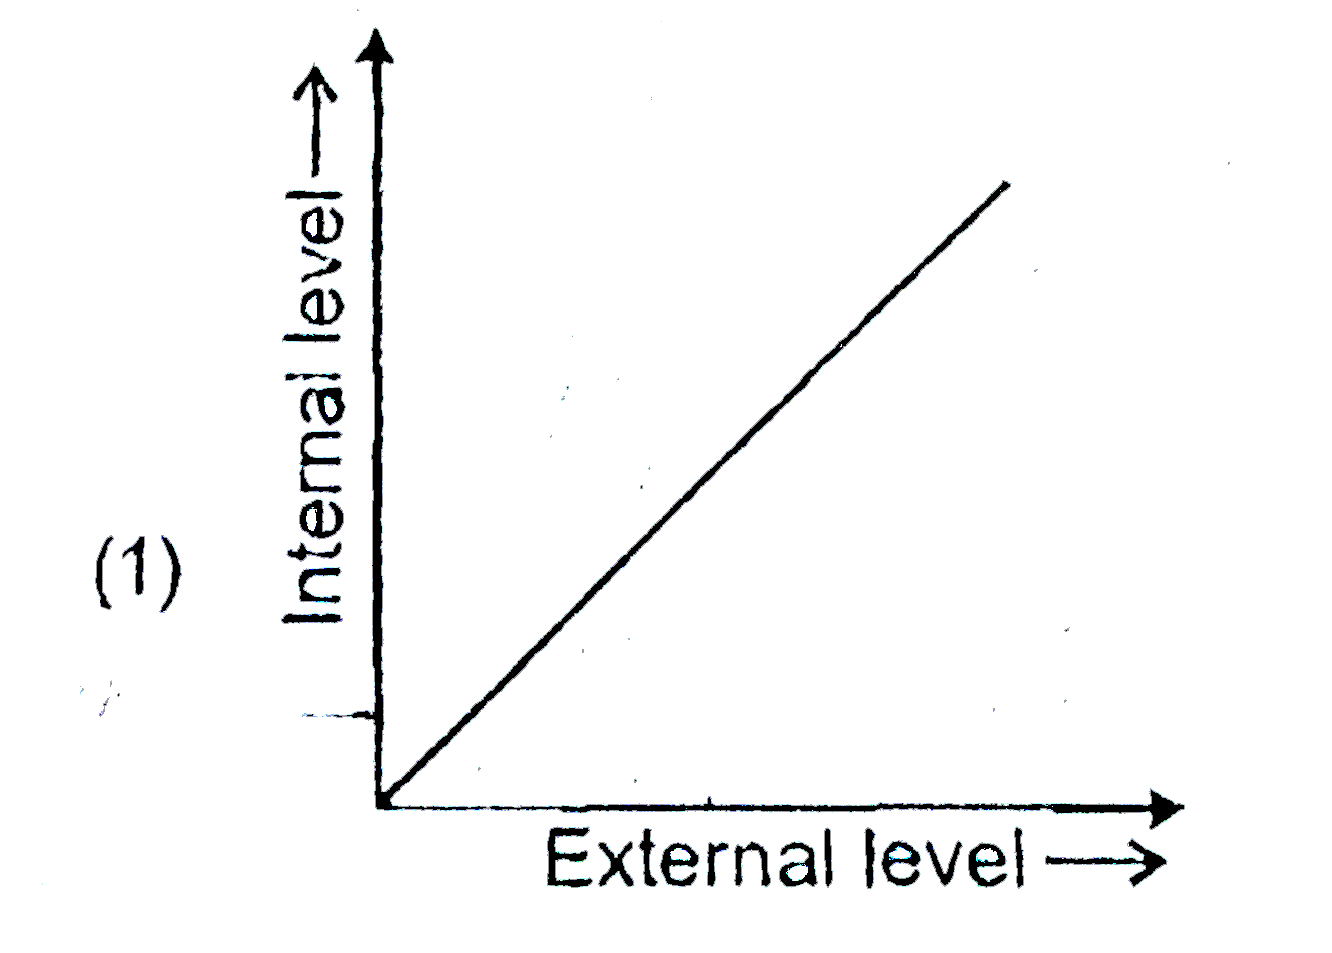
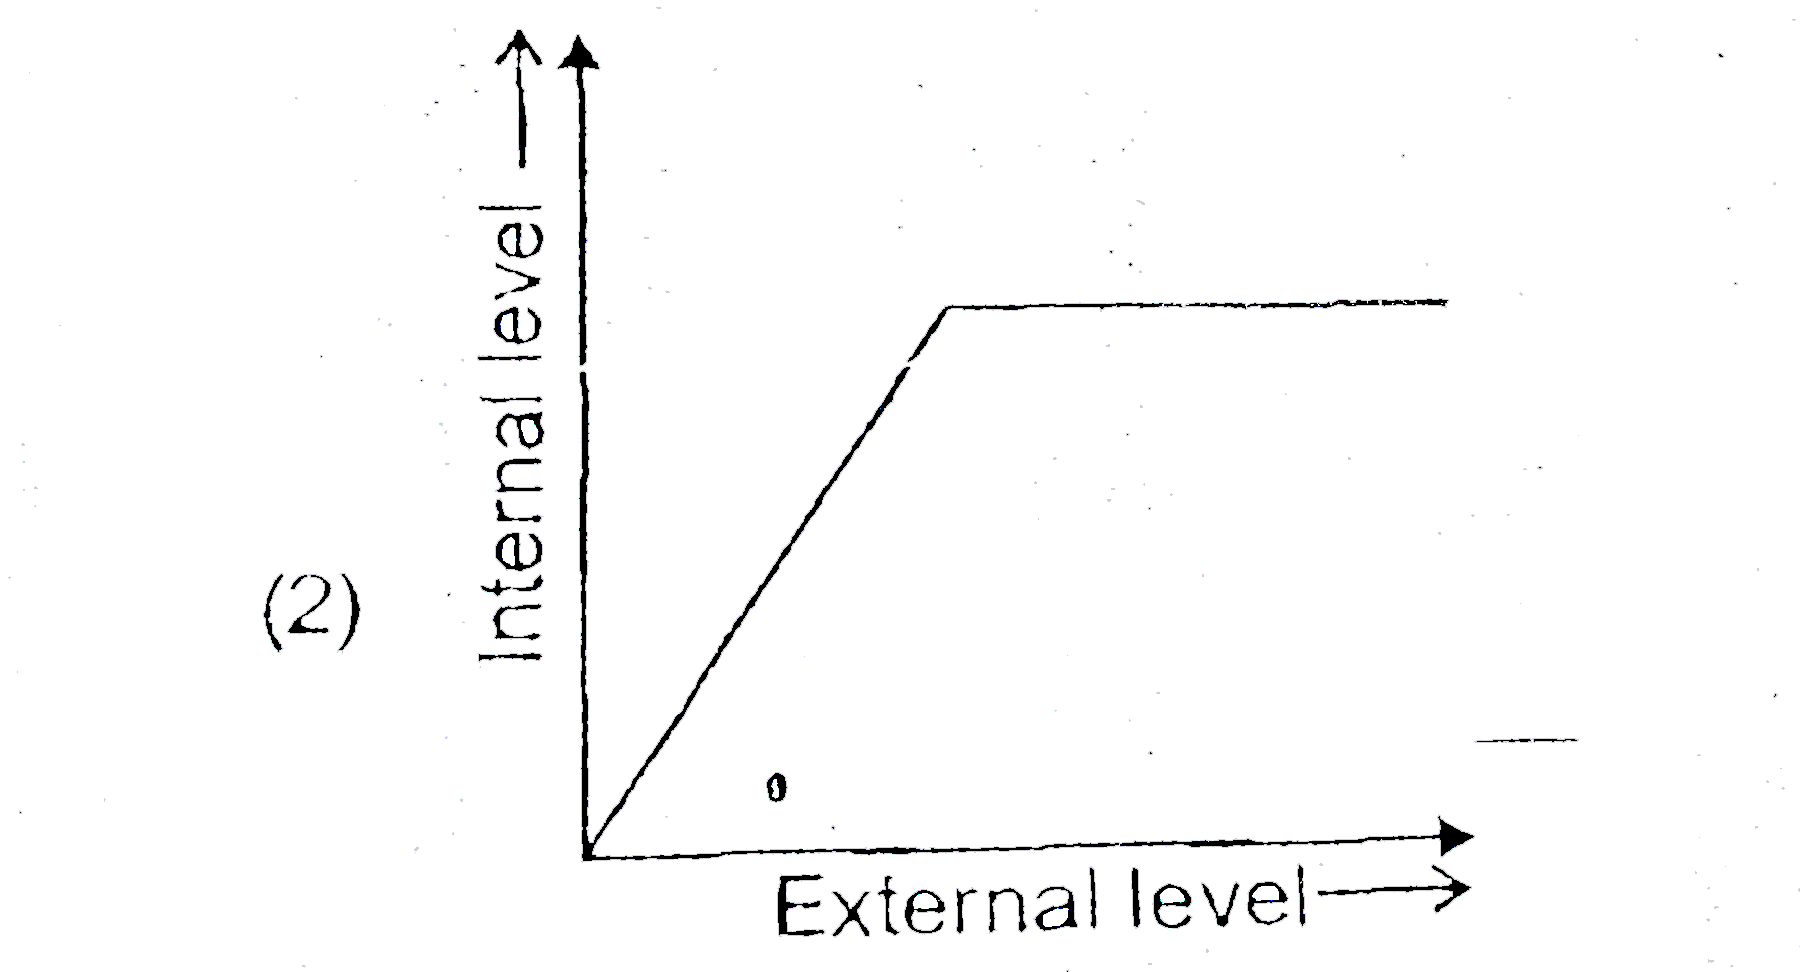
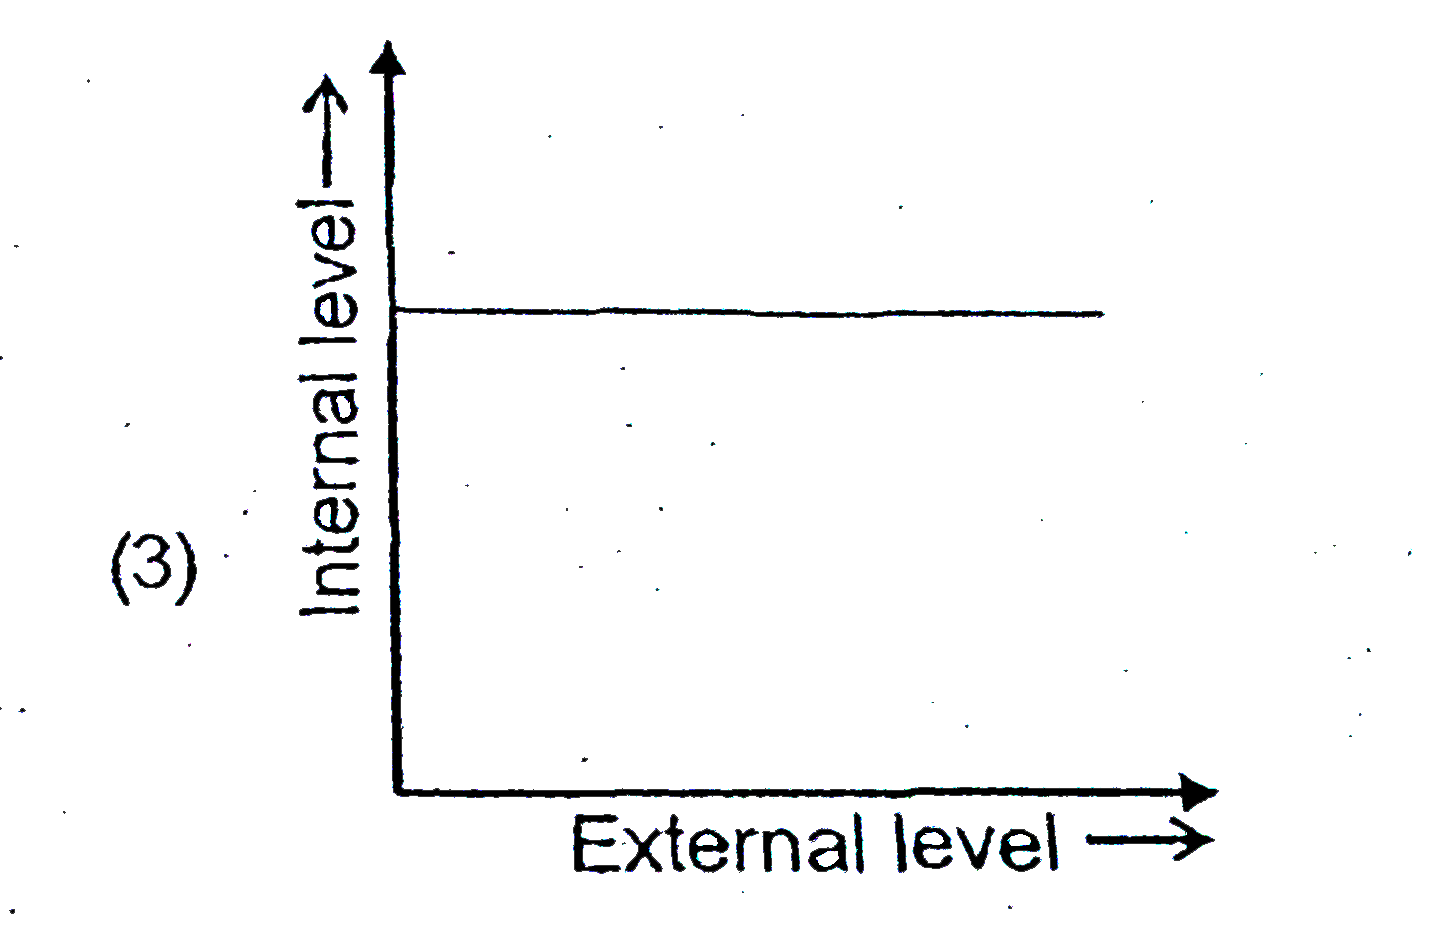
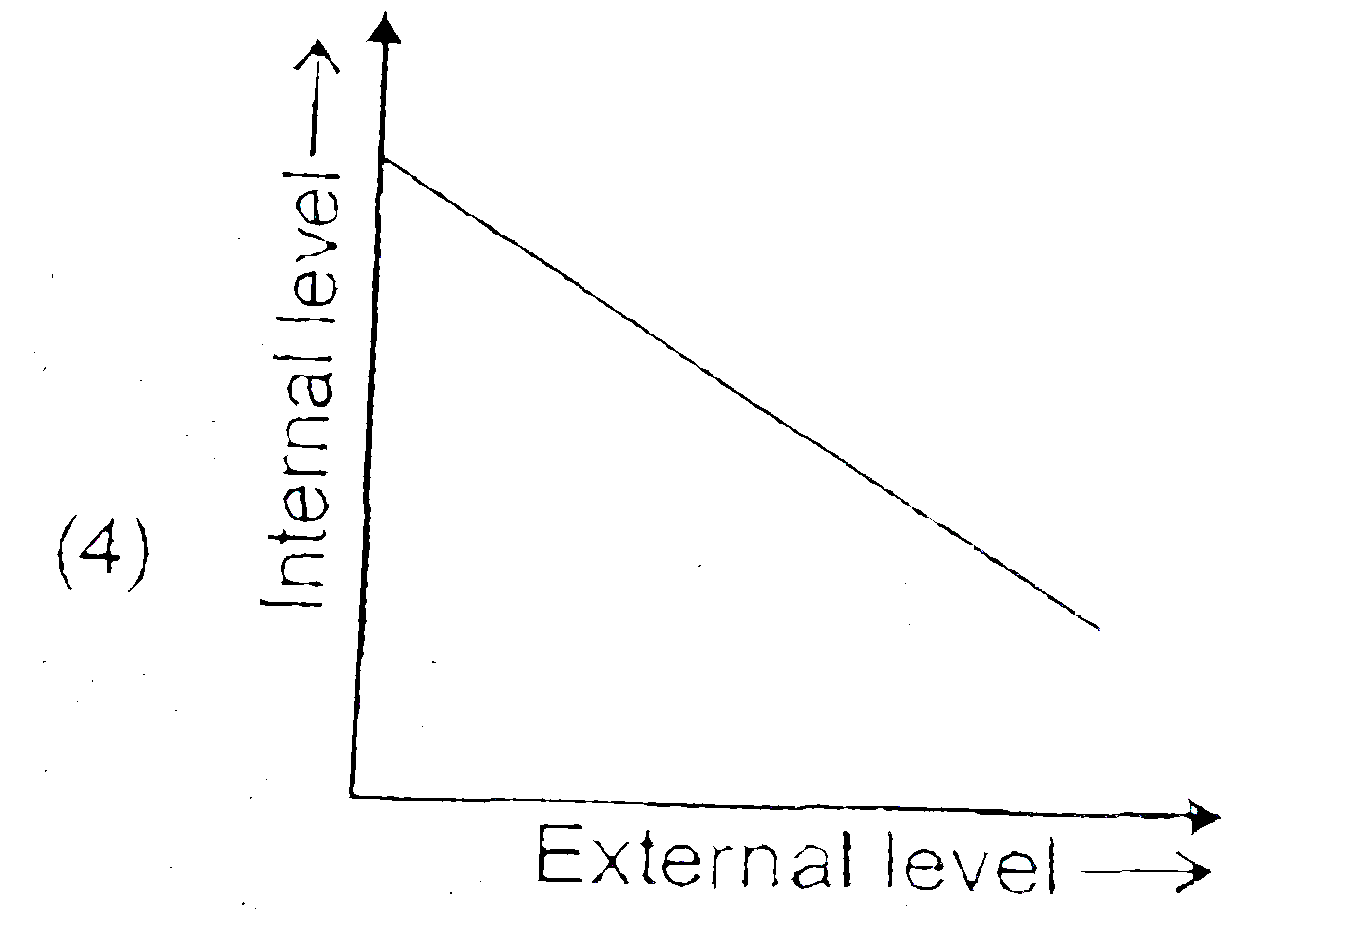
3. Analyze the Graphs: The question provides multiple graphs representing different types of organism responses:
- Graph 1: Represents conformers, which cannot regulate their internal conditions and their internal levels change directly with external levels.
- Graph 2: Represents partial regulators, which initially change their internal levels in response to external changes but then stabilize after a certain point.
- Graph 3: Represents true regulators, where the internal level remains constant regardless of external changes.
4. Select the Correct Graph: Based on the understanding of regulators, the third graph (Graph 3) accurately depicts the behavior of regulators, where the internal environment remains stable despite fluctuations in the external environment.
5. Conclusion: Therefore, the correct diagrammatic representation of organismic response with respect to regulators is option number 3.
- Graph 1: Represents conformers, which cannot regulate their internal conditions and their internal levels change directly with external levels.
- Graph 2: Represents partial regulators, which initially change their internal levels in response to external changes but then stabilize after a certain point.
- Graph 3: Represents true regulators, where the internal level remains constant regardless of external changes.
Topper's Solved these Questions
- ORGANISMS AND POPULATIONS BOOK - AAKASH INSTITUTE ENGLISHCHAPTER - ORGANISMS AND POPULATIONS EXERCISE - ASSIGNMENT (SECTION-A) (Objective Type Questions)
35 Videos
- ORGANISMS AND POPULATIONS BOOK - AAKASH INSTITUTE ENGLISHCHAPTER - ORGANISMS AND POPULATIONS EXERCISE - ASSIGNMENT (SECTION-B) (Objective Type Questions)
35 Videos
- ORGANISMS AND POPULATIONS BOOK - AAKASH INSTITUTE ENGLISHCHAPTER - ORGANISMS AND POPULATIONS EXERCISE - Try Yourself
16 Videos
- NEURAL CONTROL AND COORDINATION BOOK - AAKASH INSTITUTE ENGLISHCHAPTER - NEURAL CONTROL AND COORDINATION EXERCISE - Assignment SECTION - D (Assertion-Reason Type Questions )
10 Videos
- PHOTOSYNTHESIS IN HIGHER PLANTS BOOK - AAKASH INSTITUTE ENGLISHCHAPTER - PHOTOSYNTHESIS IN HIGHER PLANTS EXERCISE - Assignment(section D)
10 Videos
Similar Questions
Knowledge Check
Find out correct representation of triplet carbene :
A B
B C
C DNone of these
Find out correct representation of single carbene :
A B
B CBoth (a) and (b)DNone of these
Find the incorrect match w.r.t seed
View SolutionFind out the incorrect statement w.r.t. frog-
View SolutionFind out the incorrect statement w.r.t. frog-
View SolutionFind out the one out w.r.t parasitic plants:
View SolutionFind out the incorrect statement w.r.t. digestive organs in humans
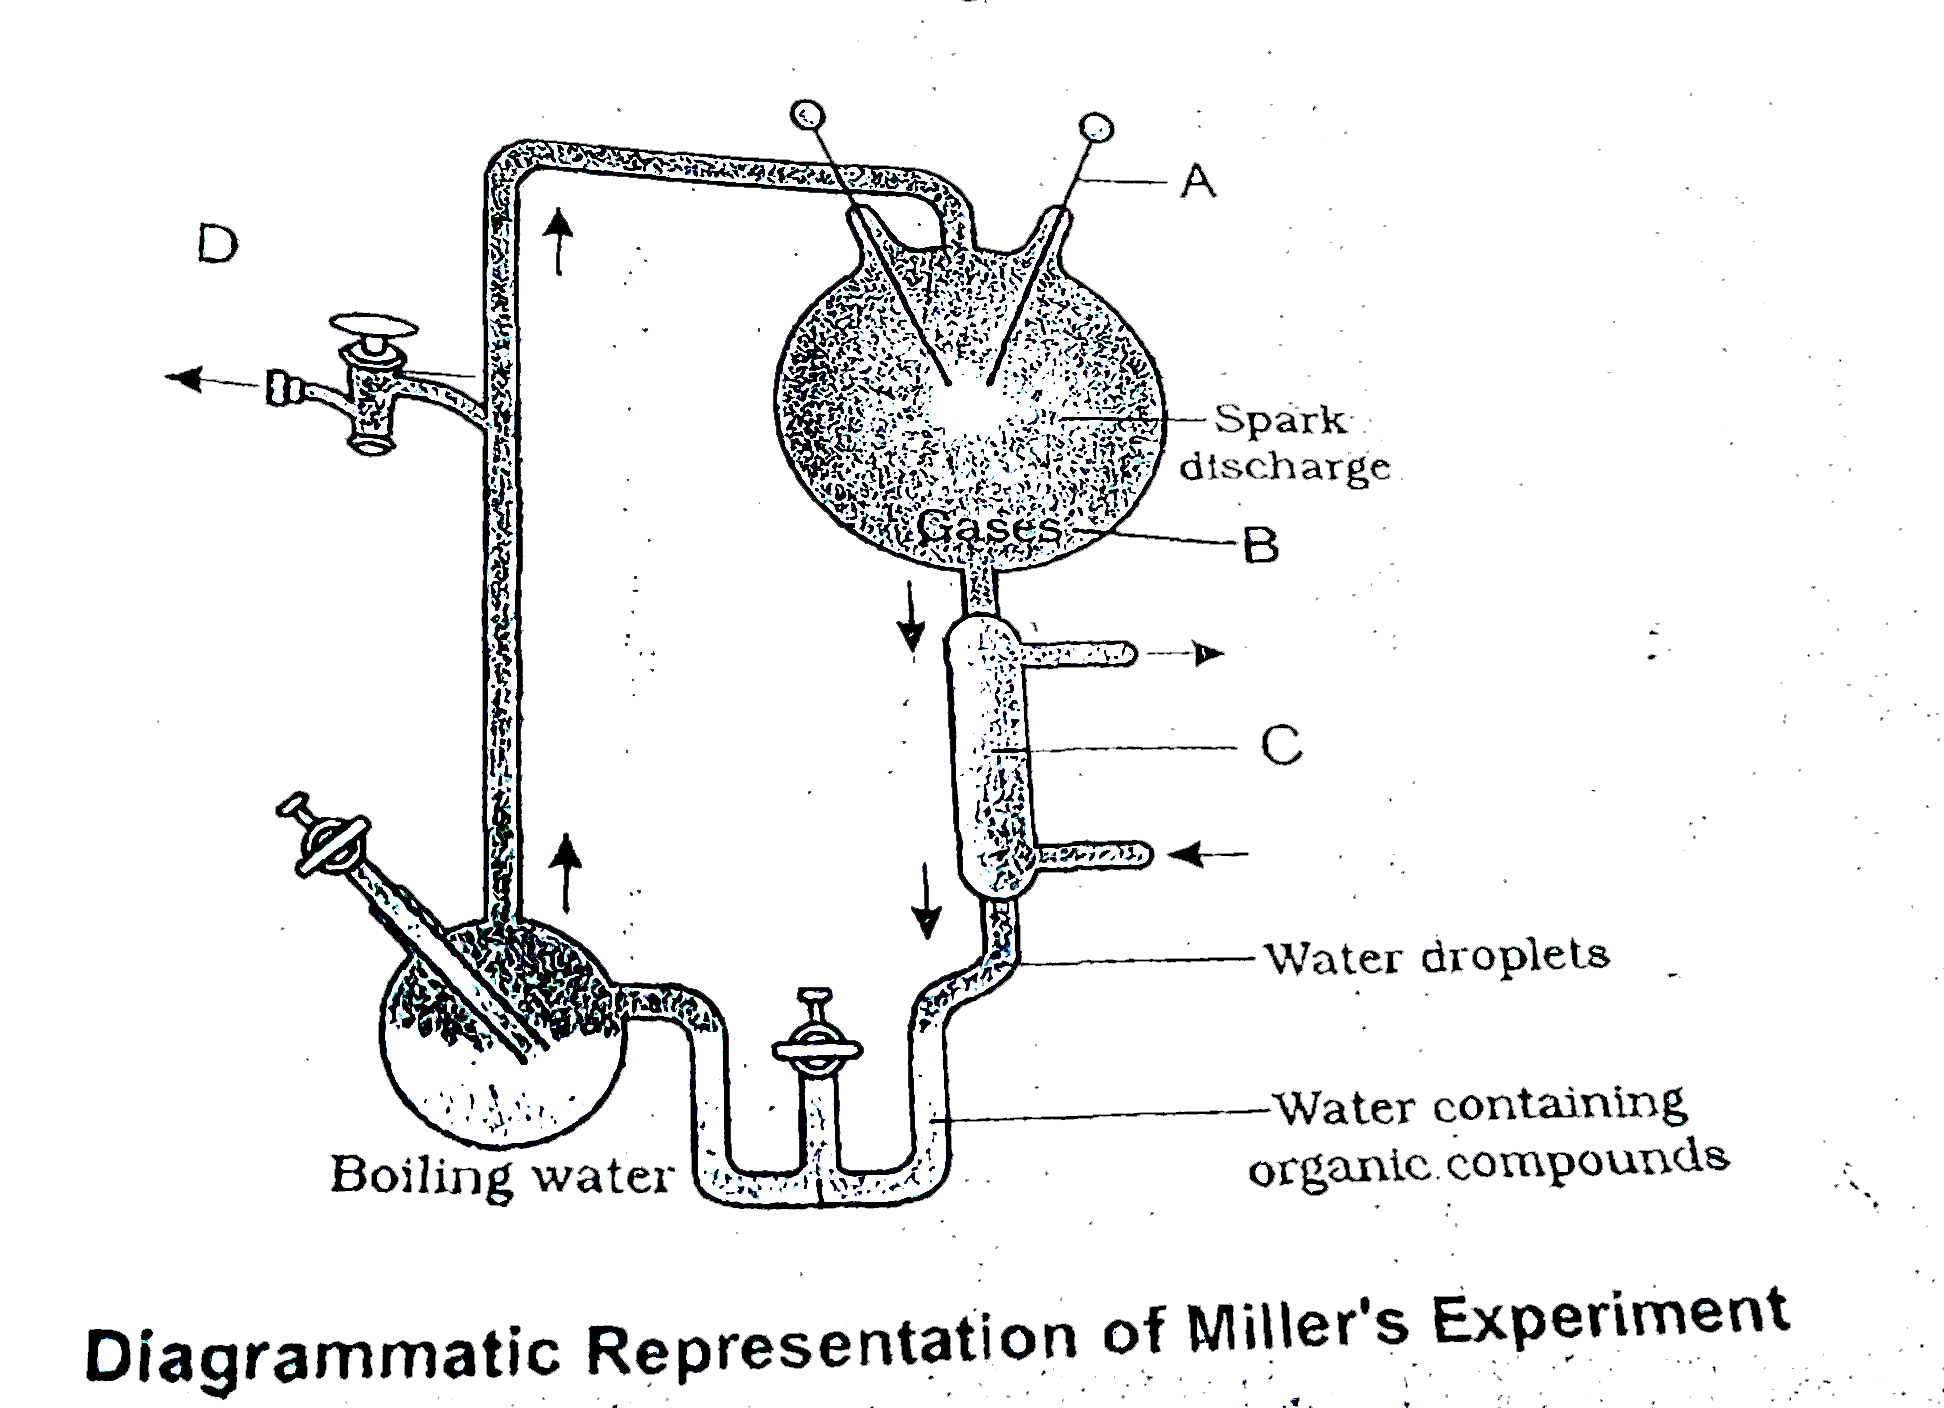
View SolutionFollowing is the diagrammatic representation of Miller's experiment. What is correct labelling? Choose the correct option.
View Solution
