The correct graph regarding v vs KE. ( Incident)
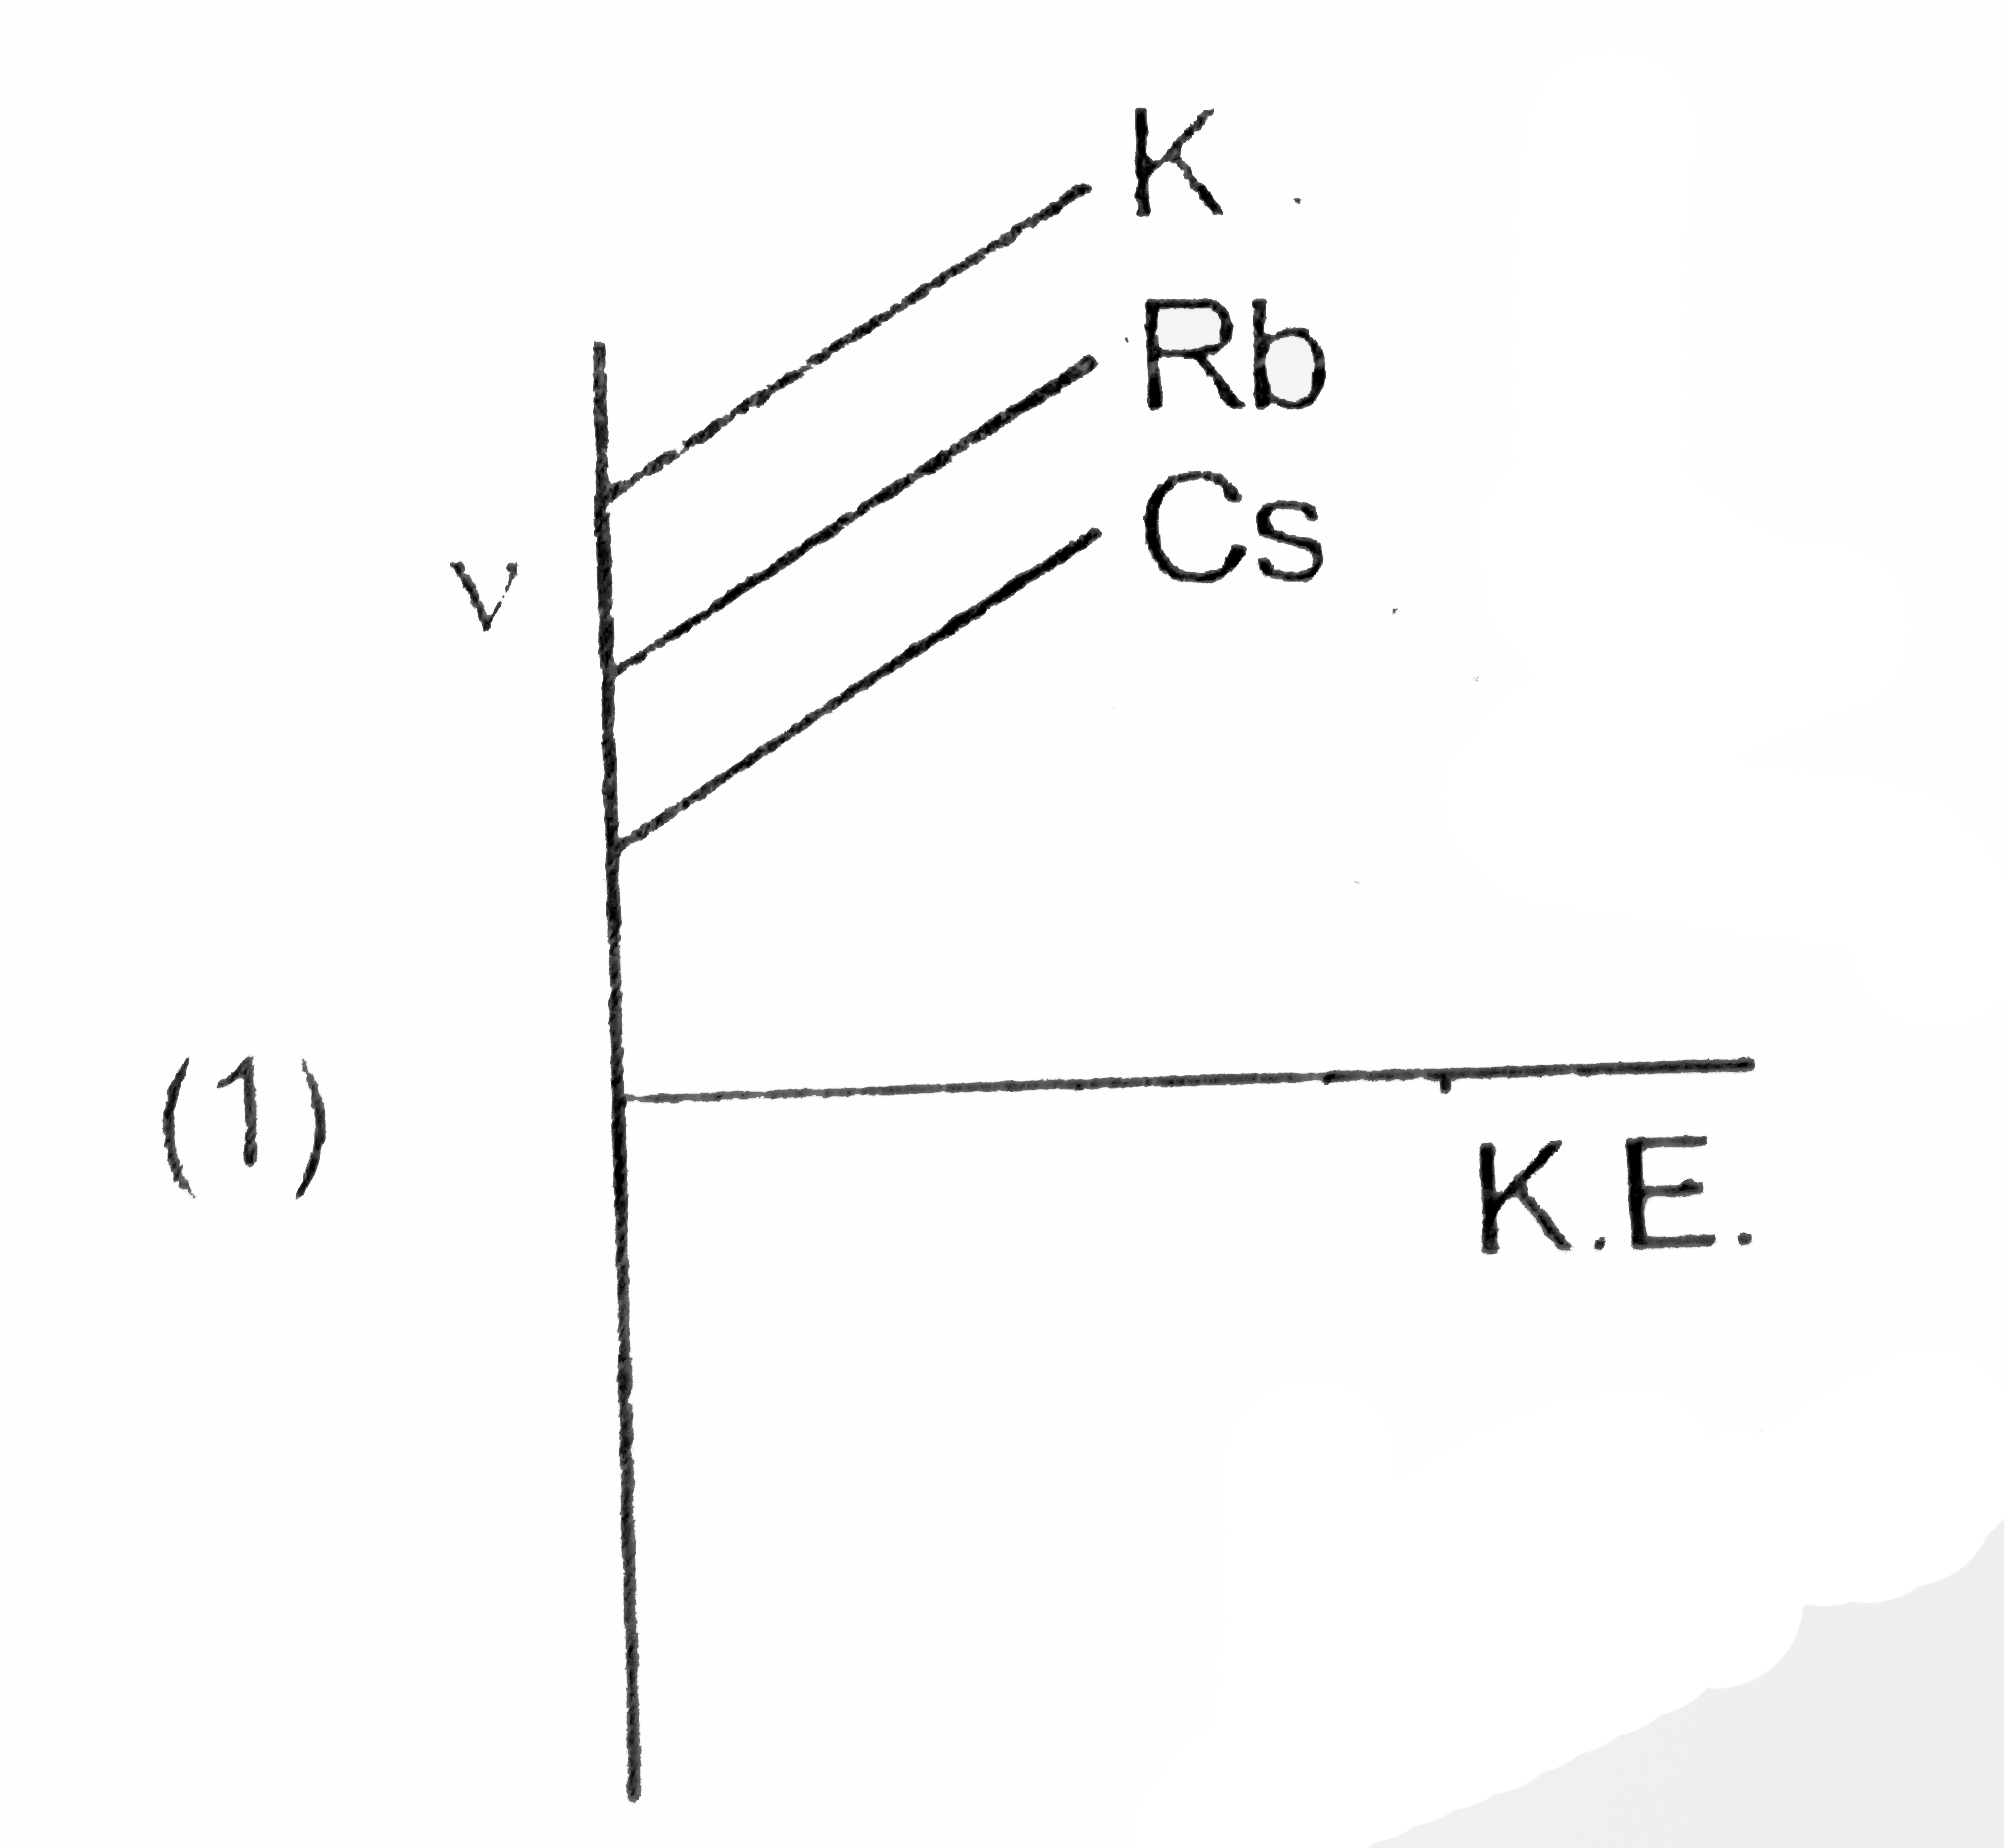
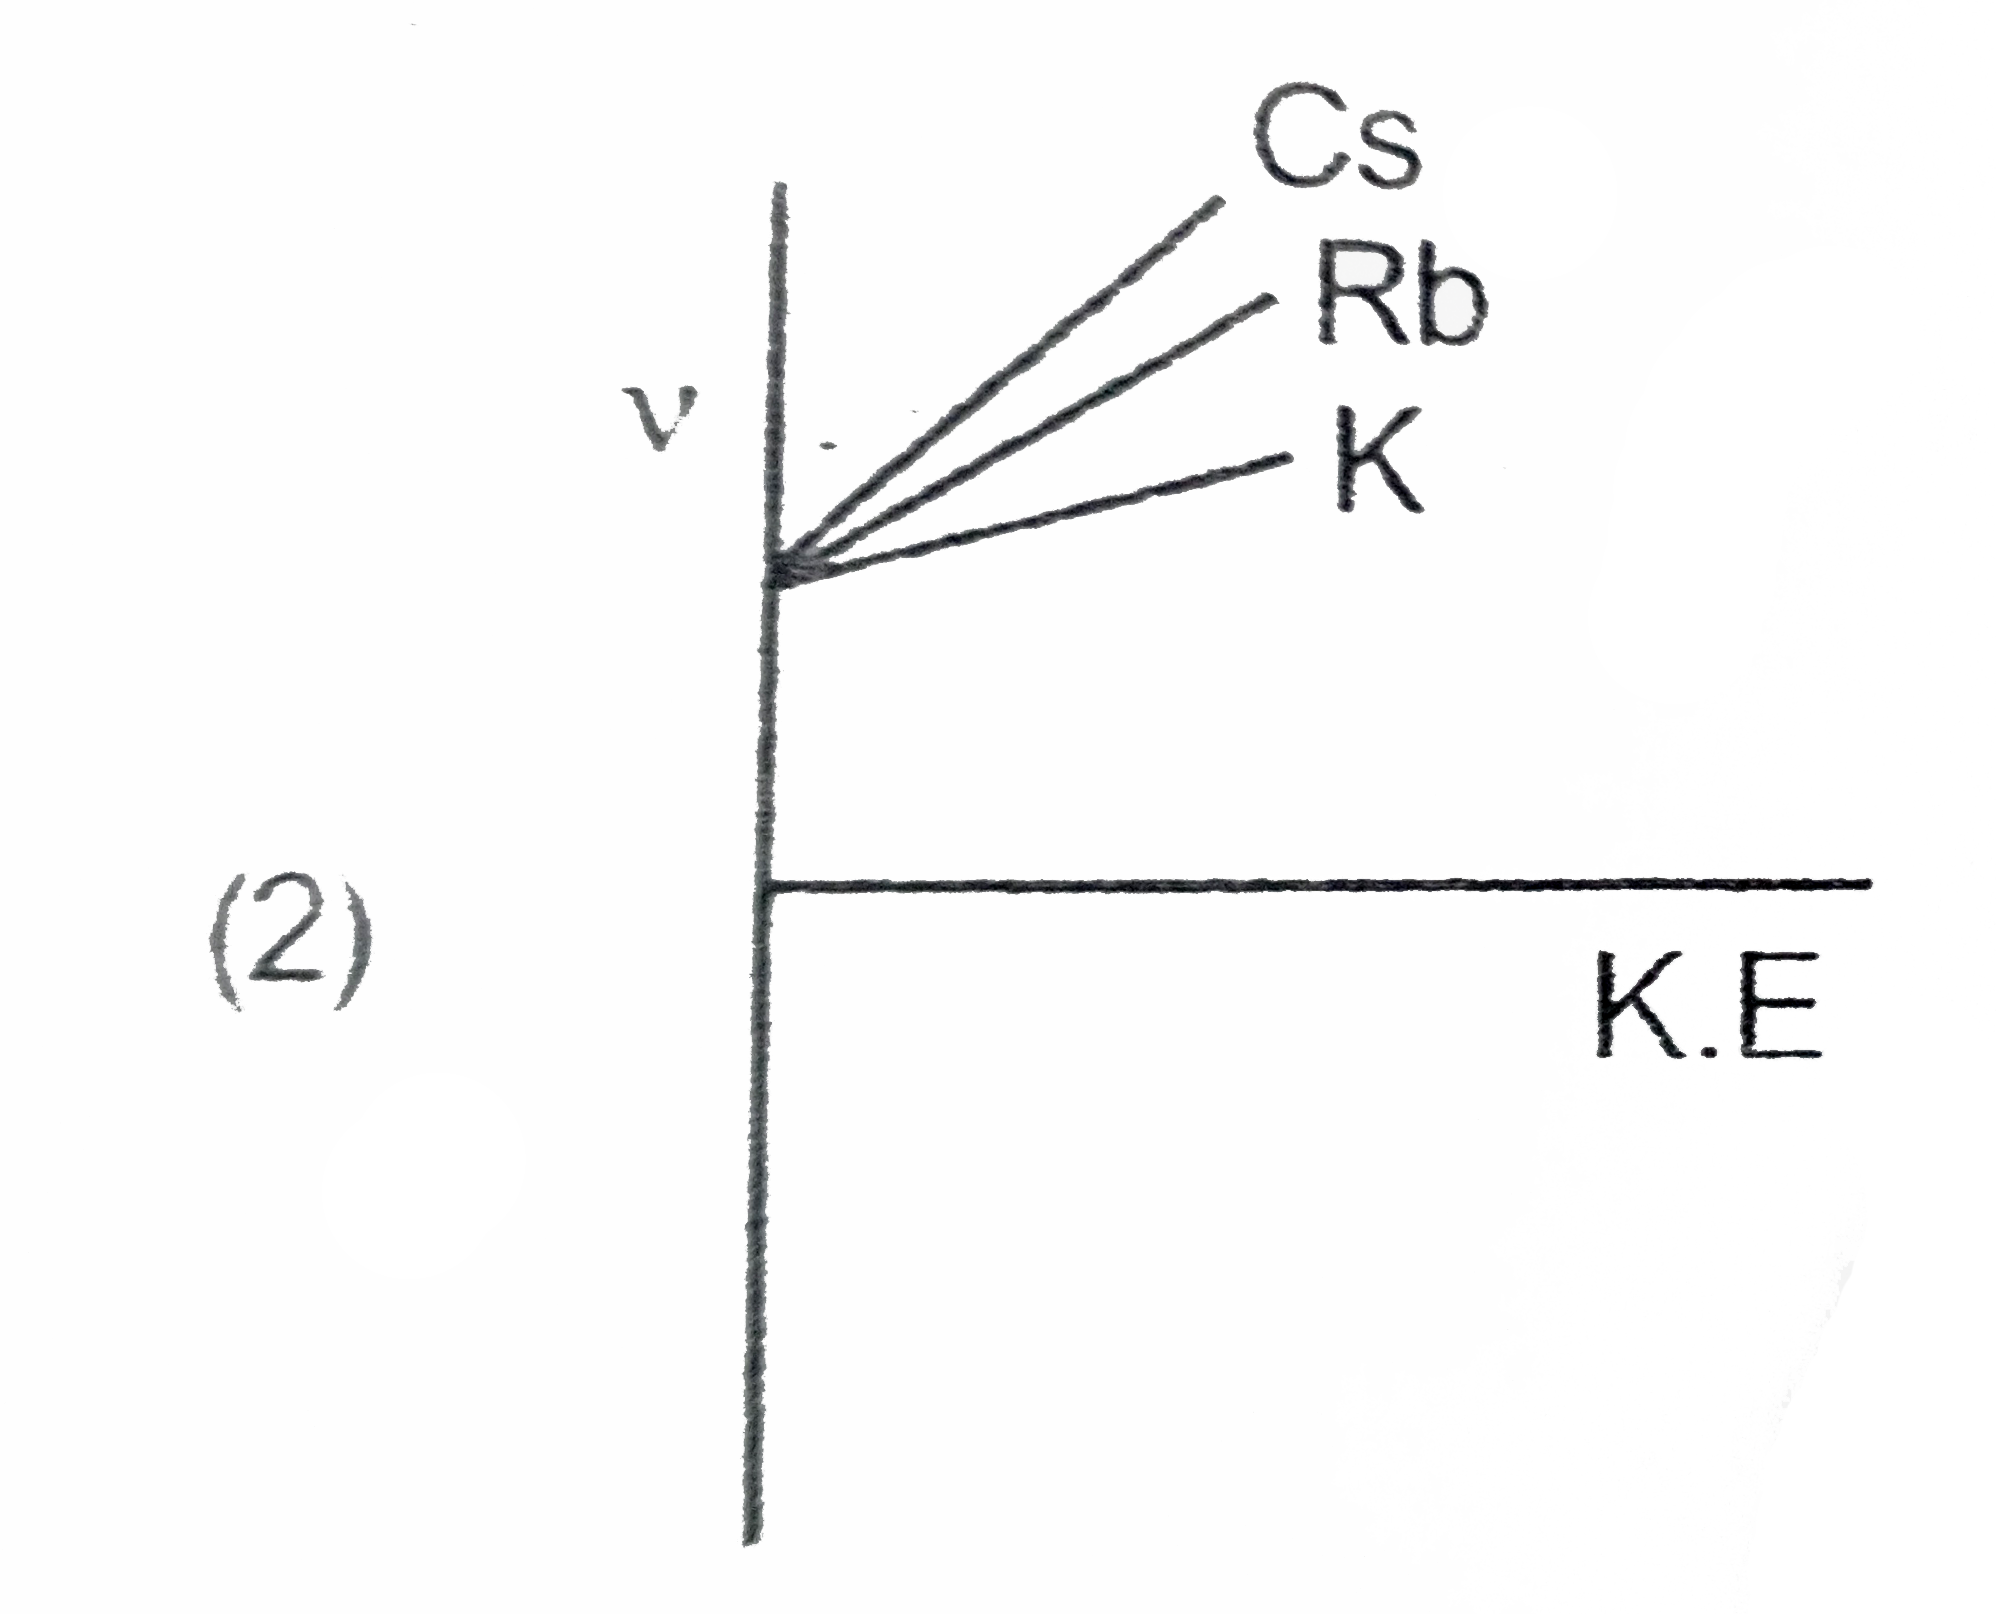
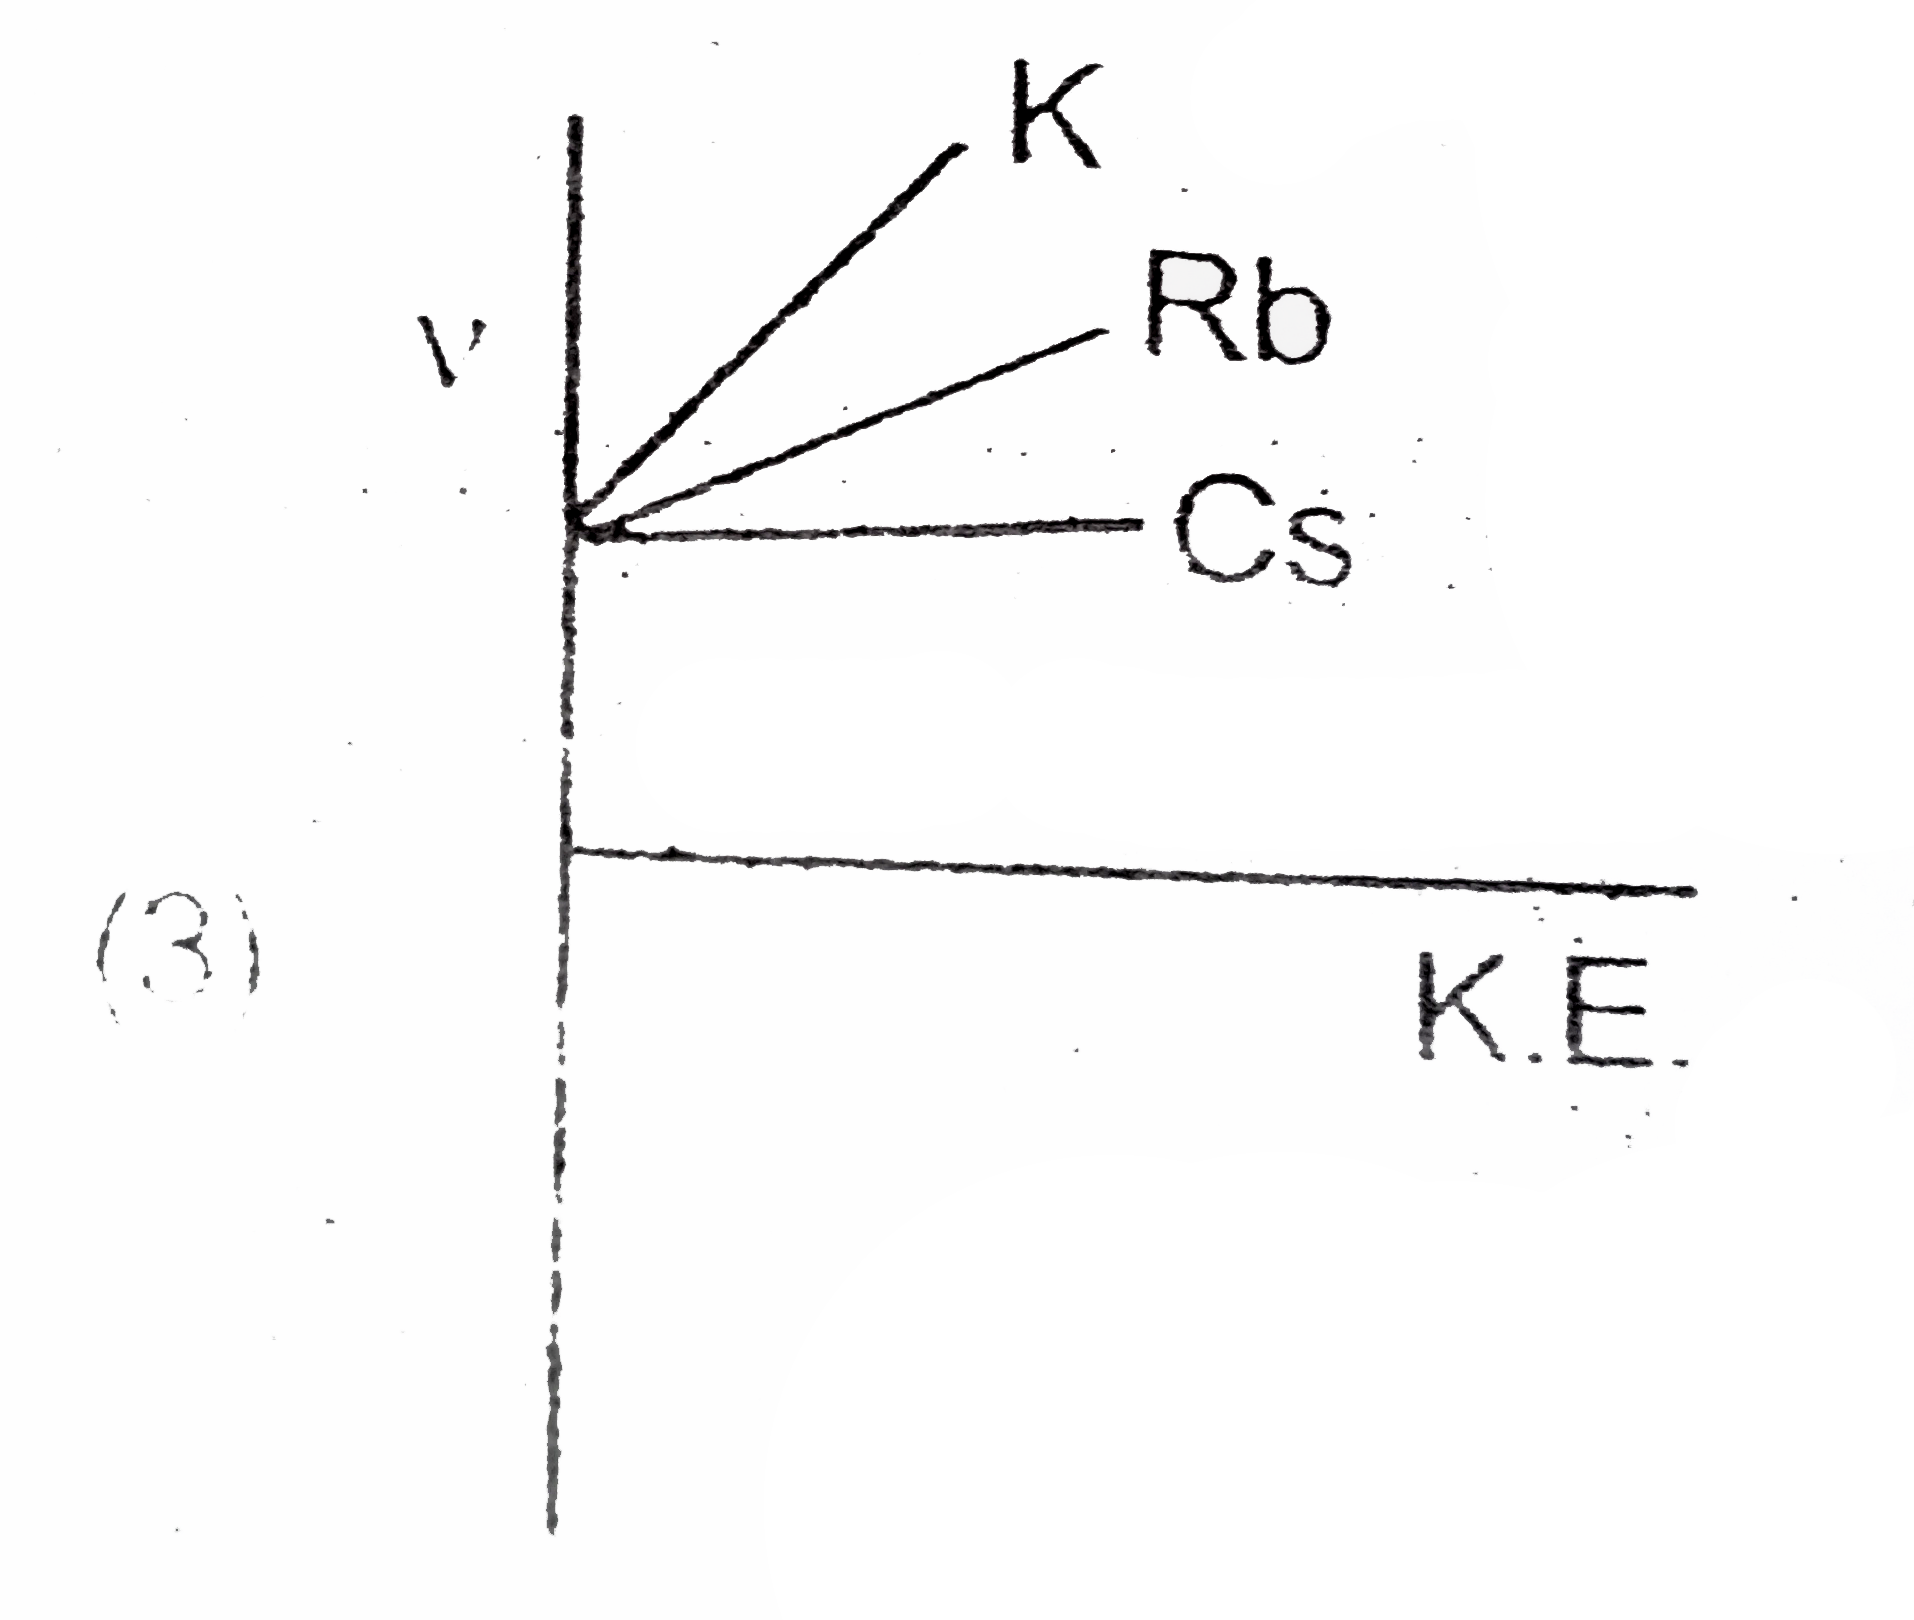
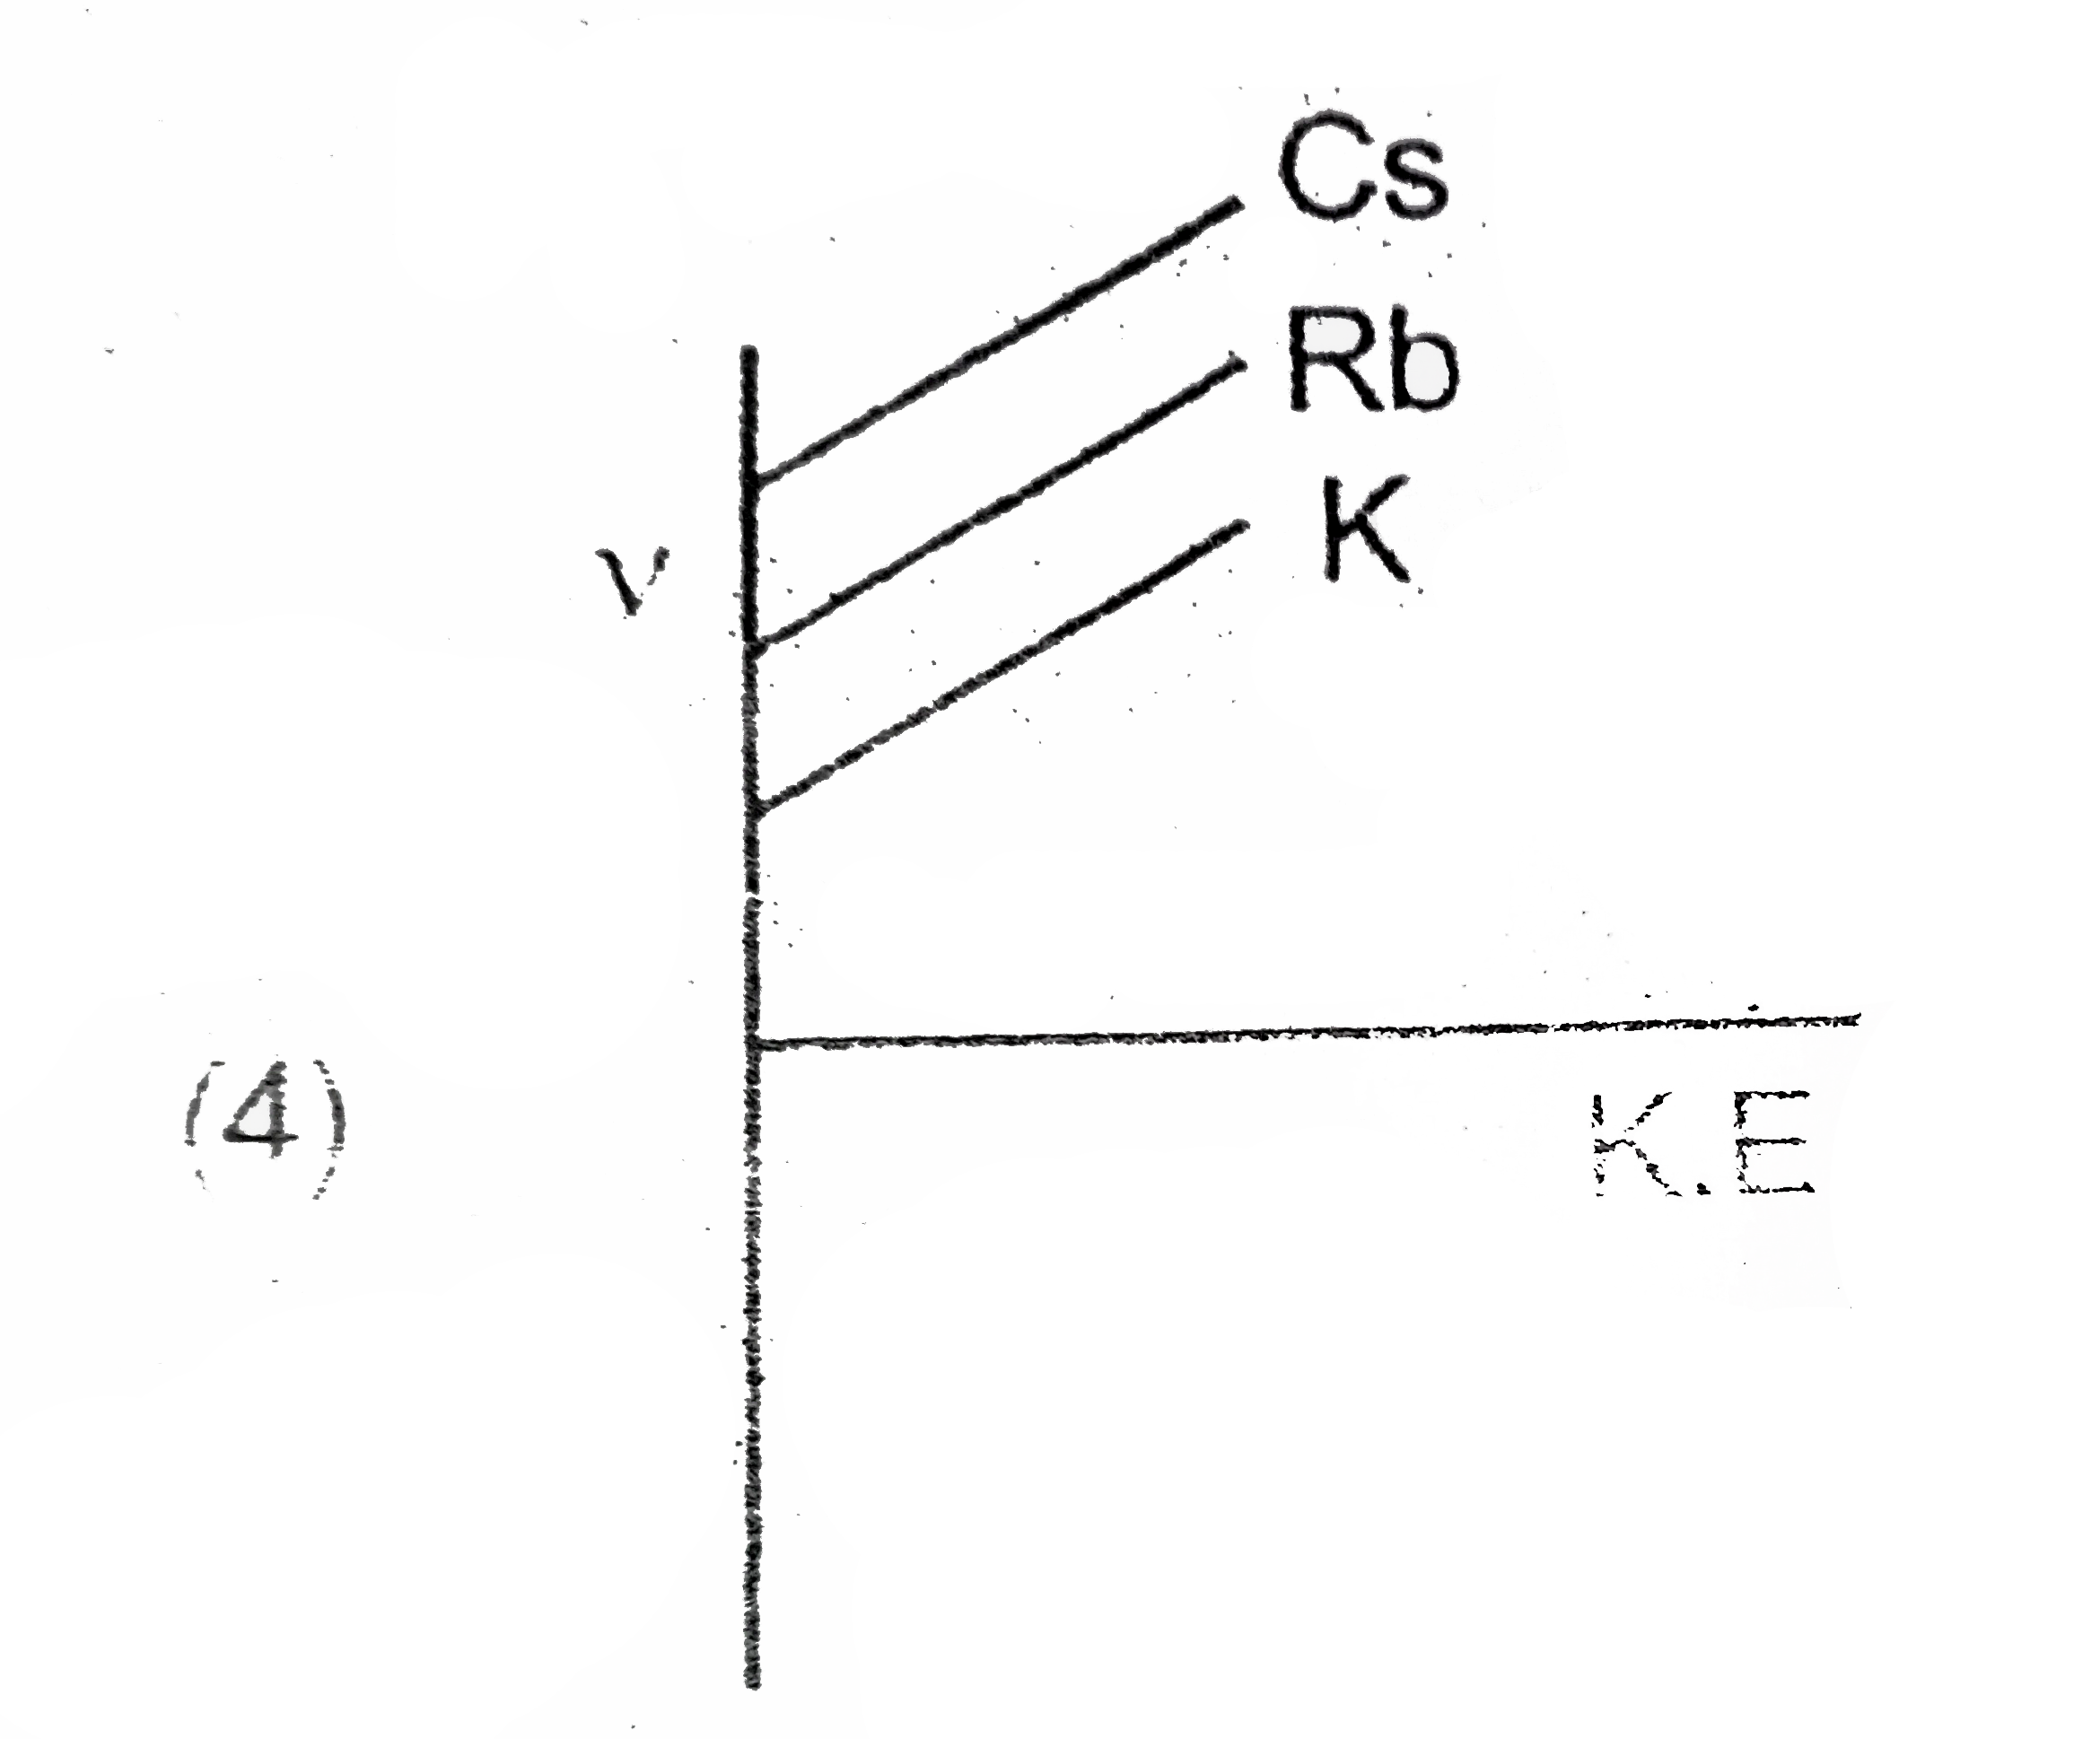
The correct Answer is:1
To solve the question regarding the correct graph for frequency (ν) versus kinetic energy (KE) in the context of the photoelectric effect for different first group metals (potassium, rubidium, cesium), we can follow these steps:
Step 1: Understand the Photoelectric Effect
The photoelectric effect describes how electrons are emitted from a material when it is exposed to light of sufficient frequency. The energy of the incident photons is given by the equation:
E=hν
where E is the energy of the photon, h is Planck's constant, and ν is the frequency of the light.
Step 2: Define Threshold Frequency
Each metal has a specific threshold frequency (ν₀), which is the minimum frequency required to eject an electron from the surface of the metal. The relationship can be expressed as:
KE=hν−W
where KE is the kinetic energy of the emitted electron, and W is the work function (the minimum energy required to remove an electron).
Step 3: Analyze the Metals
For the first group metals:
- Potassium (K)
- Rubidium (Rb)
- Cesium (Cs)
Cesium has the largest atomic size and thus the lowest ionization energy, which means it will have the lowest threshold frequency (ν₀). Potassium will have a higher threshold frequency than cesium, and rubidium will be in between.
Step 4: Determine the Graph Characteristics
At the threshold frequency (ν₀), the kinetic energy (KE) is zero because the energy of the incoming photon is just enough to overcome the work function. As the frequency increases beyond the threshold frequency, the kinetic energy of the emitted electrons increases linearly.
Step 5: Identify the Correct Graph
The correct graph will show:
- A linear relationship between frequency (ν) and kinetic energy (KE).
- The x-intercept (where KE = 0) will be at different threshold frequencies for each metal:
- Cesium (lowest ν₀)
- Rubidium (intermediate ν₀)
- Potassium (highest ν₀)
Thus, the graph should indicate that cesium has the lowest threshold frequency, followed by rubidium and then potassium.
Conclusion
The correct graph is the one that shows the threshold frequencies for cesium, rubidium, and potassium in increasing order of frequency, with the kinetic energy increasing linearly as frequency increases.
---
The photoelectric effect describes how electrons are emitted from a material when it is exposed to light of sufficient frequency. The energy of the incident photons is given by the equation:
E=hν
where E is the energy of the photon, h is Planck's constant, and ν is the frequency of the light.
Each metal has a specific threshold frequency (ν₀), which is the minimum frequency required to eject an electron from the surface of the metal. The relationship can be expressed as:
KE=hν−W
where KE is the kinetic energy of the emitted electron, and W is the work function (the minimum energy required to remove an electron).
For the first group metals:
- Potassium (K)
- Rubidium (Rb)
- Cesium (Cs)
At the threshold frequency (ν₀), the kinetic energy (KE) is zero because the energy of the incoming photon is just enough to overcome the work function. As the frequency increases beyond the threshold frequency, the kinetic energy of the emitted electrons increases linearly.
The correct graph will show:
- A linear relationship between frequency (ν) and kinetic energy (KE).
- The x-intercept (where KE = 0) will be at different threshold frequencies for each metal:
- Cesium (lowest ν₀)
- Rubidium (intermediate ν₀)
- Potassium (highest ν₀)
The correct graph is the one that shows the threshold frequencies for cesium, rubidium, and potassium in increasing order of frequency, with the kinetic energy increasing linearly as frequency increases.
Topper's Solved these Questions
- STRUCTURE OF ATOM BOOK - AAKASH INSTITUTE ENGLISHCHAPTER - STRUCTURE OF ATOM EXERCISE - ASSIGNMENT ( SECTION -I) Subjective Type Questions
7 Videos
- STRUCTURE OF ATOMBOOK - AAKASH INSTITUTE ENGLISHCHAPTER - STRUCTURE OF ATOMEXERCISE - ASSIGNMENT (SECTION -D) Assertion-Reason Type Questions
15 Videos
- SURFACE CHEMISTRY BOOK - AAKASH INSTITUTE ENGLISHCHAPTER - SURFACE CHEMISTRY EXERCISE - Assignment Section - C (Assertion - Reason type questions)
10 Videos
Similar Questions
Knowledge Check

Which of these is correct regarding D, E and F areas in the graph ?AD shows venous blood in exercise.BE shows normal venous bloodCF shows normal arterial blood.DAll of these
Which of these is incorrect regarding A and B in the given graph ?AA is deoxygenated blood leaving the tissues.BB is reduced blood returning from tissues.CA is oxygenated blood leaving the lungs.DB is deoxygenated blood in the systemic veins.In a photoelectric experiment, the graph of frequency v of incident light (in Hz) and stopping potential V (in V) is as shown in the figure. Planck's constant is (e is the elementary charge)
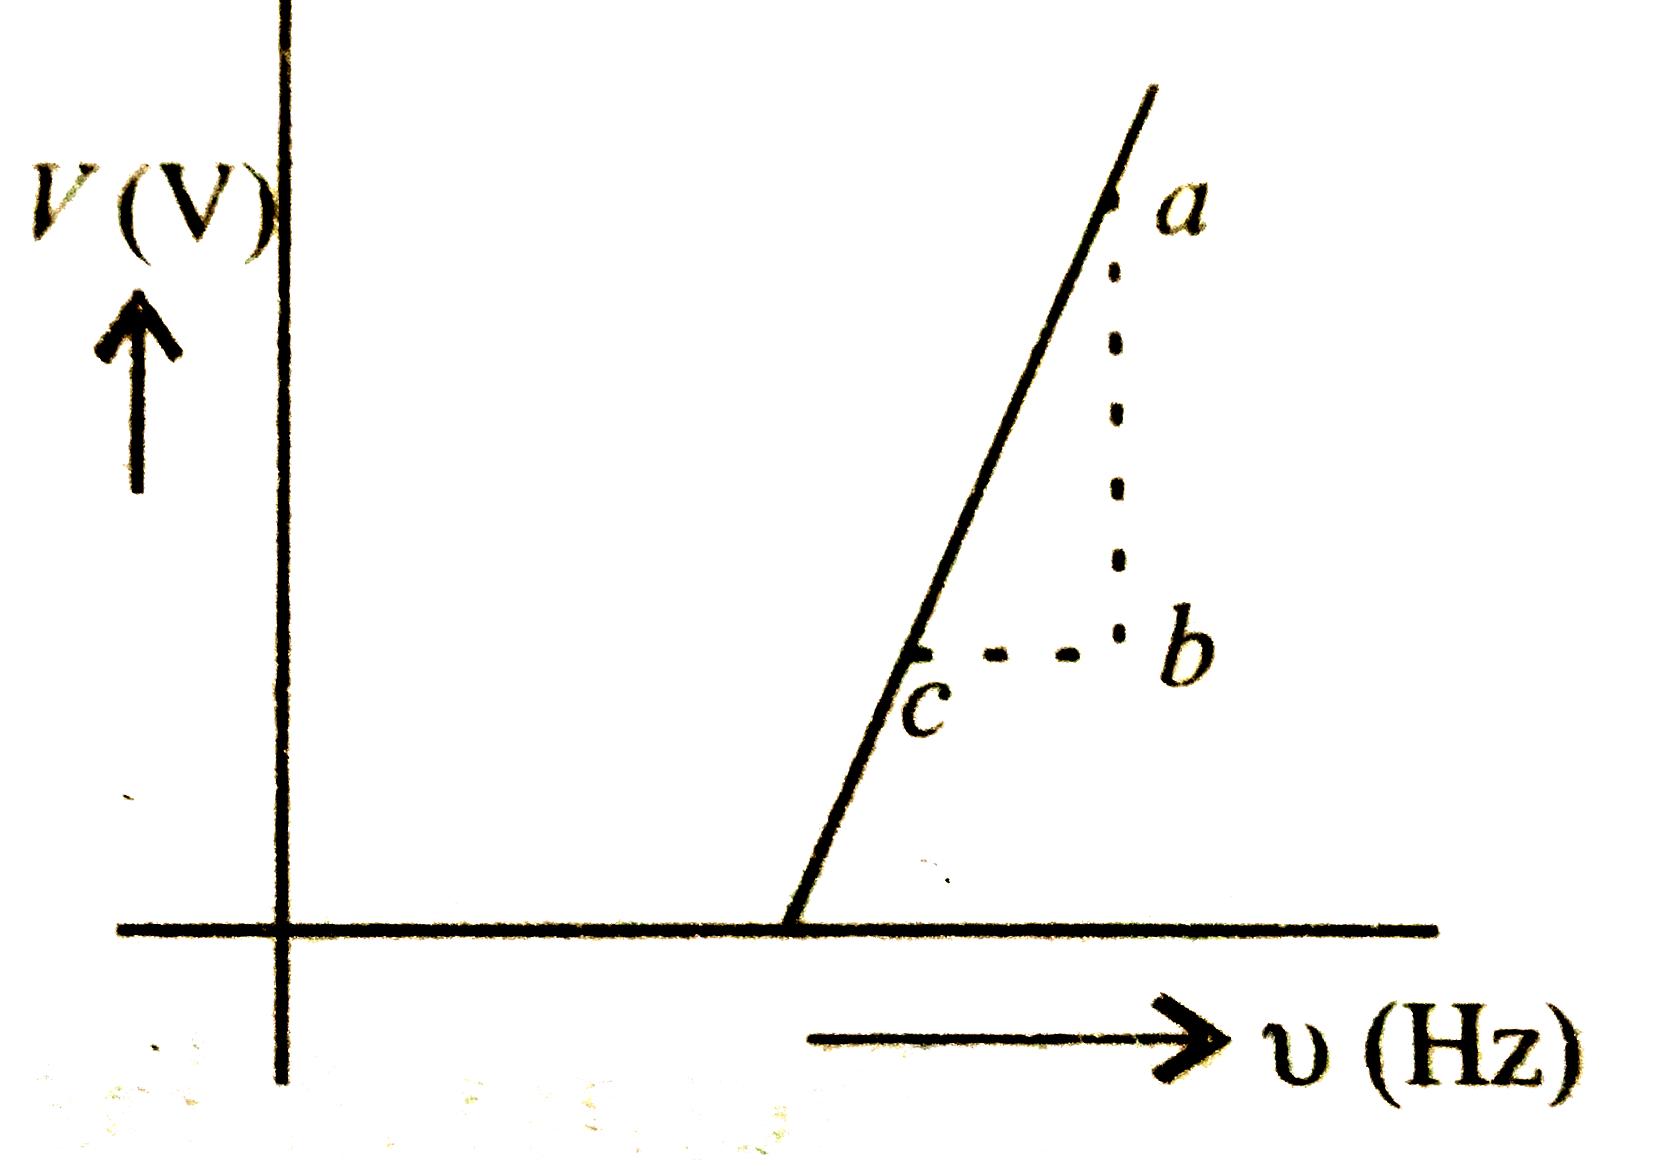 AeabbcBecbacCeacbcDeacab
The correct graph respectivley the relation between energy (E) of photoelectrons and frequency v of incident light is
View SolutionSelect the incorrect graph for velocity of e− in an orbit vs. Z, 1n and n :
View SolutionWhich of the following is/are correct regarding root mean square speed (Urms) & average translation K.E. (Eav) of molecules in a gas at equilibrium
View Solution
Using the graph shown in the figure for stopping potential vs. the incident frequency of photons, calculate Planck.s constant.
View Solution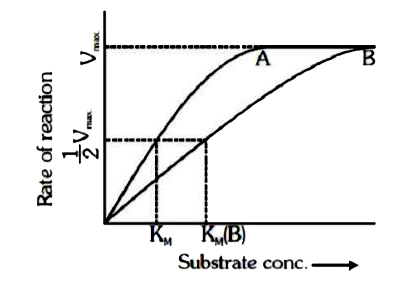
Study above the given graph and find out the correct statement regarding this :-
View Solution
