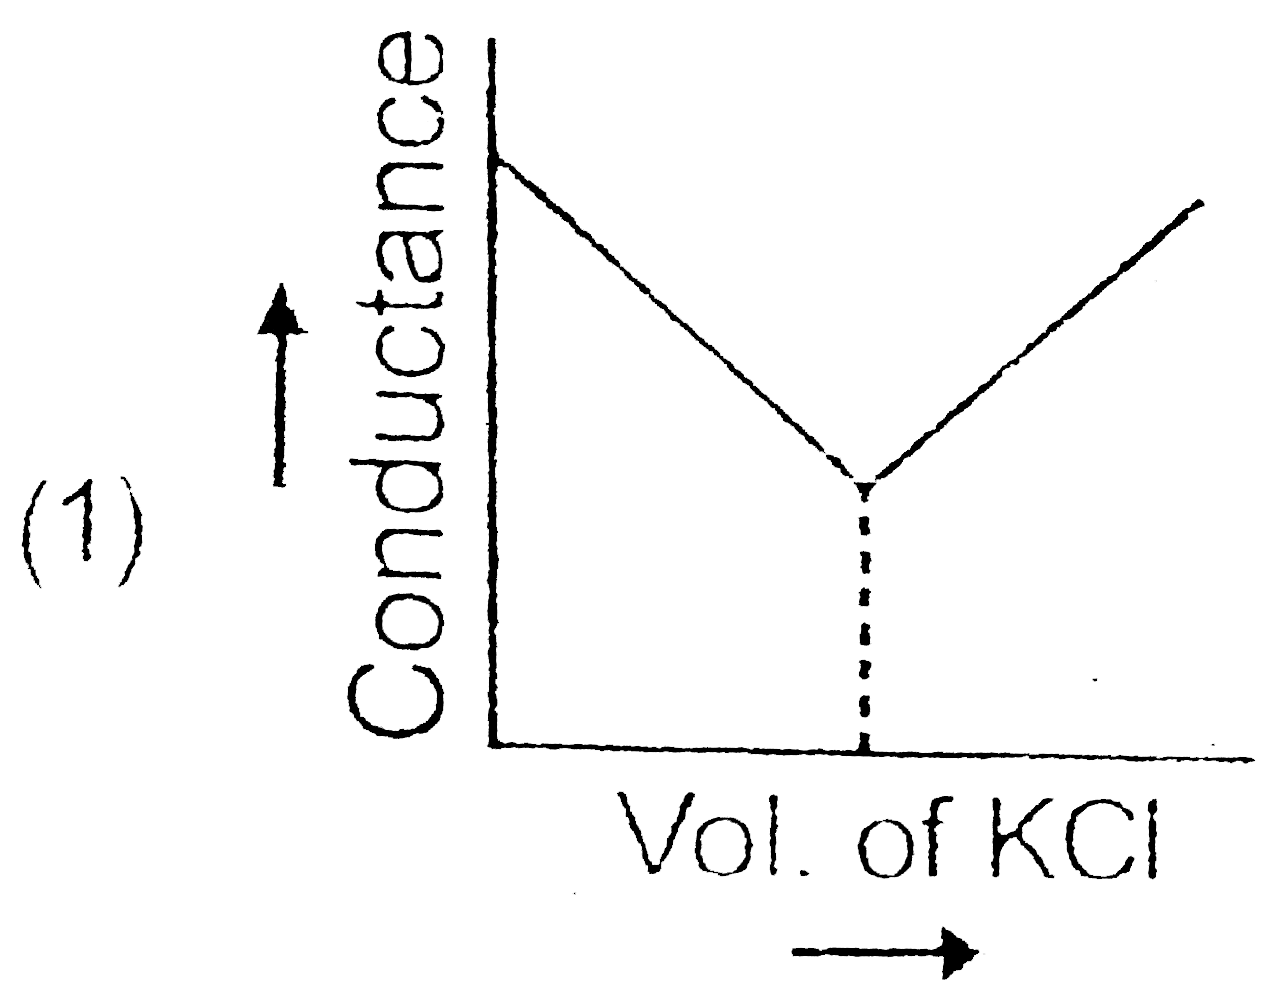
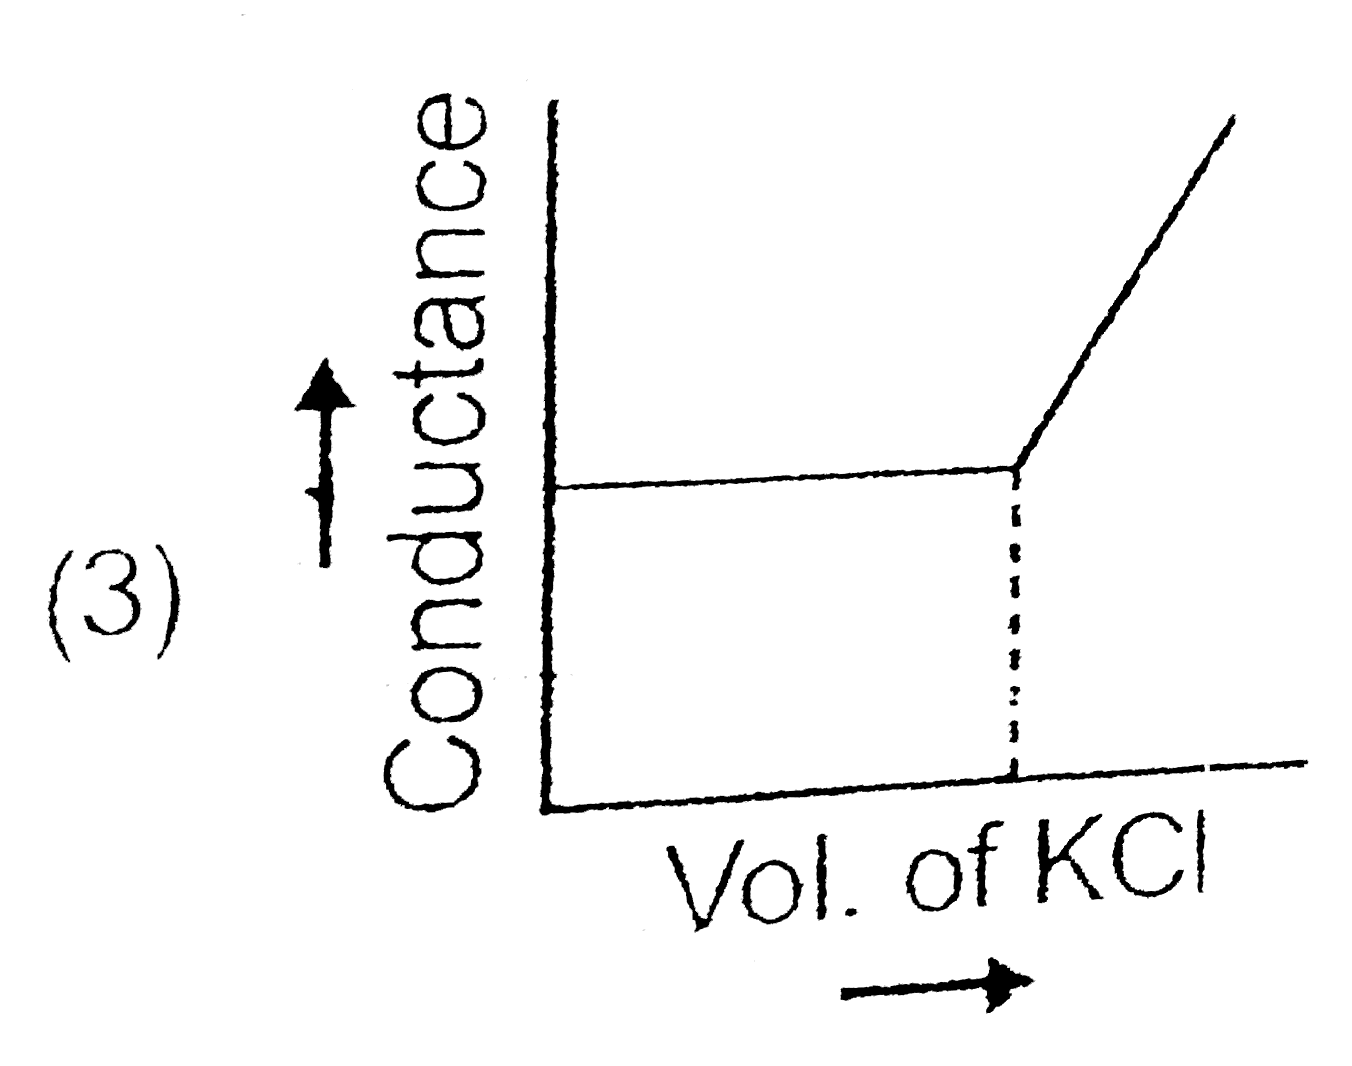
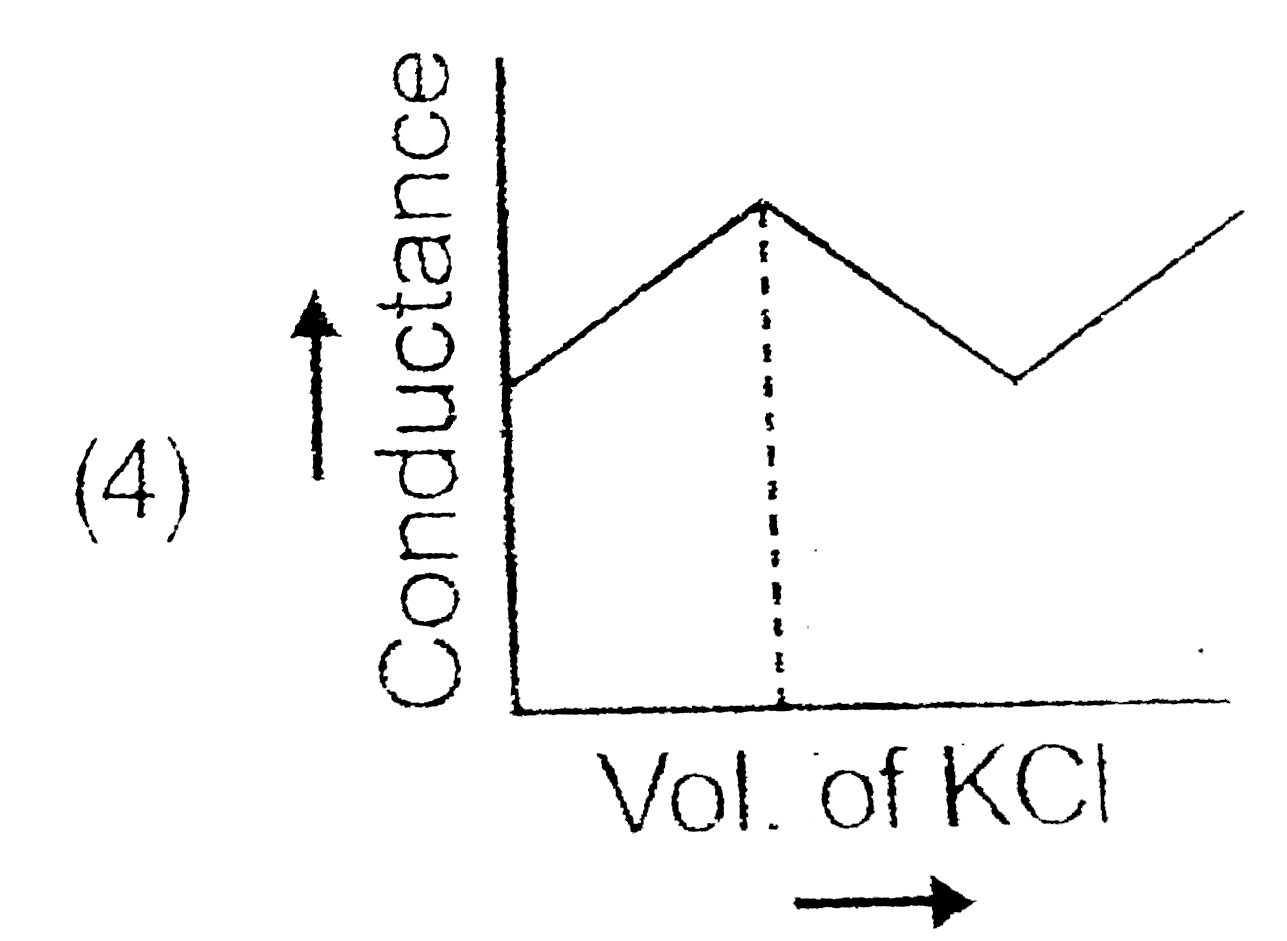
Which of following type of plot would you expect from the titratin of AgNO3 against KCI solution?


To determine the type of plot expected from the titration of AgNO₃ against KCl solution, we can follow these steps:
Step 1: Understand the Reaction
When KCl is added to AgNO₃ solution, a precipitation reaction occurs. The silver ions (Ag⁺) from AgNO₃ react with chloride ions (Cl⁻) from KCl to form solid silver chloride (AgCl), which precipitates out of the solution.
Hint: Remember that precipitation reactions often lead to a change in the concentration of ions in solution.
Step 2: Analyze Conductance Changes
Initially, the solution contains Ag⁺ and NO₃⁻ ions. As KCl is added, Ag⁺ ions are replaced by K⁺ ions, but since AgCl is precipitating, the overall number of ions in solution does not significantly change until the equivalence point is reached.
Hint: Conductance is related to the number of free ions in solution; consider how precipitation affects this.
Step 3: Identify the Equivalence Point
At the equivalence point, all Ag⁺ ions have reacted with Cl⁻ ions to form AgCl. Beyond this point, any additional KCl will increase the concentration of K⁺ and Cl⁻ ions in the solution, leading to an increase in conductance.
Hint: The equivalence point is where the reactants are completely consumed; think about what happens to the ions after this point.
Step 4: Plotting Conductance vs. Volume of KCl
The plot of conductance against the volume of KCl will show a relatively flat line up to the equivalence point, indicating little change in conductance as Ag⁺ ions are replaced by K⁺ ions. After the equivalence point, the conductance will rise sharply due to the increase in K⁺ and Cl⁻ ions.
Hint: Look for a plot that shows a gradual increase followed by a sharp rise after the equivalence point.
Conclusion
The expected plot for the titration of AgNO₃ against KCl will show a gradual increase in conductance until the equivalence point, followed by a steep increase after the equivalence point due to the addition of excess KCl.
Final Answer
The correct type of plot for the titration of AgNO₃ against KCl is a graph that shows a gradual increase in conductance up to the equivalence point, followed by a sharp increase after the equivalence point.
---
When KCl is added to AgNO₃ solution, a precipitation reaction occurs. The silver ions (Ag⁺) from AgNO₃ react with chloride ions (Cl⁻) from KCl to form solid silver chloride (AgCl), which precipitates out of the solution.
Initially, the solution contains Ag⁺ and NO₃⁻ ions. As KCl is added, Ag⁺ ions are replaced by K⁺ ions, but since AgCl is precipitating, the overall number of ions in solution does not significantly change until the equivalence point is reached.
At the equivalence point, all Ag⁺ ions have reacted with Cl⁻ ions to form AgCl. Beyond this point, any additional KCl will increase the concentration of K⁺ and Cl⁻ ions in the solution, leading to an increase in conductance.
The plot of conductance against the volume of KCl will show a relatively flat line up to the equivalence point, indicating little change in conductance as Ag⁺ ions are replaced by K⁺ ions. After the equivalence point, the conductance will rise sharply due to the increase in K⁺ and Cl⁻ ions.
The expected plot for the titration of AgNO₃ against KCl will show a gradual increase in conductance until the equivalence point, followed by a steep increase after the equivalence point due to the addition of excess KCl.
The correct type of plot for the titration of AgNO₃ against KCl is a graph that shows a gradual increase in conductance up to the equivalence point, followed by a sharp increase after the equivalence point.
Topper's Solved these Questions
- ELECTROCHEMISTRY BOOK - AAKASH INSTITUTE ENGLISHCHAPTER - ELECTROCHEMISTRY EXERCISE - Assignment (SECTION C) Objective Type Questions (More than one option are correct)
16 Videos
- ELECTROCHEMISTRY BOOK - AAKASH INSTITUTE ENGLISHCHAPTER - ELECTROCHEMISTRY EXERCISE - Assignment (SECTION D) Linked Comprehension Type Questions
6 Videos
- ELECTROCHEMISTRY BOOK - AAKASH INSTITUTE ENGLISHCHAPTER - ELECTROCHEMISTRY EXERCISE - Assignment (SECTION A) Objective Type Questions (One option is correct)
43 Videos
- COORDINATION COMPOUNDS BOOK - AAKASH INSTITUTE ENGLISHCHAPTER - COORDINATION COMPOUNDS EXERCISE - Assignment (Section-J Aakash Challenger Questions )
10 Videos
- ENVIRONMENTAL CHEMISTRYBOOK - AAKASH INSTITUTE ENGLISHCHAPTER - ENVIRONMENTAL CHEMISTRYEXERCISE - ASSIGNMENT (SECTION-D) (Assertion - Reason Type Questions)
4 Videos
Similar Questions
Knowledge Check
Which of the following carbonates would you expect to rearrange?
A B
B C
C D
D
Which one of the following acids would you expect to be the strongest?
AI−CH2COOHBCl−CH2COOHCBr−CH2COOHDF−CH2COOHWhich one of the following dienes would you expect to be the most stable ?
A B
B C
C D
D
Which of the following pair (s) of ions would be expected to form precipitate when dilute solutions are mixed?
View SolutionWhich ion would you expect to have the maximum splitting of - orbitals
View SolutionWhich of the following pairs of species would you expect to have largest difference in spin only magnetic moment ?
View SolutionWhich of the following would be expected to contain the most peroxisomes ?
View SolutionWhich of the following compounds would you expect to be strongest carbon acid ?
View Solution
