The active site of a biomolecule R is shown below
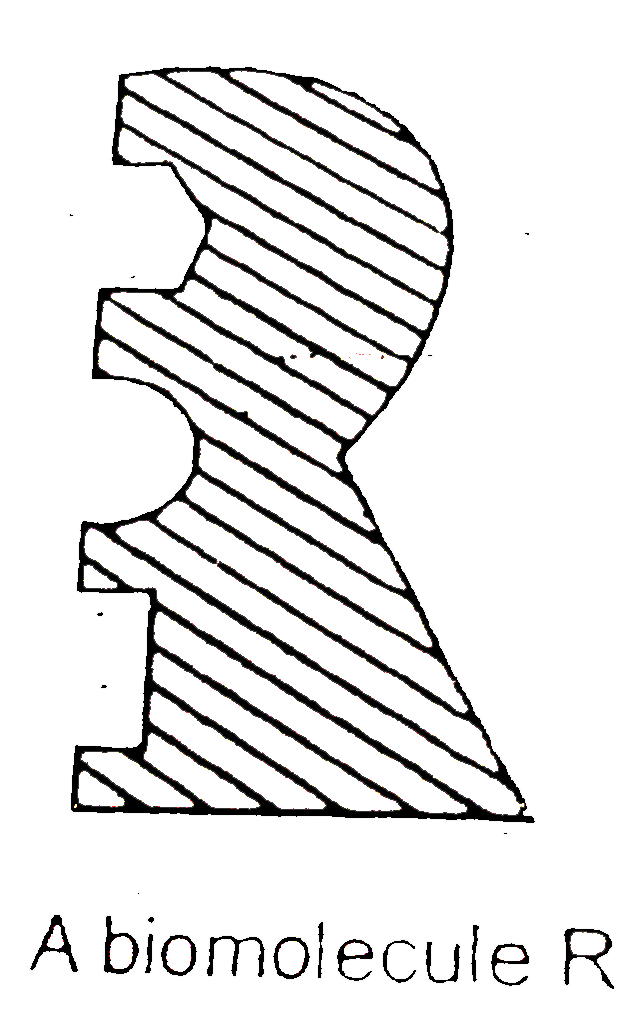
The biomolecule R binds to a tripeptide because its binding site is complementry to that of tripeptide. The shape of the tripeptide would be
Note : Complimentarity in the figure is shown by shape

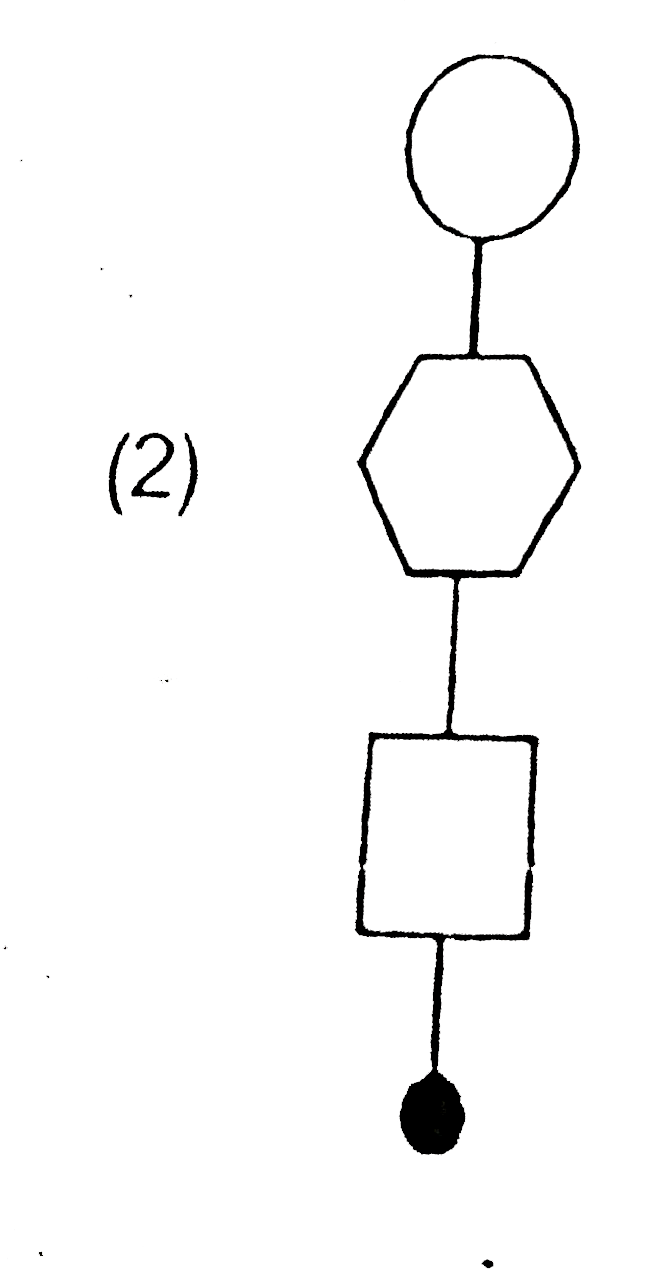
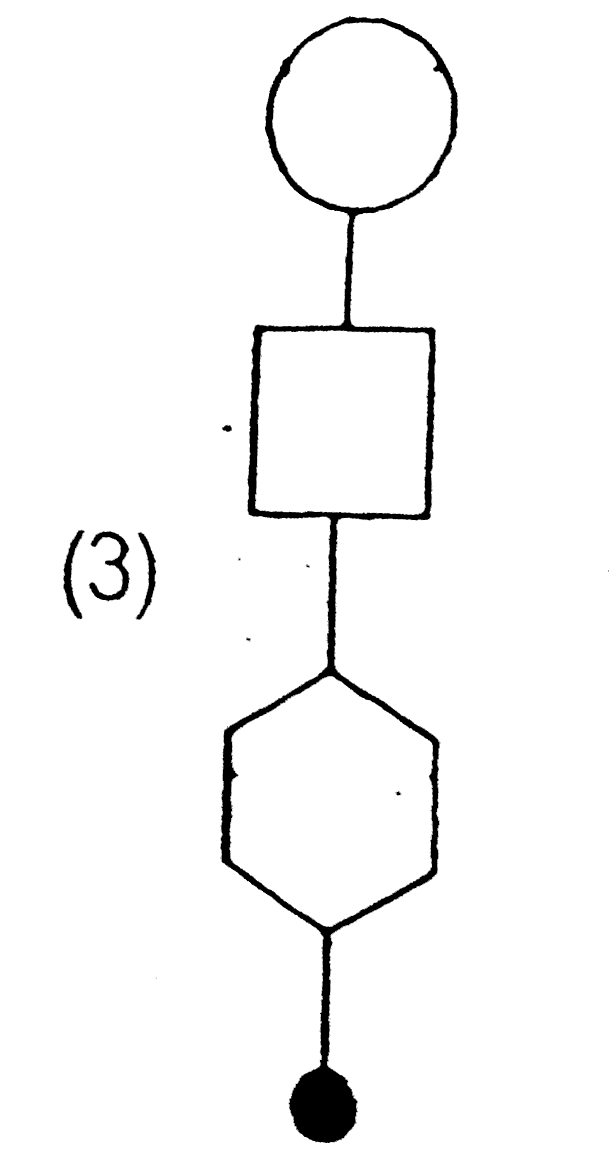
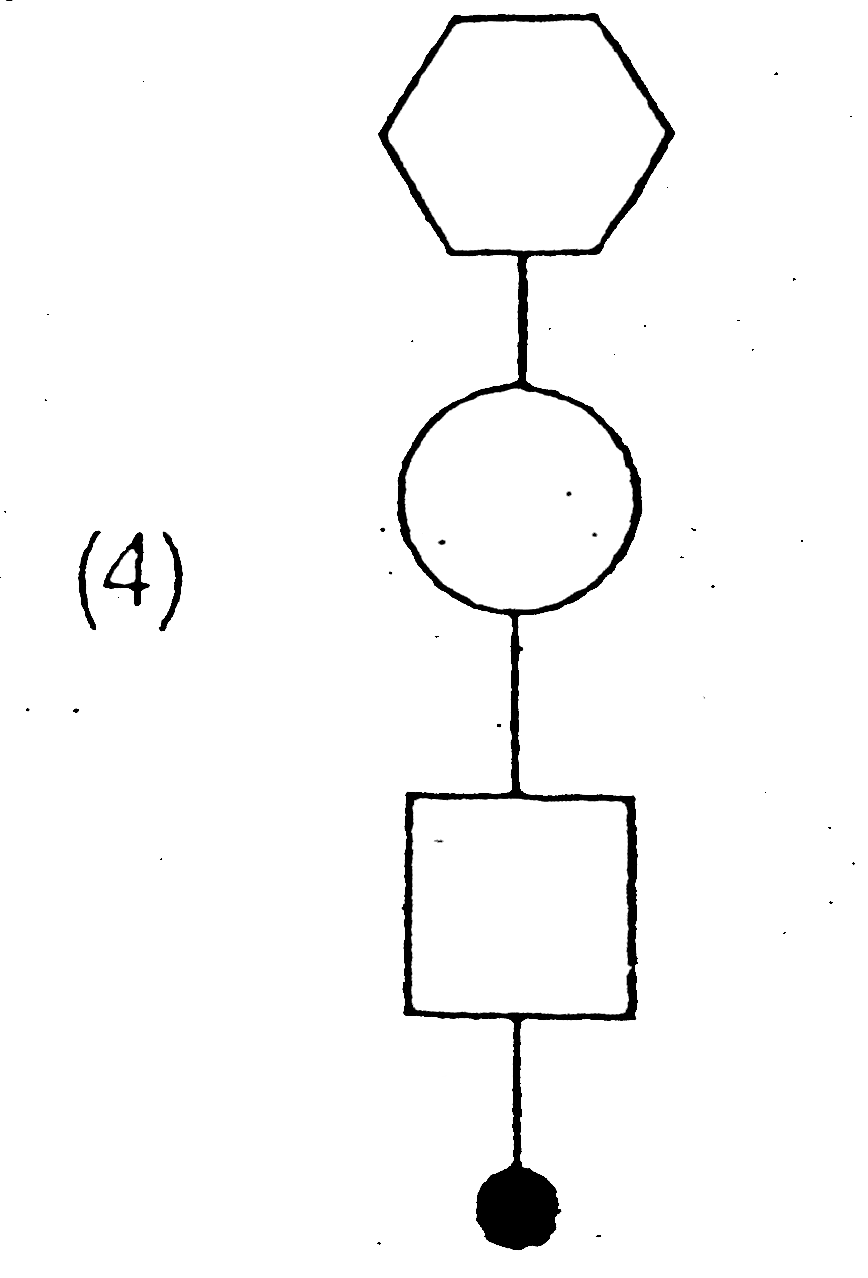
The correct Answer is:D
Step by step video & image solution for The active site of a biomolecule R is shown below The biomolecule R binds to a tripeptide because its binding site is complementry to that of tripeptide. The shape of the tripeptide would be Note : Complimentarity in the figure is shown by shape by Chemistry experts to help you in doubts & scoring excellent marks in Class 12 exams.
Updated on:21/07/2023Topper's Solved these Questions
- BIOMOLECULESBOOK - AAKASH INSTITUTE ENGLISHCHAPTER - BIOMOLECULESEXERCISE - (TRY YOURSELF)
17 Videos
- BIOMOLECULESBOOK - AAKASH INSTITUTE ENGLISHCHAPTER - BIOMOLECULESEXERCISE - EXERCISE
24 Videos
- BIOMOLECULESBOOK - AAKASH INSTITUTE ENGLISHCHAPTER - BIOMOLECULESEXERCISE - Section-I (Subjective type Questions)
6 Videos
- AMINES BOOK - AAKASH INSTITUTE ENGLISHCHAPTER - AMINES EXERCISE - Assignment Section -J (Aakash Challengers Questions)
9 Videos
- CHEMICAL BONDING AND MOLECULAR STRUCTURE BOOK - AAKASH INSTITUTE ENGLISHCHAPTER - CHEMICAL BONDING AND MOLECULAR STRUCTURE EXERCISE - Assignment Section J (Aakash Challengers Questions)
10 Videos
Similar Questions
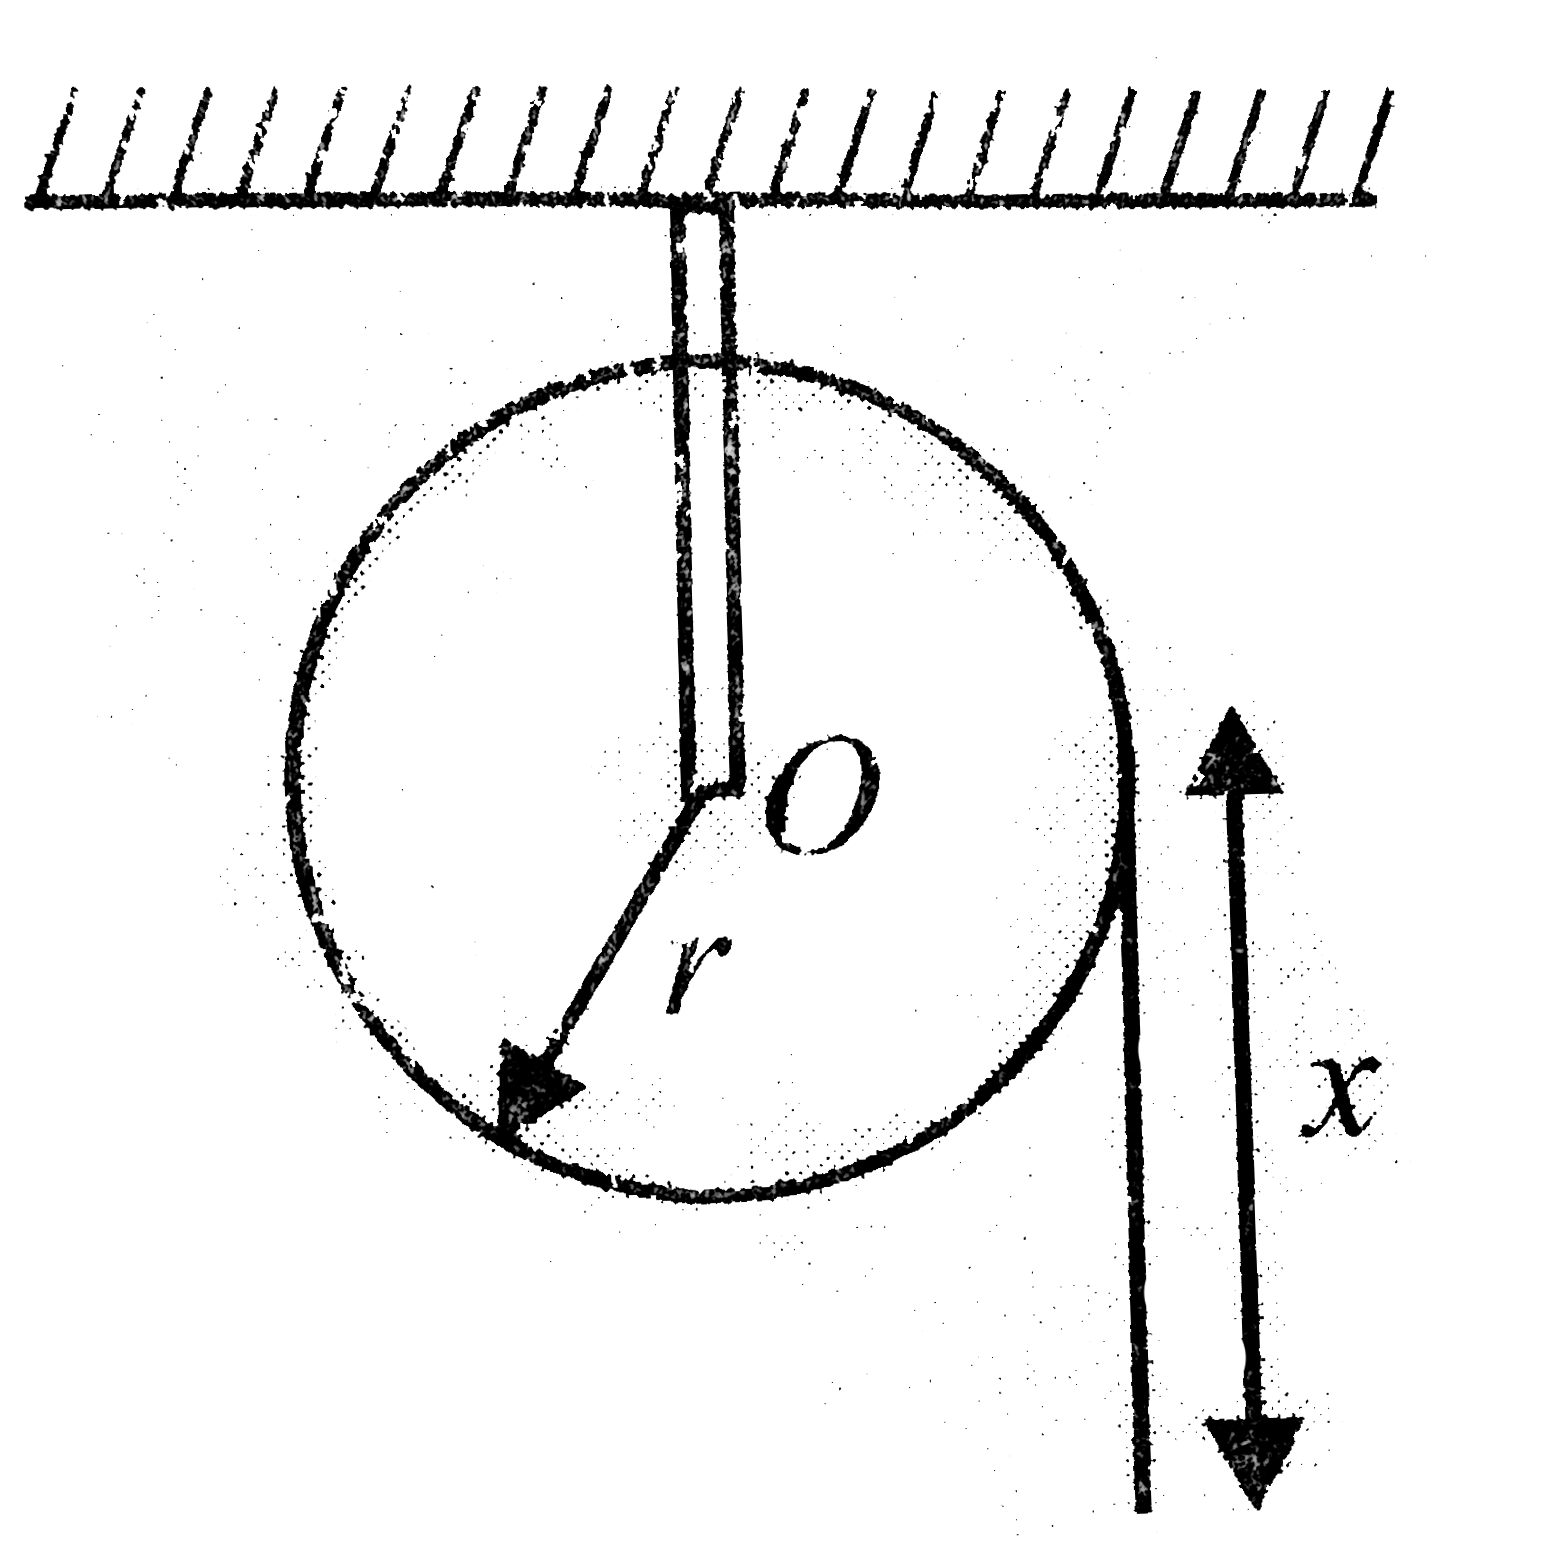
A uniform cylinder of radius r and mass m can rotate freely about a fixed horizontal axis. A thin cord of length l and mass m0 is would on the cylinder in a single layer. Find the angular acceleration of the cylinder as a function of the length x of the hanging part of the end. the wound part of the cord is supposed to have its centre of gravity on the cylinder axis is shown in figure.
View SolutionWhich of the following statements are incorrect about receptor proteins ?
a.Majority of receptor protein are embedded in the cell membranes
b.The active site of receptor proteins opens on the inside region of the cell
c.Chemical messengers are received at the binding sites of receptor proteins
d.Shape of receptor doesn't change during attachment of messenger
View Solution
Knowledge Check
Arrange the steps of catalytic action of an enzyme in order and select the correct option
I. The enzyme releases the products of the reaction and the enzyme is free to bind to another substrate
II. The active site of enzyme is in close proximity of the substrate and breaks the chemical bonds of the substrate
III. The binding of substrate induces the enzyme to alter its shape fitting more tightly around substrate.
VI. The substrate binds to the active site of the enzymeAIV,III,II,IBIII,III,I,IVCIV,II,I,IIDII,I,IV,IIIThe relationship between population density (Nt) and population growth rate (R=Nt+1lNt) in a certain animal species is shown below.
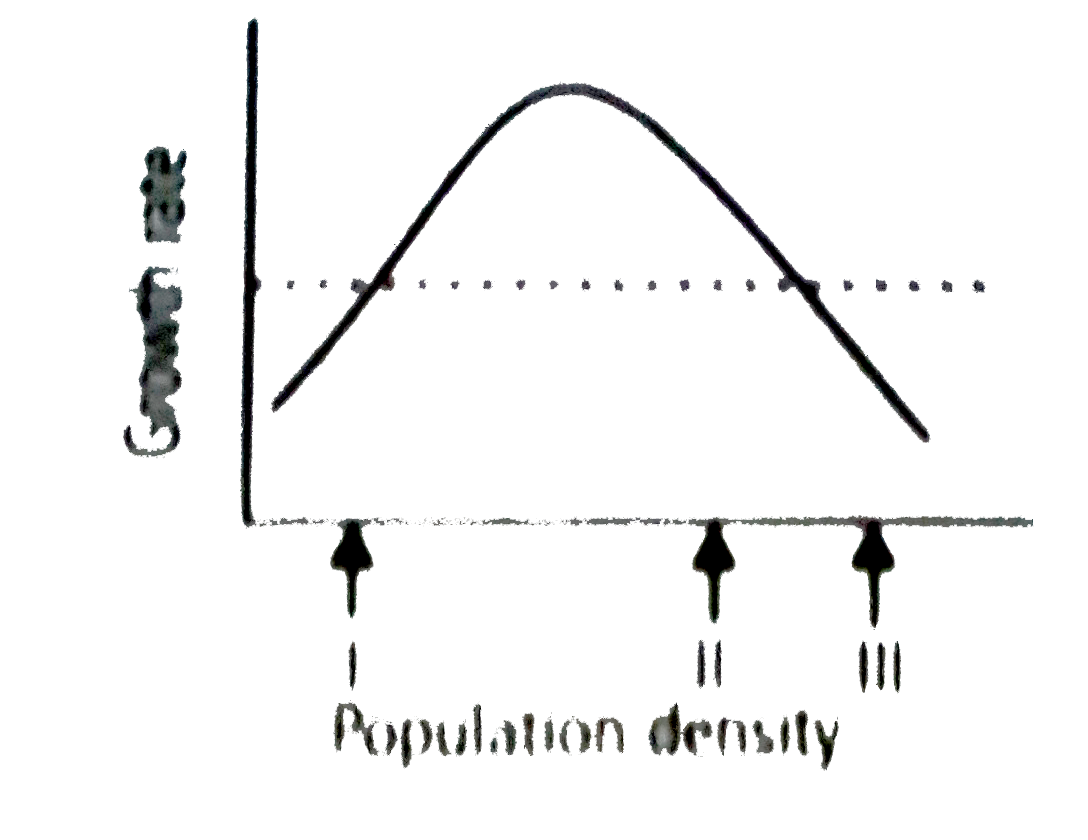
Choose from the following graphs the appropriate populations growth patterns that would be obtained if the population is at the densities (I, II, III) shown in the graph above. [Note : THe y-axis in A to D is relative density that cannot be compared to the absolute density in the figure]
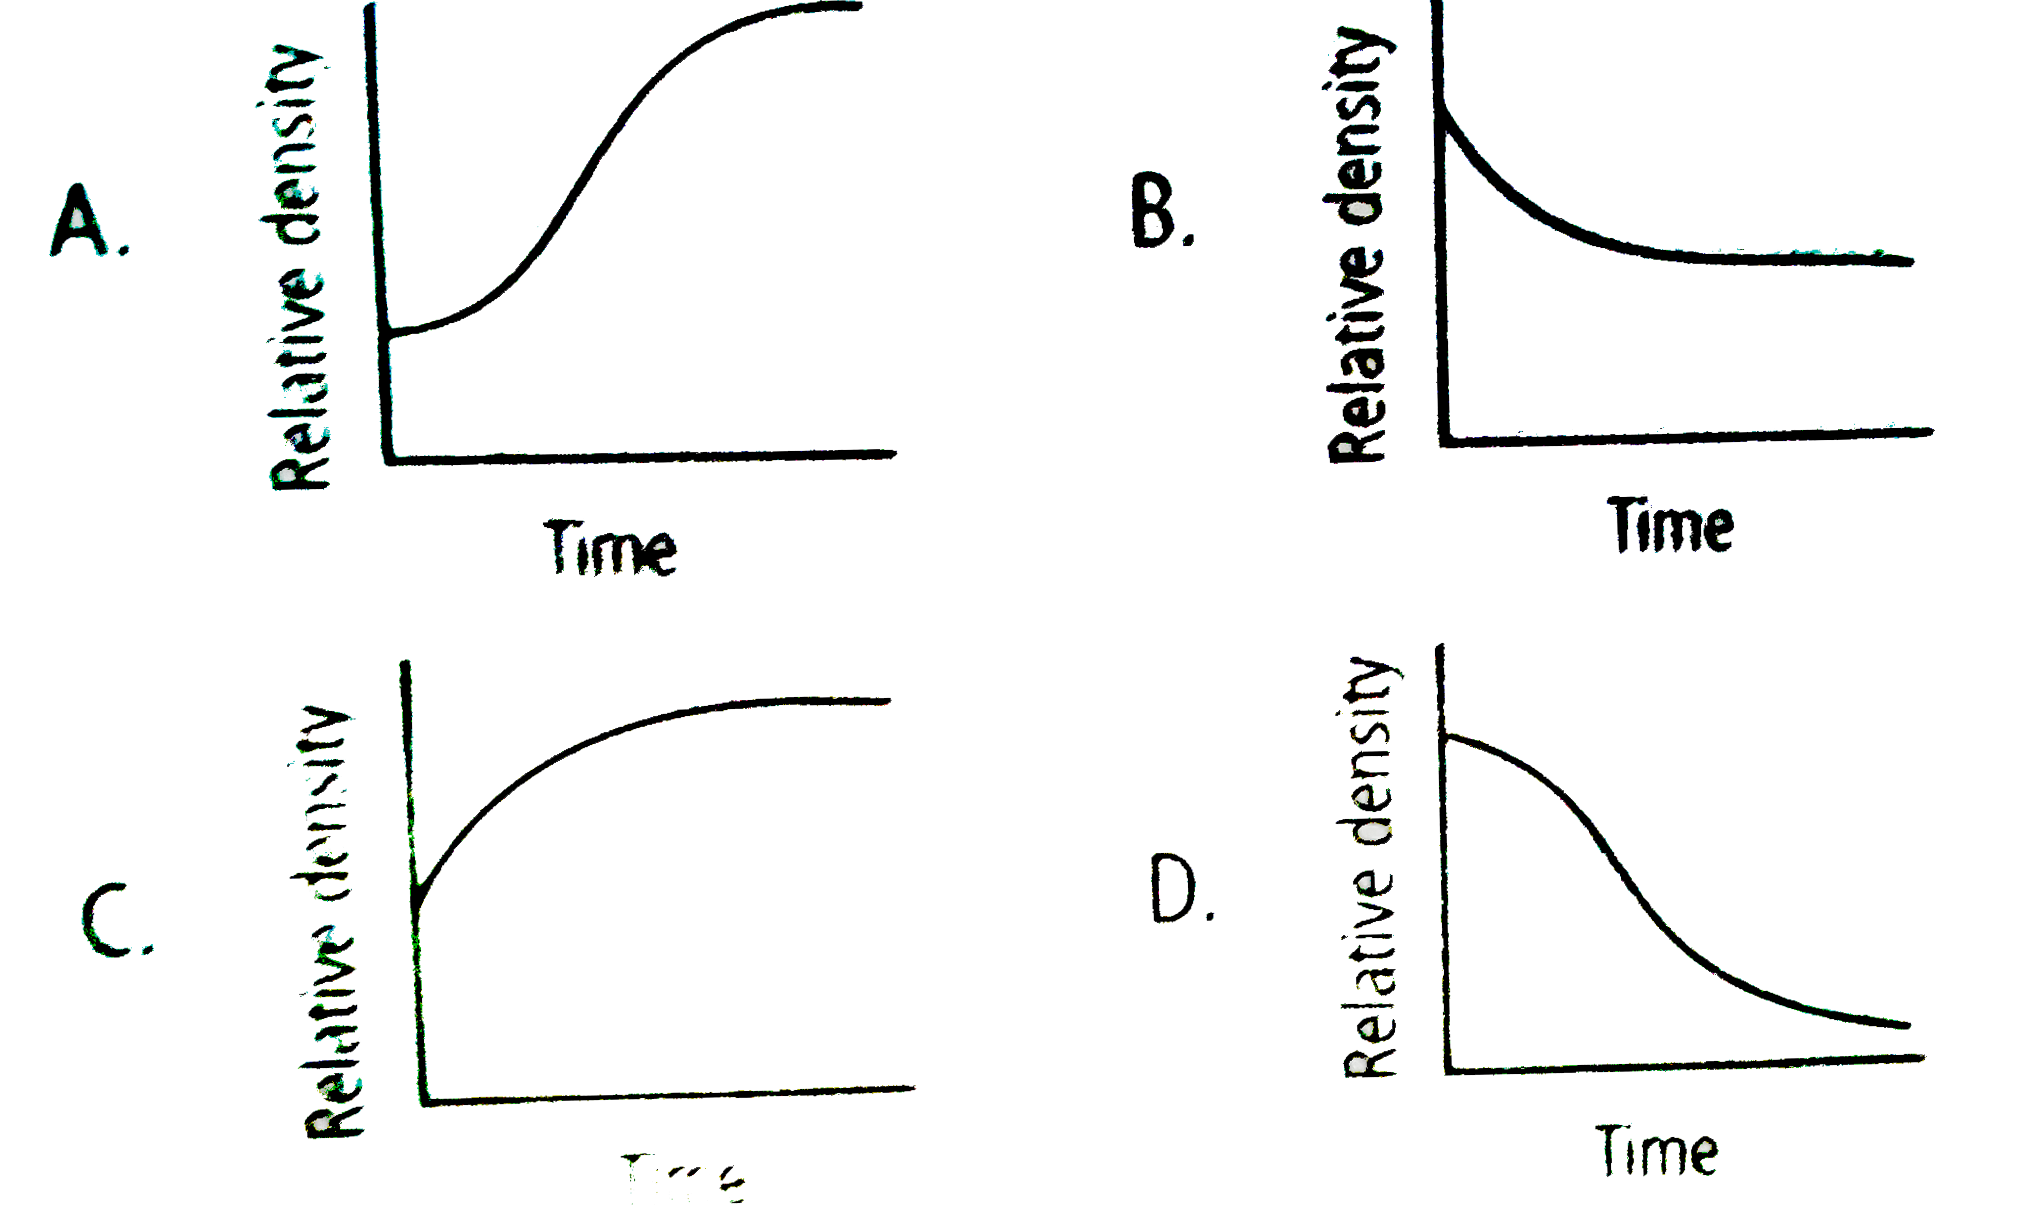 AI−A,II−B,III−CBI−D,II−C,III−BCI−B,II−C,III−DDI−C,II−A,III−B
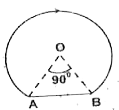
A current I flows along a thin wire shaped as shown in figure. The radius of the curved part of the wire is r. The field at the centre O of the coil is:
View SolutionThe graph shows the effect of temperature on the rate at which the enzyme in a biological washing powder digests and removes fruit juice stains .
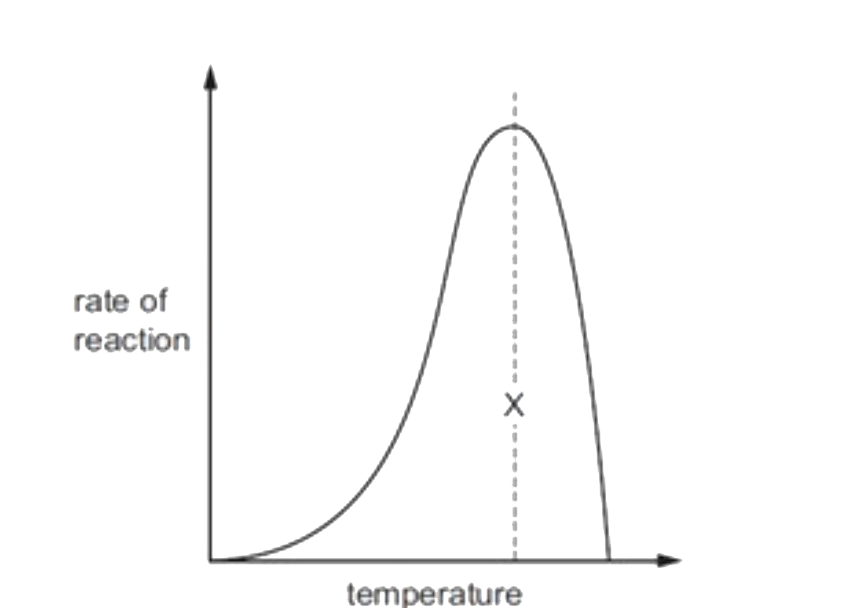
Which statements explain the shape of the graph at temperatures higher than X ?
I. Bonds are broken between the R groups of the amino acids in the polypeptide chains of the enzyme.
II. There are more collisions between the enzyme and its substrate.
III. The tertiary structure of the enzyme is altered.
Iv. The shapes of the active site and the substrate are no longer complementary .
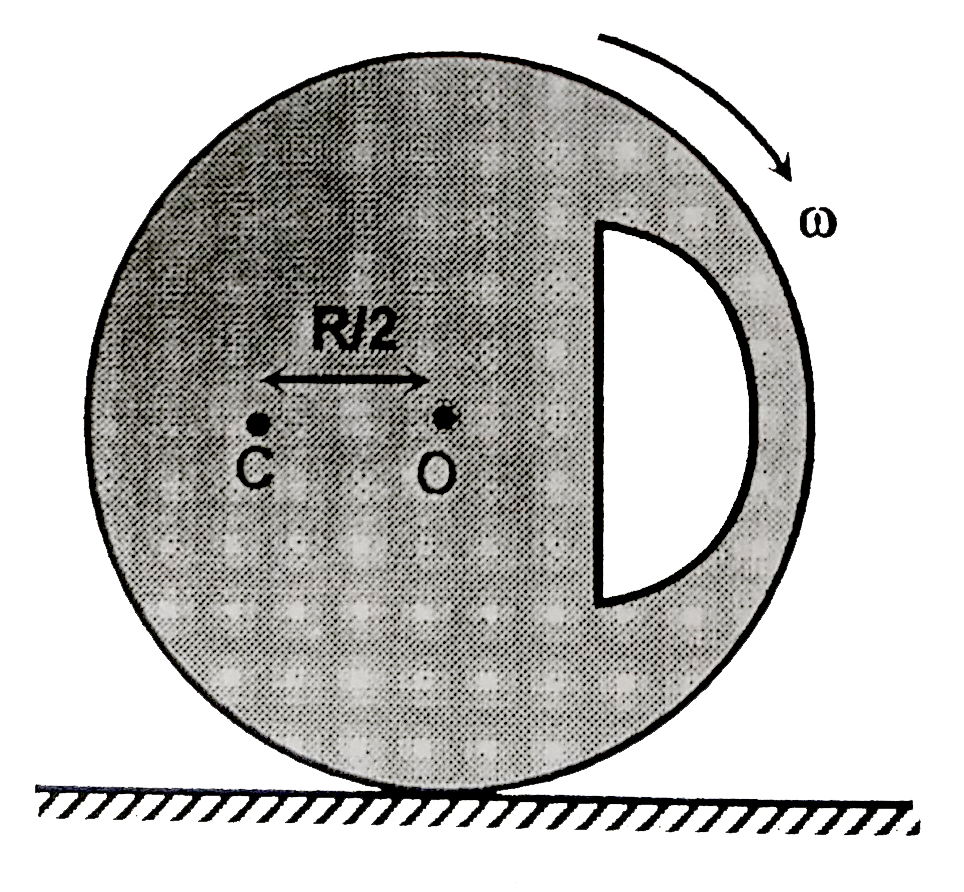
View SolutionA disc shaped body (having a hole shown in the figure) of mass m=10kg and radius R=109m is performing pure rolling motion on a rough horizontal surface. In the figure point O is geometrical center of the disc and at this instant the centre of mass C of the disc is at same horizontal level with O. The radius of gyration of the disc about an axis pasing through C and perpendicular to the plane of the disc is R2 and at the insant shown the angular velocity of the disc is ω=√gR rad/sec in clockwise sence. g is gravitation acceleration =10m/s2. Find angular acceleation α ( in rad/s2) of the disc at this instant.
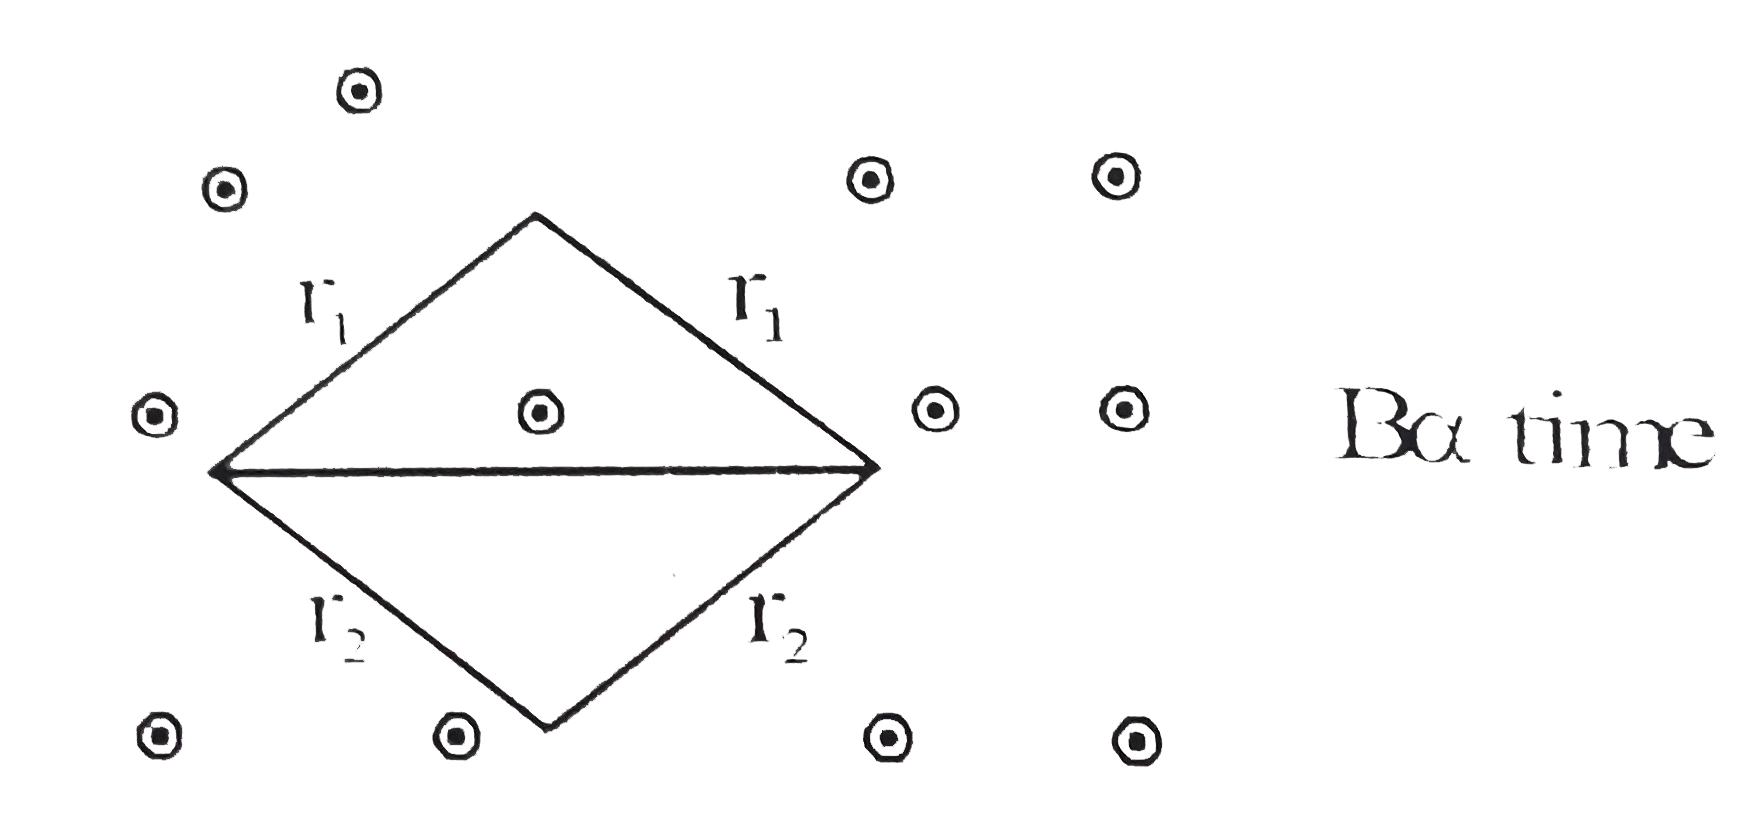
View SolutionThe sides of a square shaped frame, Shown in the diagram are made of wires of resistances r1 and r2 The frame is places in a uniform magnetic field, which is perpendicular to the plane of figure and is increasing at a constant rate. The resistance that should be connected across the diagonal of frame, so that this wire is warmed up at greatest rate is given by R=nr1r2r1+r2. Find n.
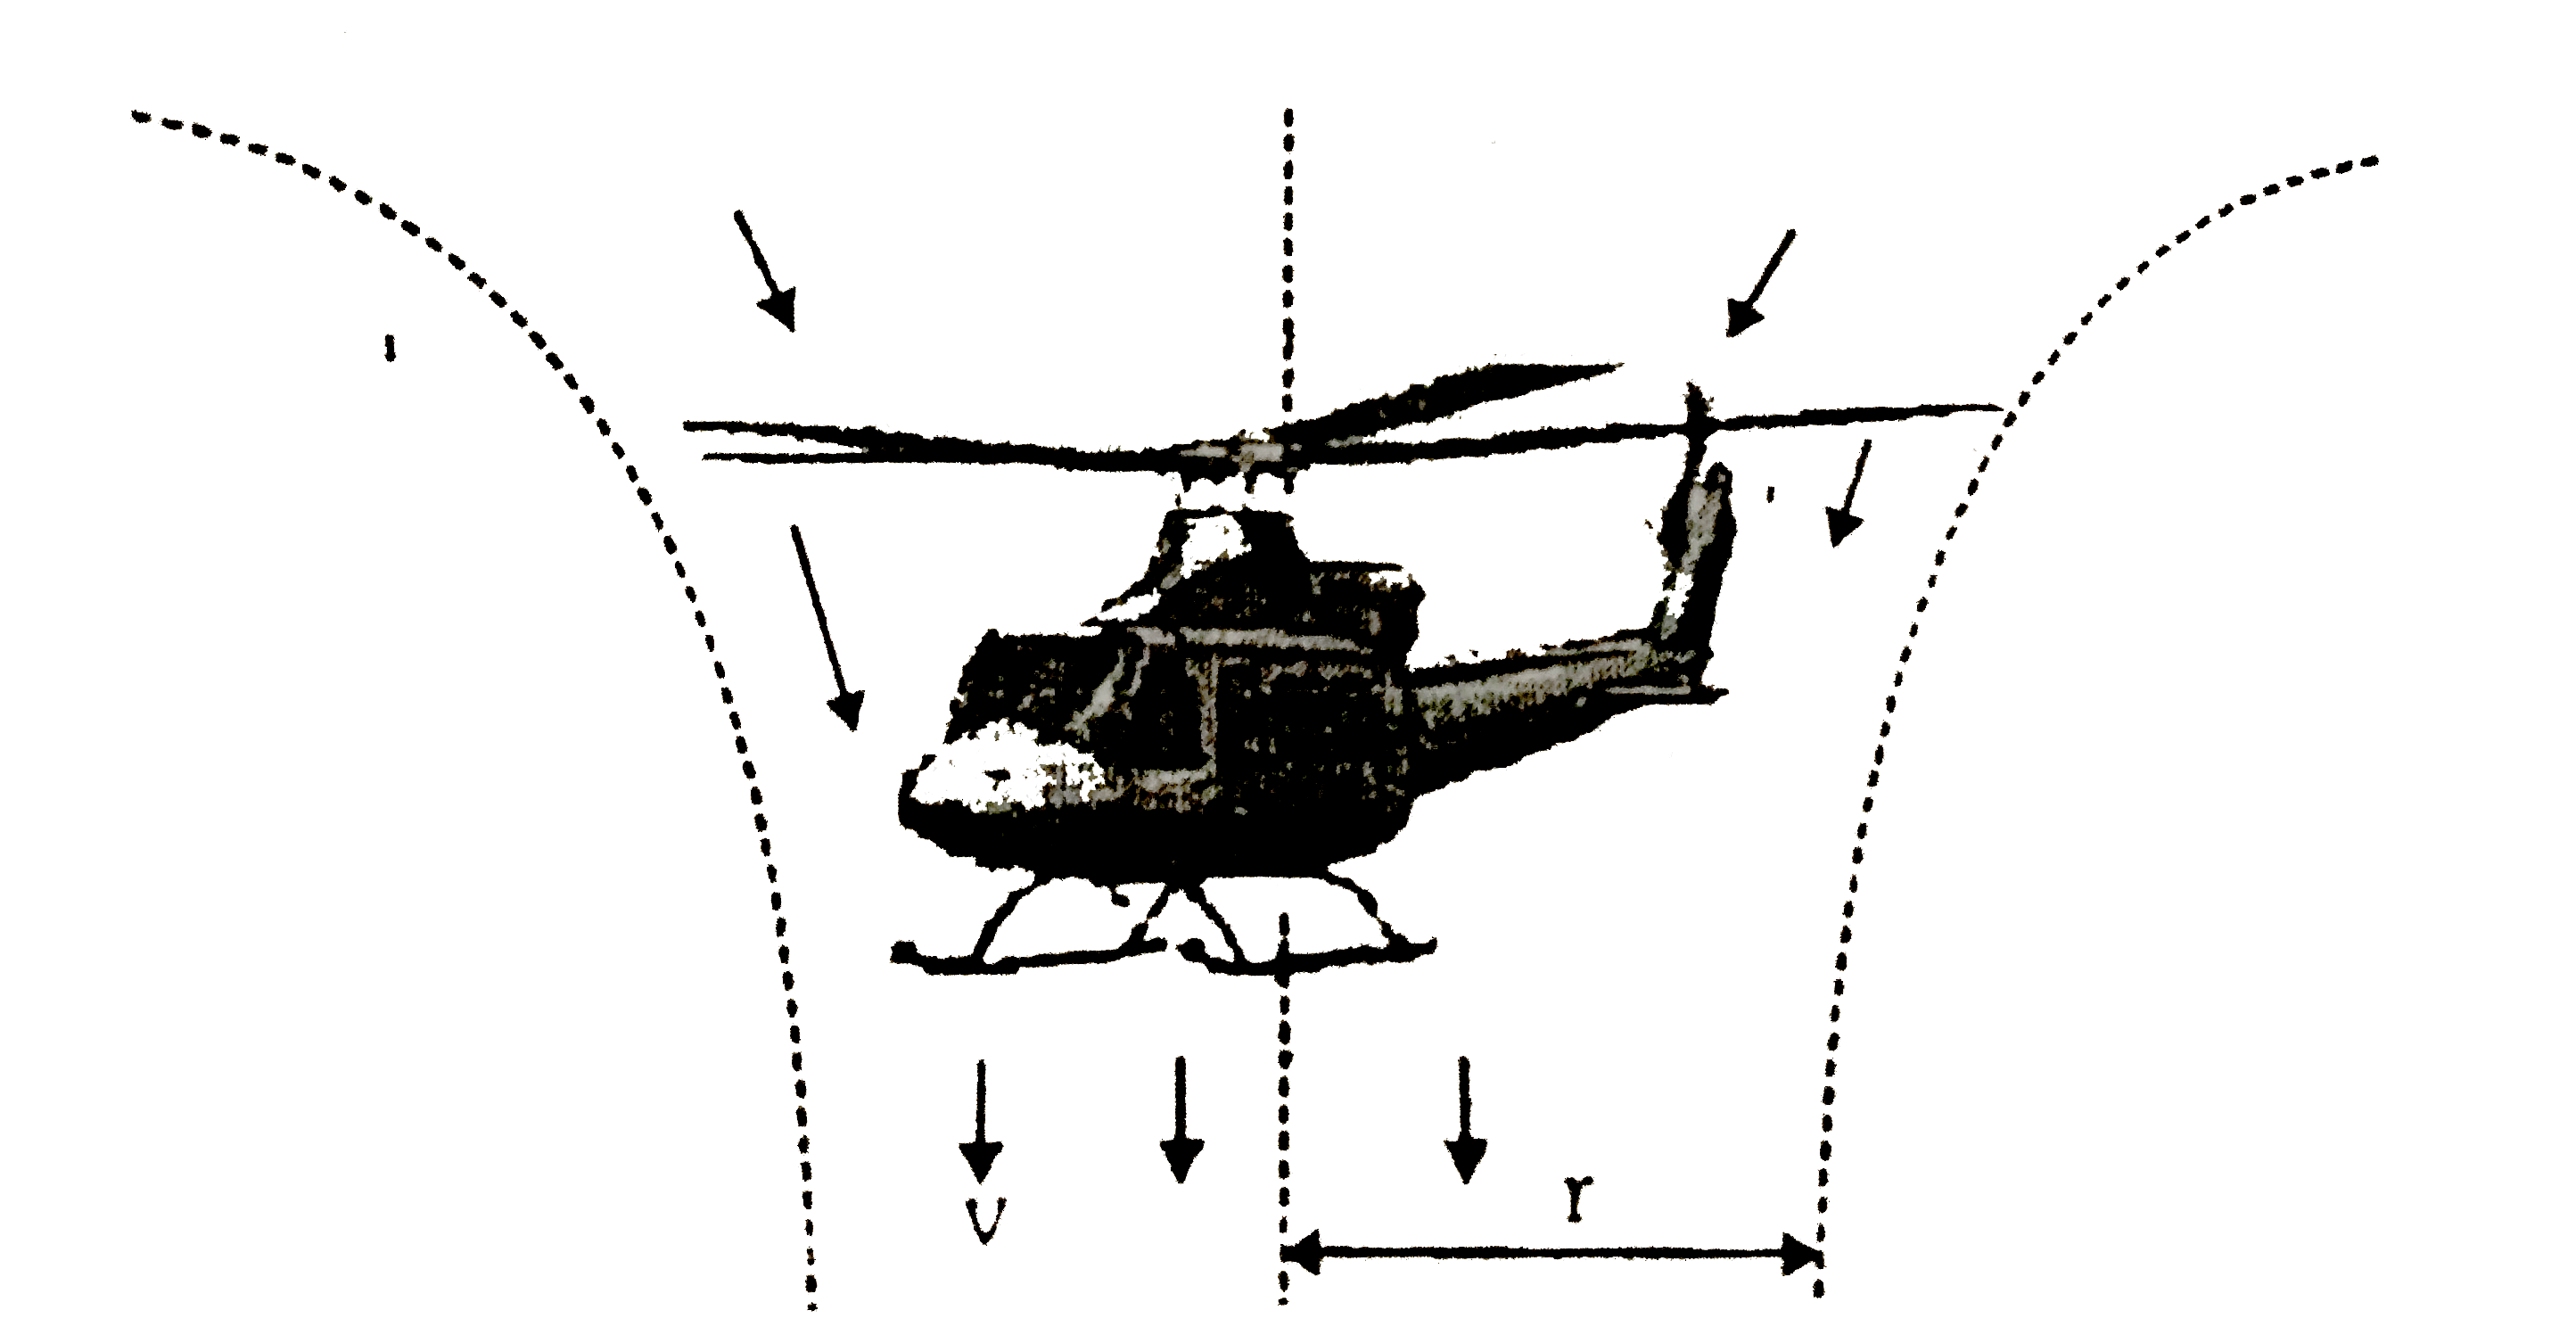
View SolutionThe helicopter has a mass m and maintains its height by imparting a downward momentum to a column of air defined by the slipstream boundary as shown in figure. The propeller blades can project a downward air speed v0, where the pressure in the stream below the blades is atmospheric and the radius of the circular cross section of the slipstream is r. Neglect any rotational energy of the air, the temperature rise due to air friction and any change in air density ρ.
If the power is doubled, the acceleration of the helicopter is :-
View SolutionDirection :
Resistive force proportional to object velocity
At low speeds, the resistive force acting on an object that is moving a viscous medium is effectively modeleld as being proportional to the object velocity. The mathematical representation of the resistive force can be expressed as
R=−bv
Where v is the velocity of the object and b is a positive constant that depends on the properties of the medium and on the shape and dimensions of the object. The negative sign represents the fact that the resistance froce is opposite to the velocity.
Consider a sphere of mass m released frm rest in a liquid. Assuming that the only forces acting on the spheres are the resistive froce R and the weight mg, we can describe its motion using Newton's second law. though the buoyant force is also acting on the submerged object the force is constant and effect of this force be modeled by changing the apparent weight of the sphere by a constant froce, so we can ignore it here.
Thus mg−bv=mdvdt⇒dvdt=g−bmv
Solving the equation
v=mgb(1−e−bt/m)
where e=2.71 is the base of the natural logarithm
The acceleration becomes zero when the increasing resistive force eventually the weight. At this point, the object reaches its terminals speed v1 and then on it continues to move with zero acceleration
mg−bT=0
⇒mT=mgb
Hence v=vT(1−evtm)
In an experimental set-up four objects I,II,III,IV were released in same liquid. Using the data collected for the subsequent motions value of constant b were calculated. Respective data are shown in table.
ObjectIIIIIIVMass (in kg.)1234Constant bin (N-s)/m3.71.41.42.8
Which object would first acquire half of their respective terminal speed in minimum time from start of the motion of all were released simultaneously ?
View Solution
