Draw the position-time graph of a stationary object.
To draw the position-time graph of a stationary object, follow these steps:
Step 1: Understand the Concept of a Stationary Object
A stationary object is one that does not change its position over time. This means that the velocity of the object is zero.
Step 2: Define the Position
Since the object is stationary, its position (x) remains constant. We can represent this mathematically as:
dxdt=0
This implies that the position x is equal to some constant value, say x=c, where c is a constant.
Step 3: Set Up the Axes for the Graph
On a graph, we will have:
- The horizontal axis (x-axis) representing time (t).
- The vertical axis (y-axis) representing position (x).
Step 4: Plot the Graph
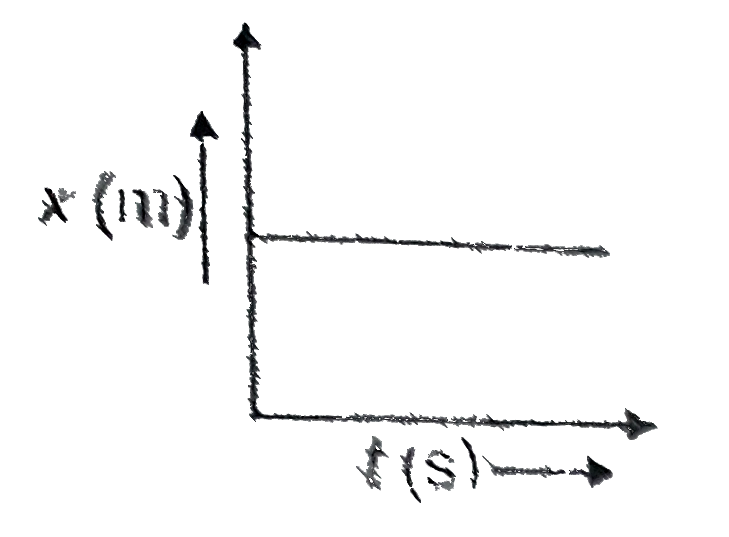
Since the position does not change over time, the graph will be a horizontal line. This line will be at the height corresponding to the constant position c.
Step 5: Label the Graph
- Label the y-axis as "Position (x)".
- Label the x-axis as "Time (t)".
- Indicate the constant position value c on the y-axis.
Final Graph
The final graph will look like a horizontal line at the value c on the position axis, indicating that no matter how much time passes, the position remains the same.
A stationary object is one that does not change its position over time. This means that the velocity of the object is zero.
Since the object is stationary, its position (x) remains constant. We can represent this mathematically as:
dxdt=0
This implies that the position x is equal to some constant value, say x=c, where c is a constant.
On a graph, we will have:
- The horizontal axis (x-axis) representing time (t).
- The vertical axis (y-axis) representing position (x).
Since the position does not change over time, the graph will be a horizontal line. This line will be at the height corresponding to the constant position c.
- Label the y-axis as "Position (x)".
- Label the x-axis as "Time (t)".
- Indicate the constant position value c on the y-axis.
The final graph will look like a horizontal line at the value c on the position axis, indicating that no matter how much time passes, the position remains the same.
Topper's Solved these Questions
- MOTION IN STRAIGHT LINEBOOK - AAKASH INSTITUTE ENGLISHCHAPTER - MOTION IN STRAIGHT LINEEXERCISE - Try Yourself
40 Videos
- MOTION IN STRAIGHT LINEBOOK - AAKASH INSTITUTE ENGLISHCHAPTER - MOTION IN STRAIGHT LINEEXERCISE - Assignment (SECTION - A)
50 Videos
- MOTION IN A STRAIGHT LINEBOOK - AAKASH INSTITUTE ENGLISHCHAPTER - MOTION IN A STRAIGHT LINEEXERCISE - ASSIGNMENT (SECTION - D)
15 Videos
- MOVING CHARGE AND MAGNESIUMBOOK - AAKASH INSTITUTE ENGLISHCHAPTER - MOVING CHARGE AND MAGNESIUMEXERCISE - SECTION D
16 Videos
Similar Questions
Knowledge Check
The area enclosed by the position-time graph of a stationary body,
Agives its speedBgives its velocityCgives its accelerationDhas no physical significance
What is the slope of x-t graph of a stationary object?
View SolutionFigure shows the position -time graph of an object in SHM. The correct equation representing this motion is

View SolutionThe position-time graph of an object is given below. What is the velocity of the object?

View SolutionThe position-time graph of an object is given below. What is the velocity of the object?

View SolutionDraw the velocity-time graph of an object moving with uniform negative acceleration.
View SolutionDraw the velocity-time graph of an object whose speed is increasing at uniform rate but moving with negative acceleration.
View SolutionA : The area under acceleration - time graph is equal to velocity of object.
R : For an object moving with constant acceleration, position - time graph is a straight line.
View Solution
