The v-t graph for a particle moving along x-axis is shown in the figure, find
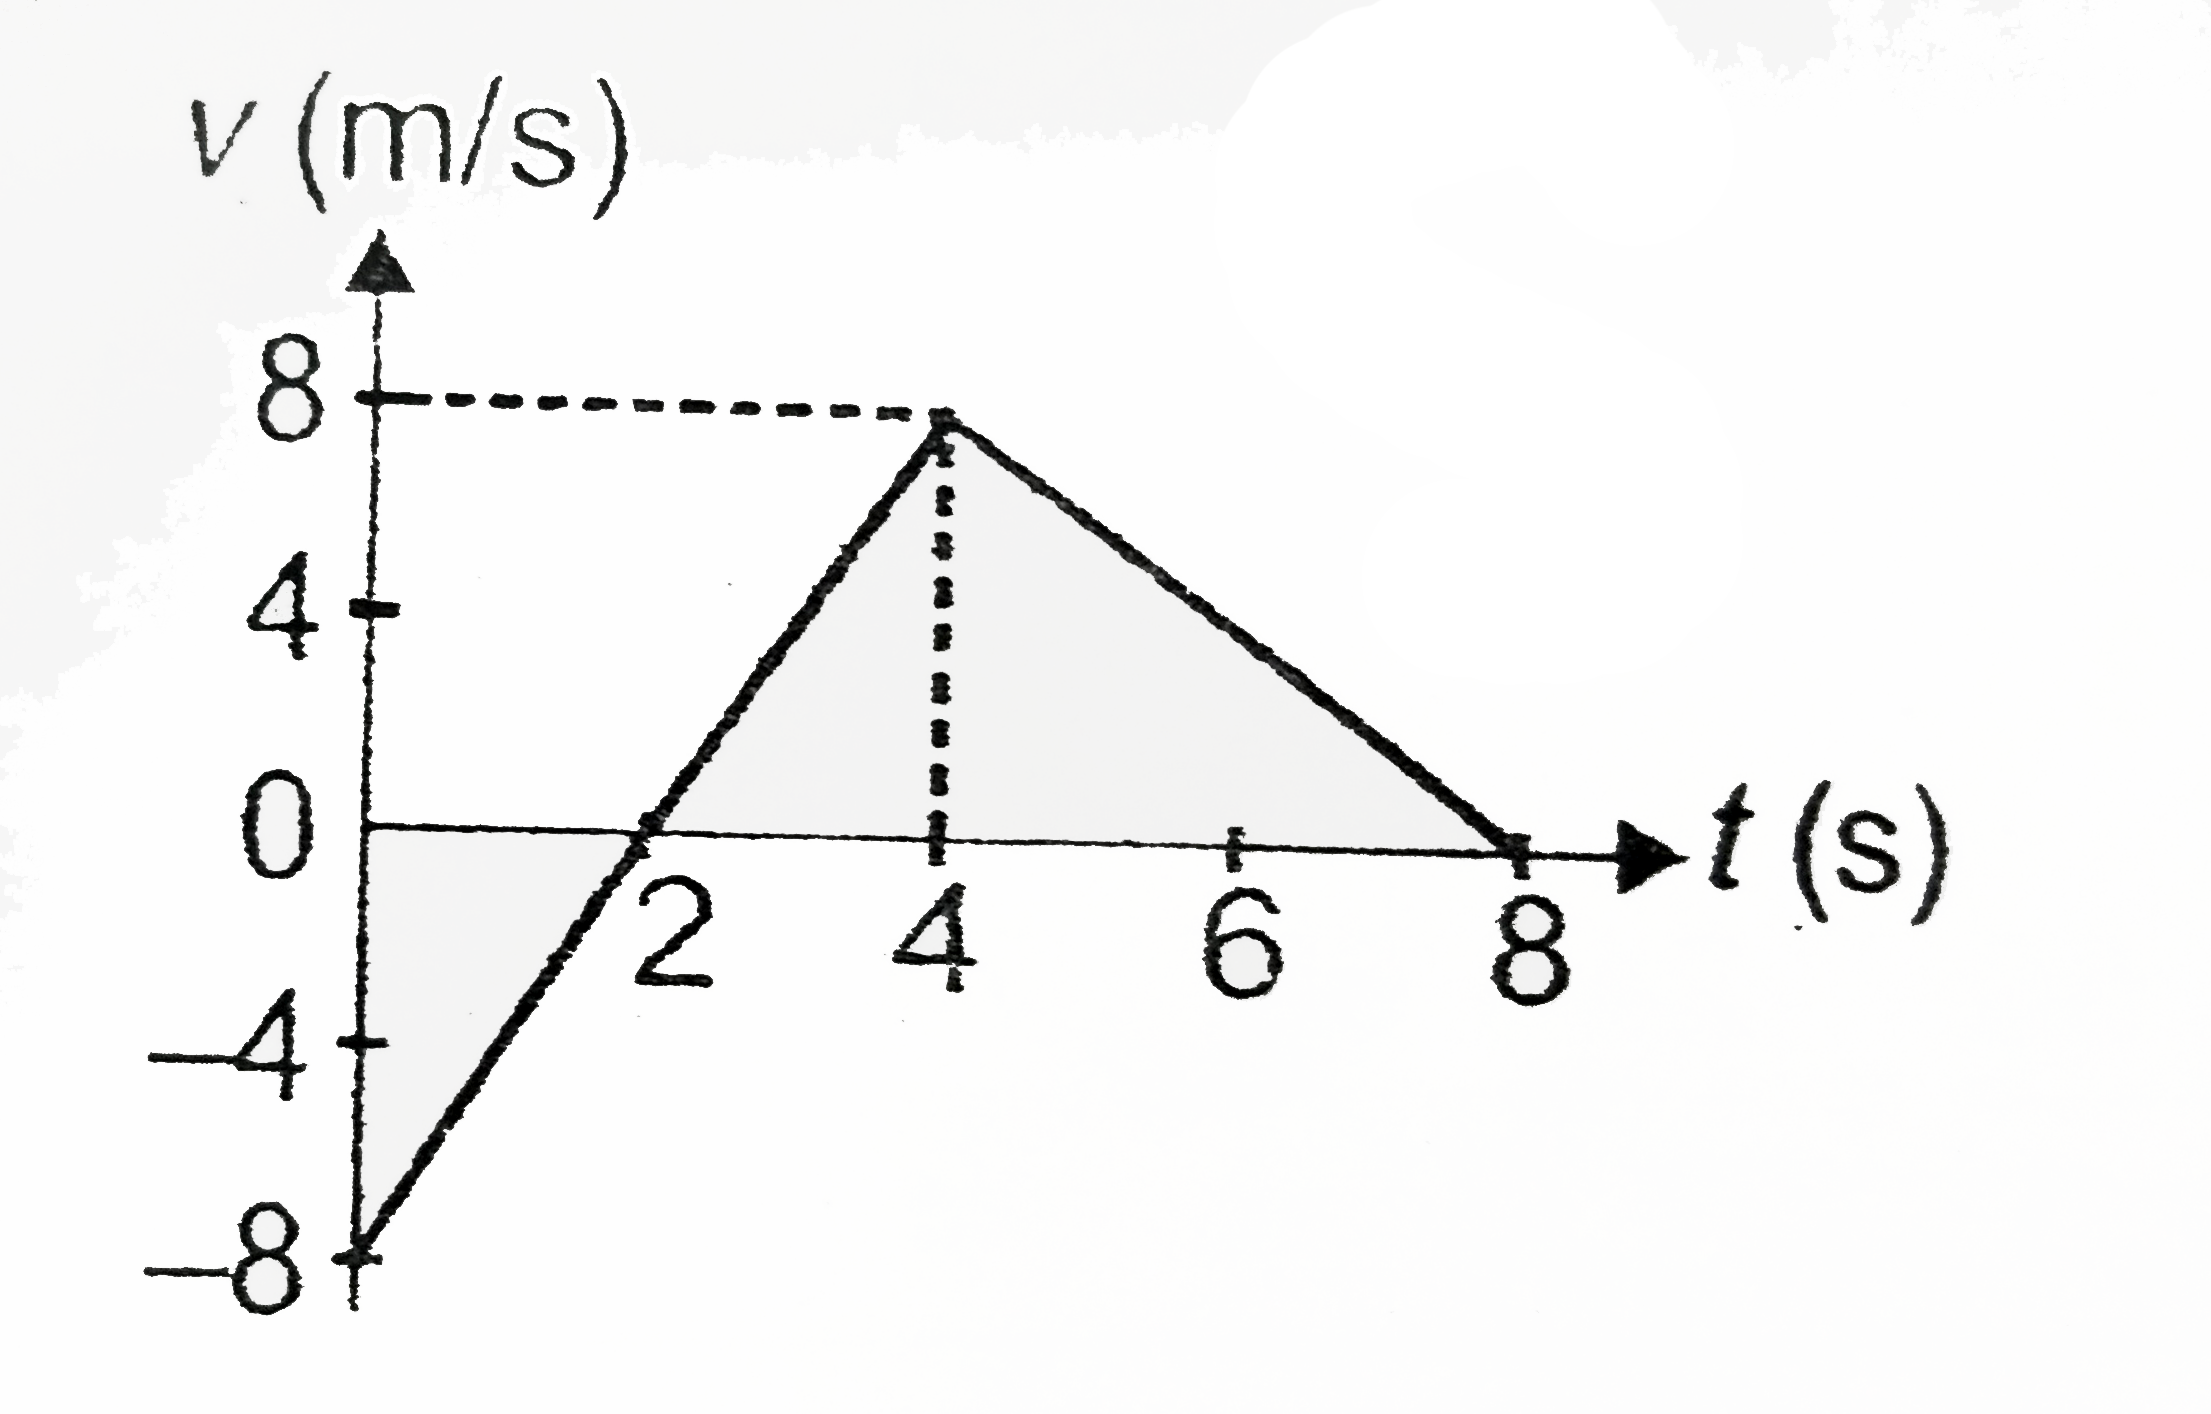
(a) Average velocity in the interval 0 to 8 s.
(b) Average speed in the interval 0 to 8 s.
(c) Average acceleration in the interval 0 to 4 s.
(d) Instantaneous acceleration at t = 2.5 s.
(a) Displacement in the interval 0 to 8 s is equal to the area under the graph, taking the area below time axis as negative.
⇒ Displacement=(−12×2×8)+(12×6×8)
= 16 m
Average velocity=displacementtime interval=168=2m/s
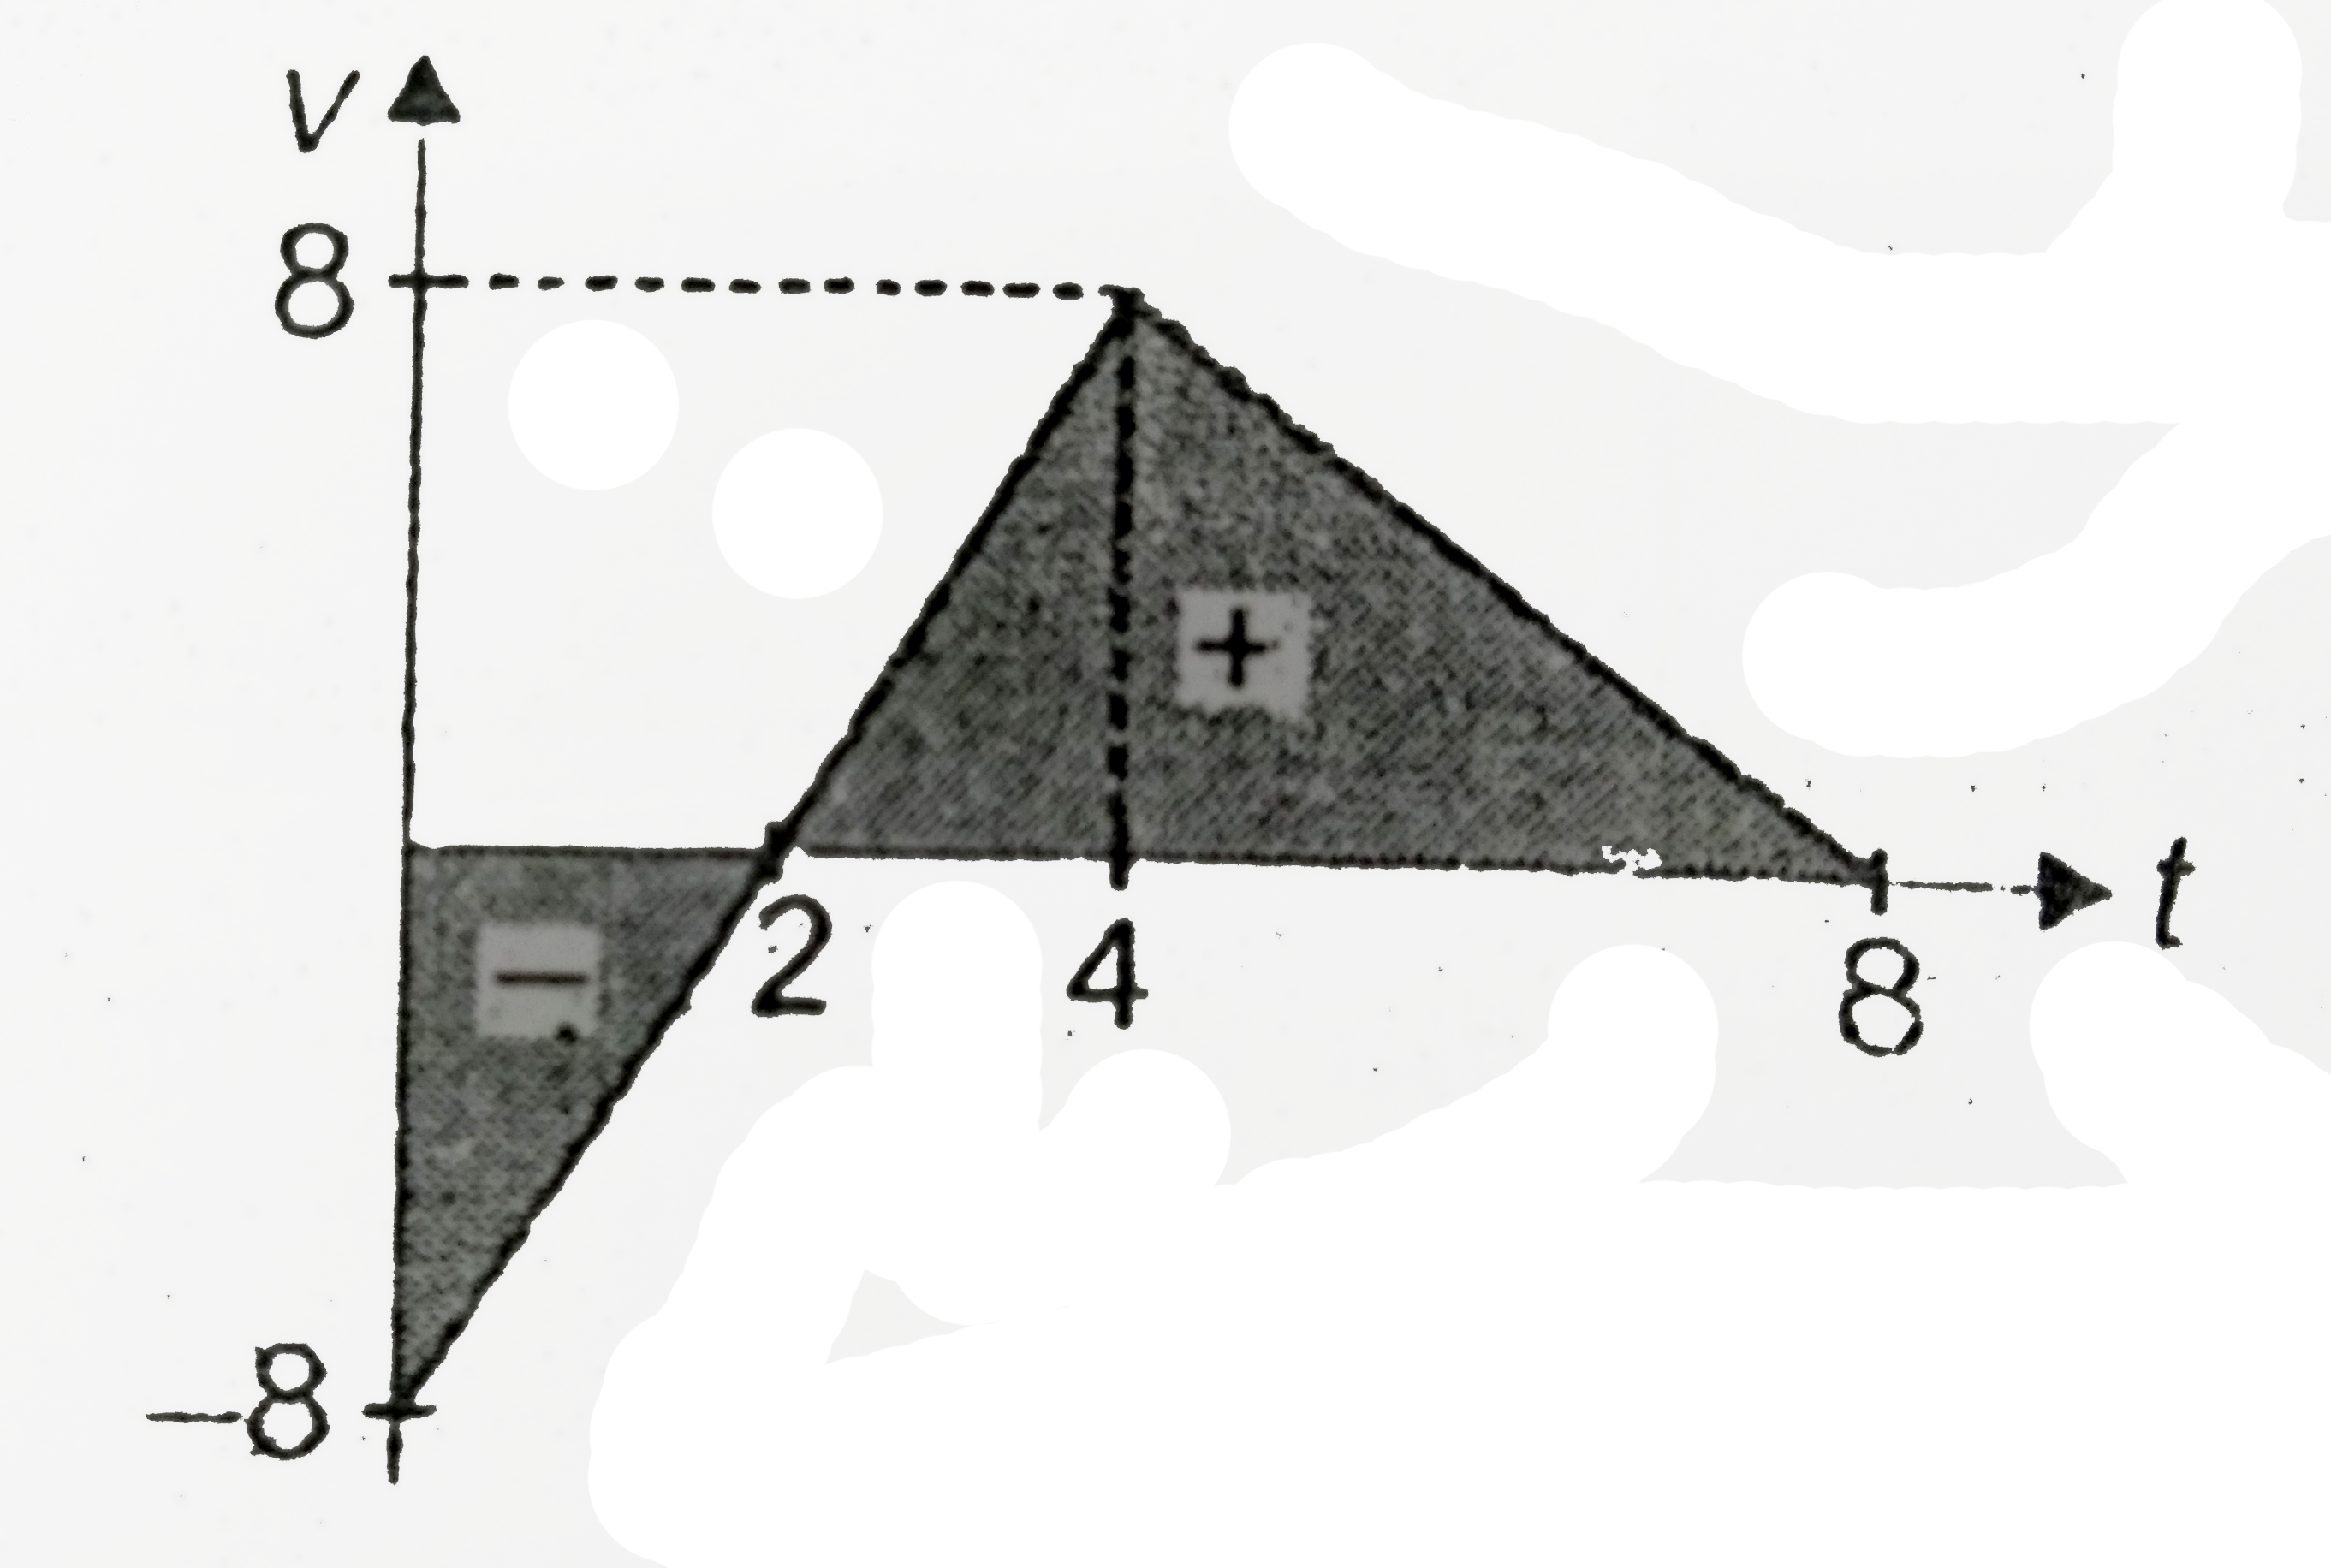
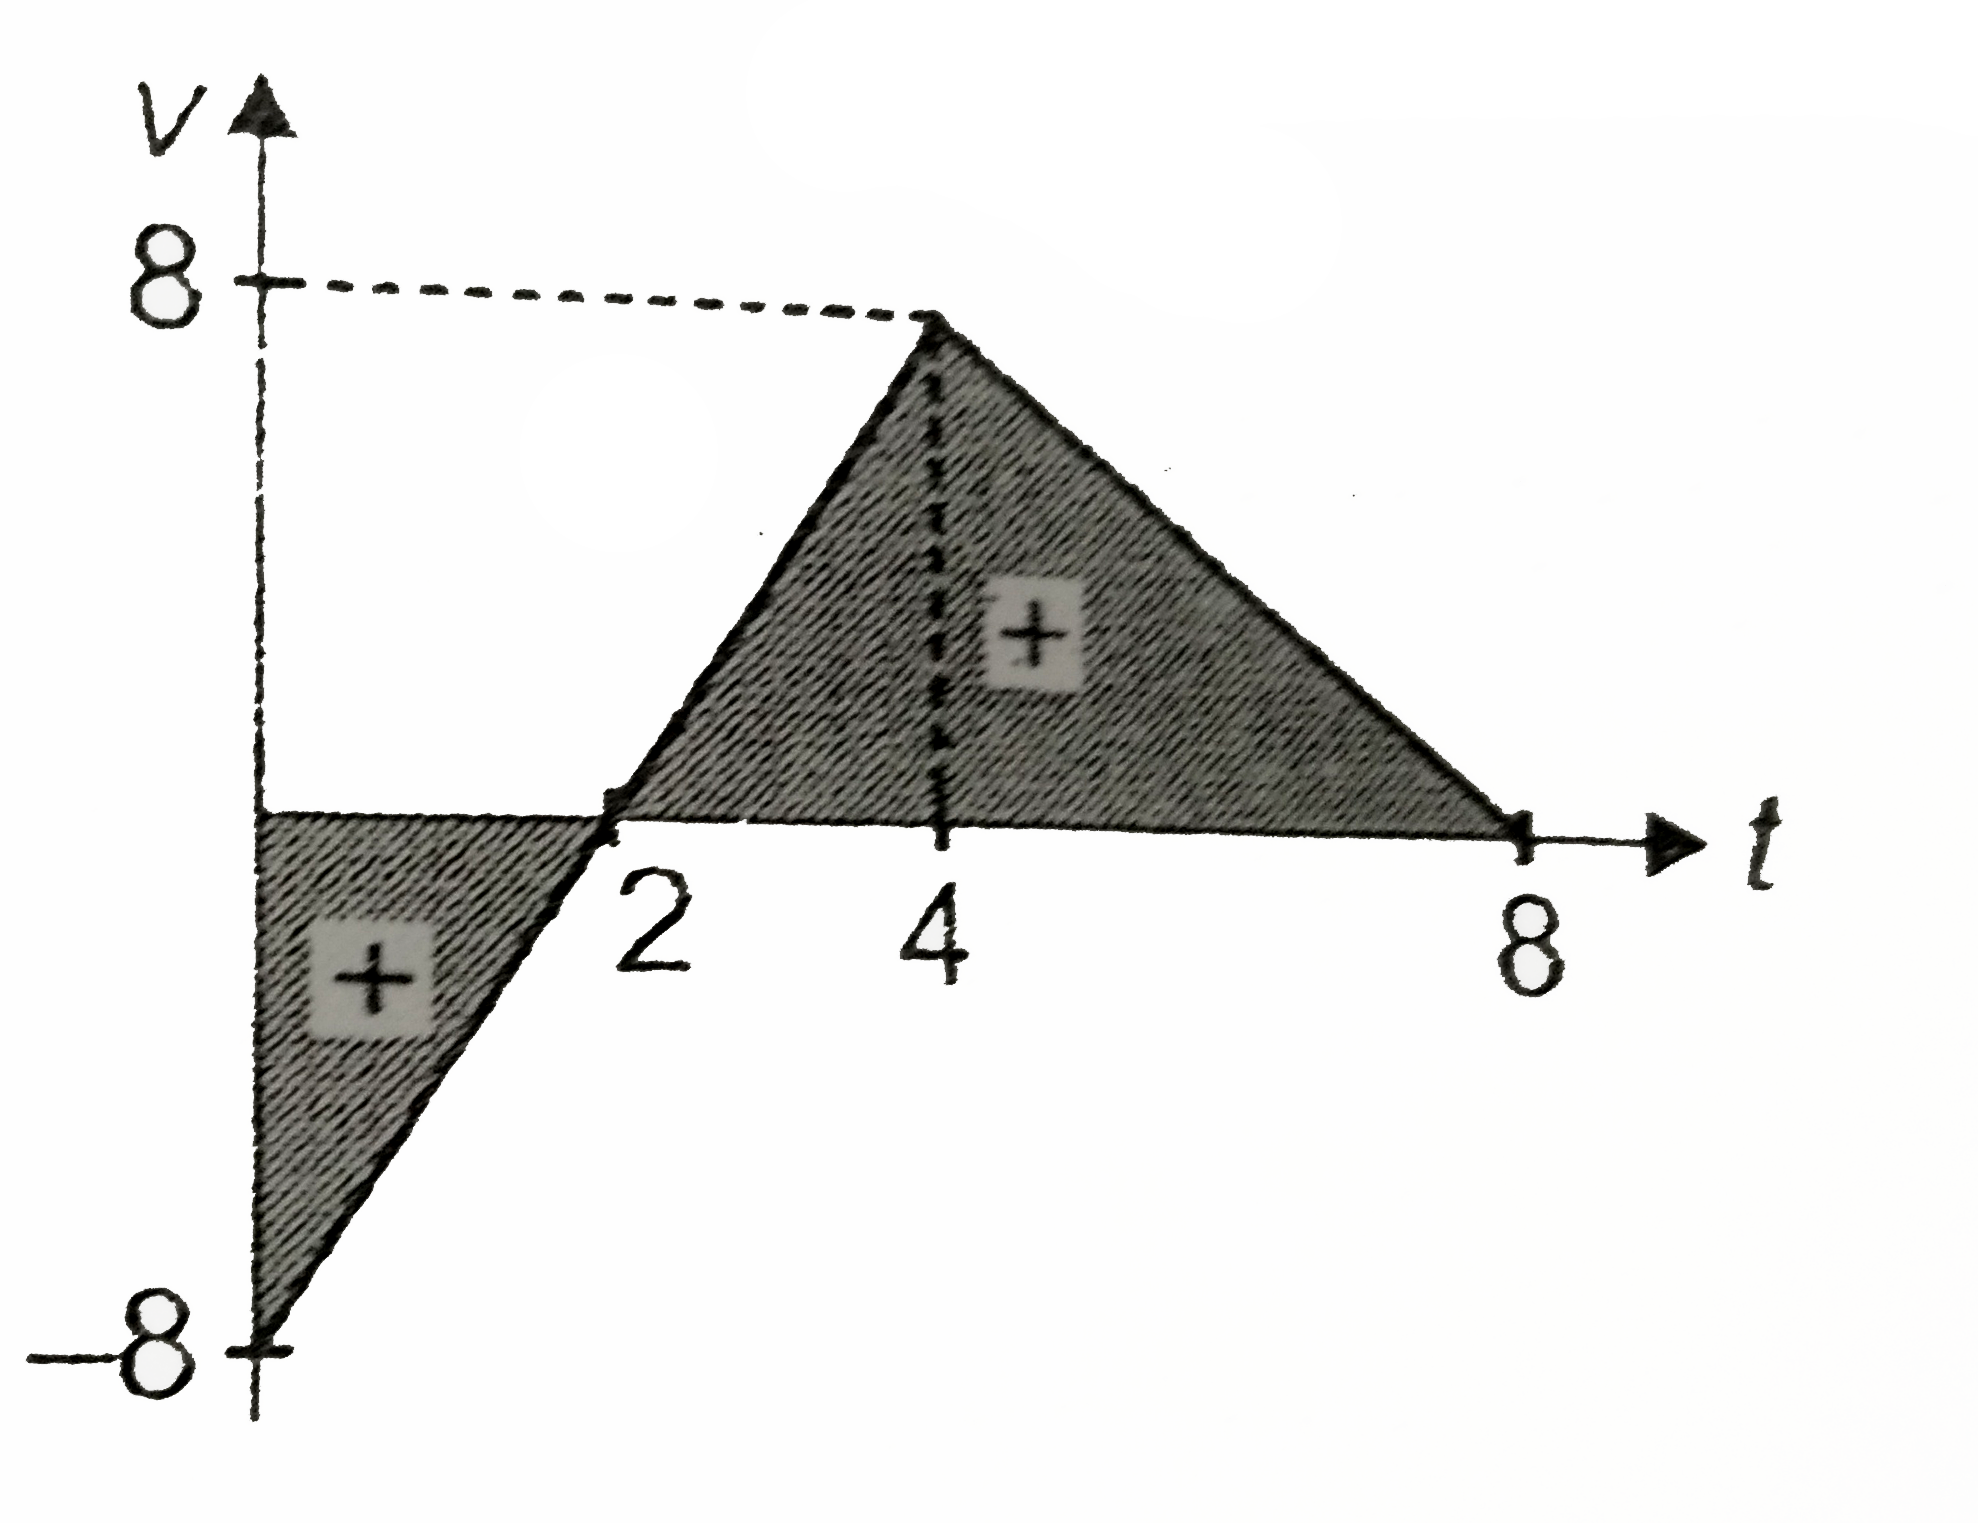
(b) Distance in the interval of 0 8 s is equal to the area under the graph taking the both areas (above and below time axis) positive.
Distance=(12×2×8)+(12×6×8)
= 32 m
Average speed =distancetime interval
=328=4m/s
(c) Average acceleration=change in velocitytime interval
change in velocity in the interval 0 to 4 s
= (Velocity at t = 4 s)−(Velocity at t = 0 )=8−(−8)=16m/s ltbr> ⇒ Average acceleration=164=4m/s2
(d)
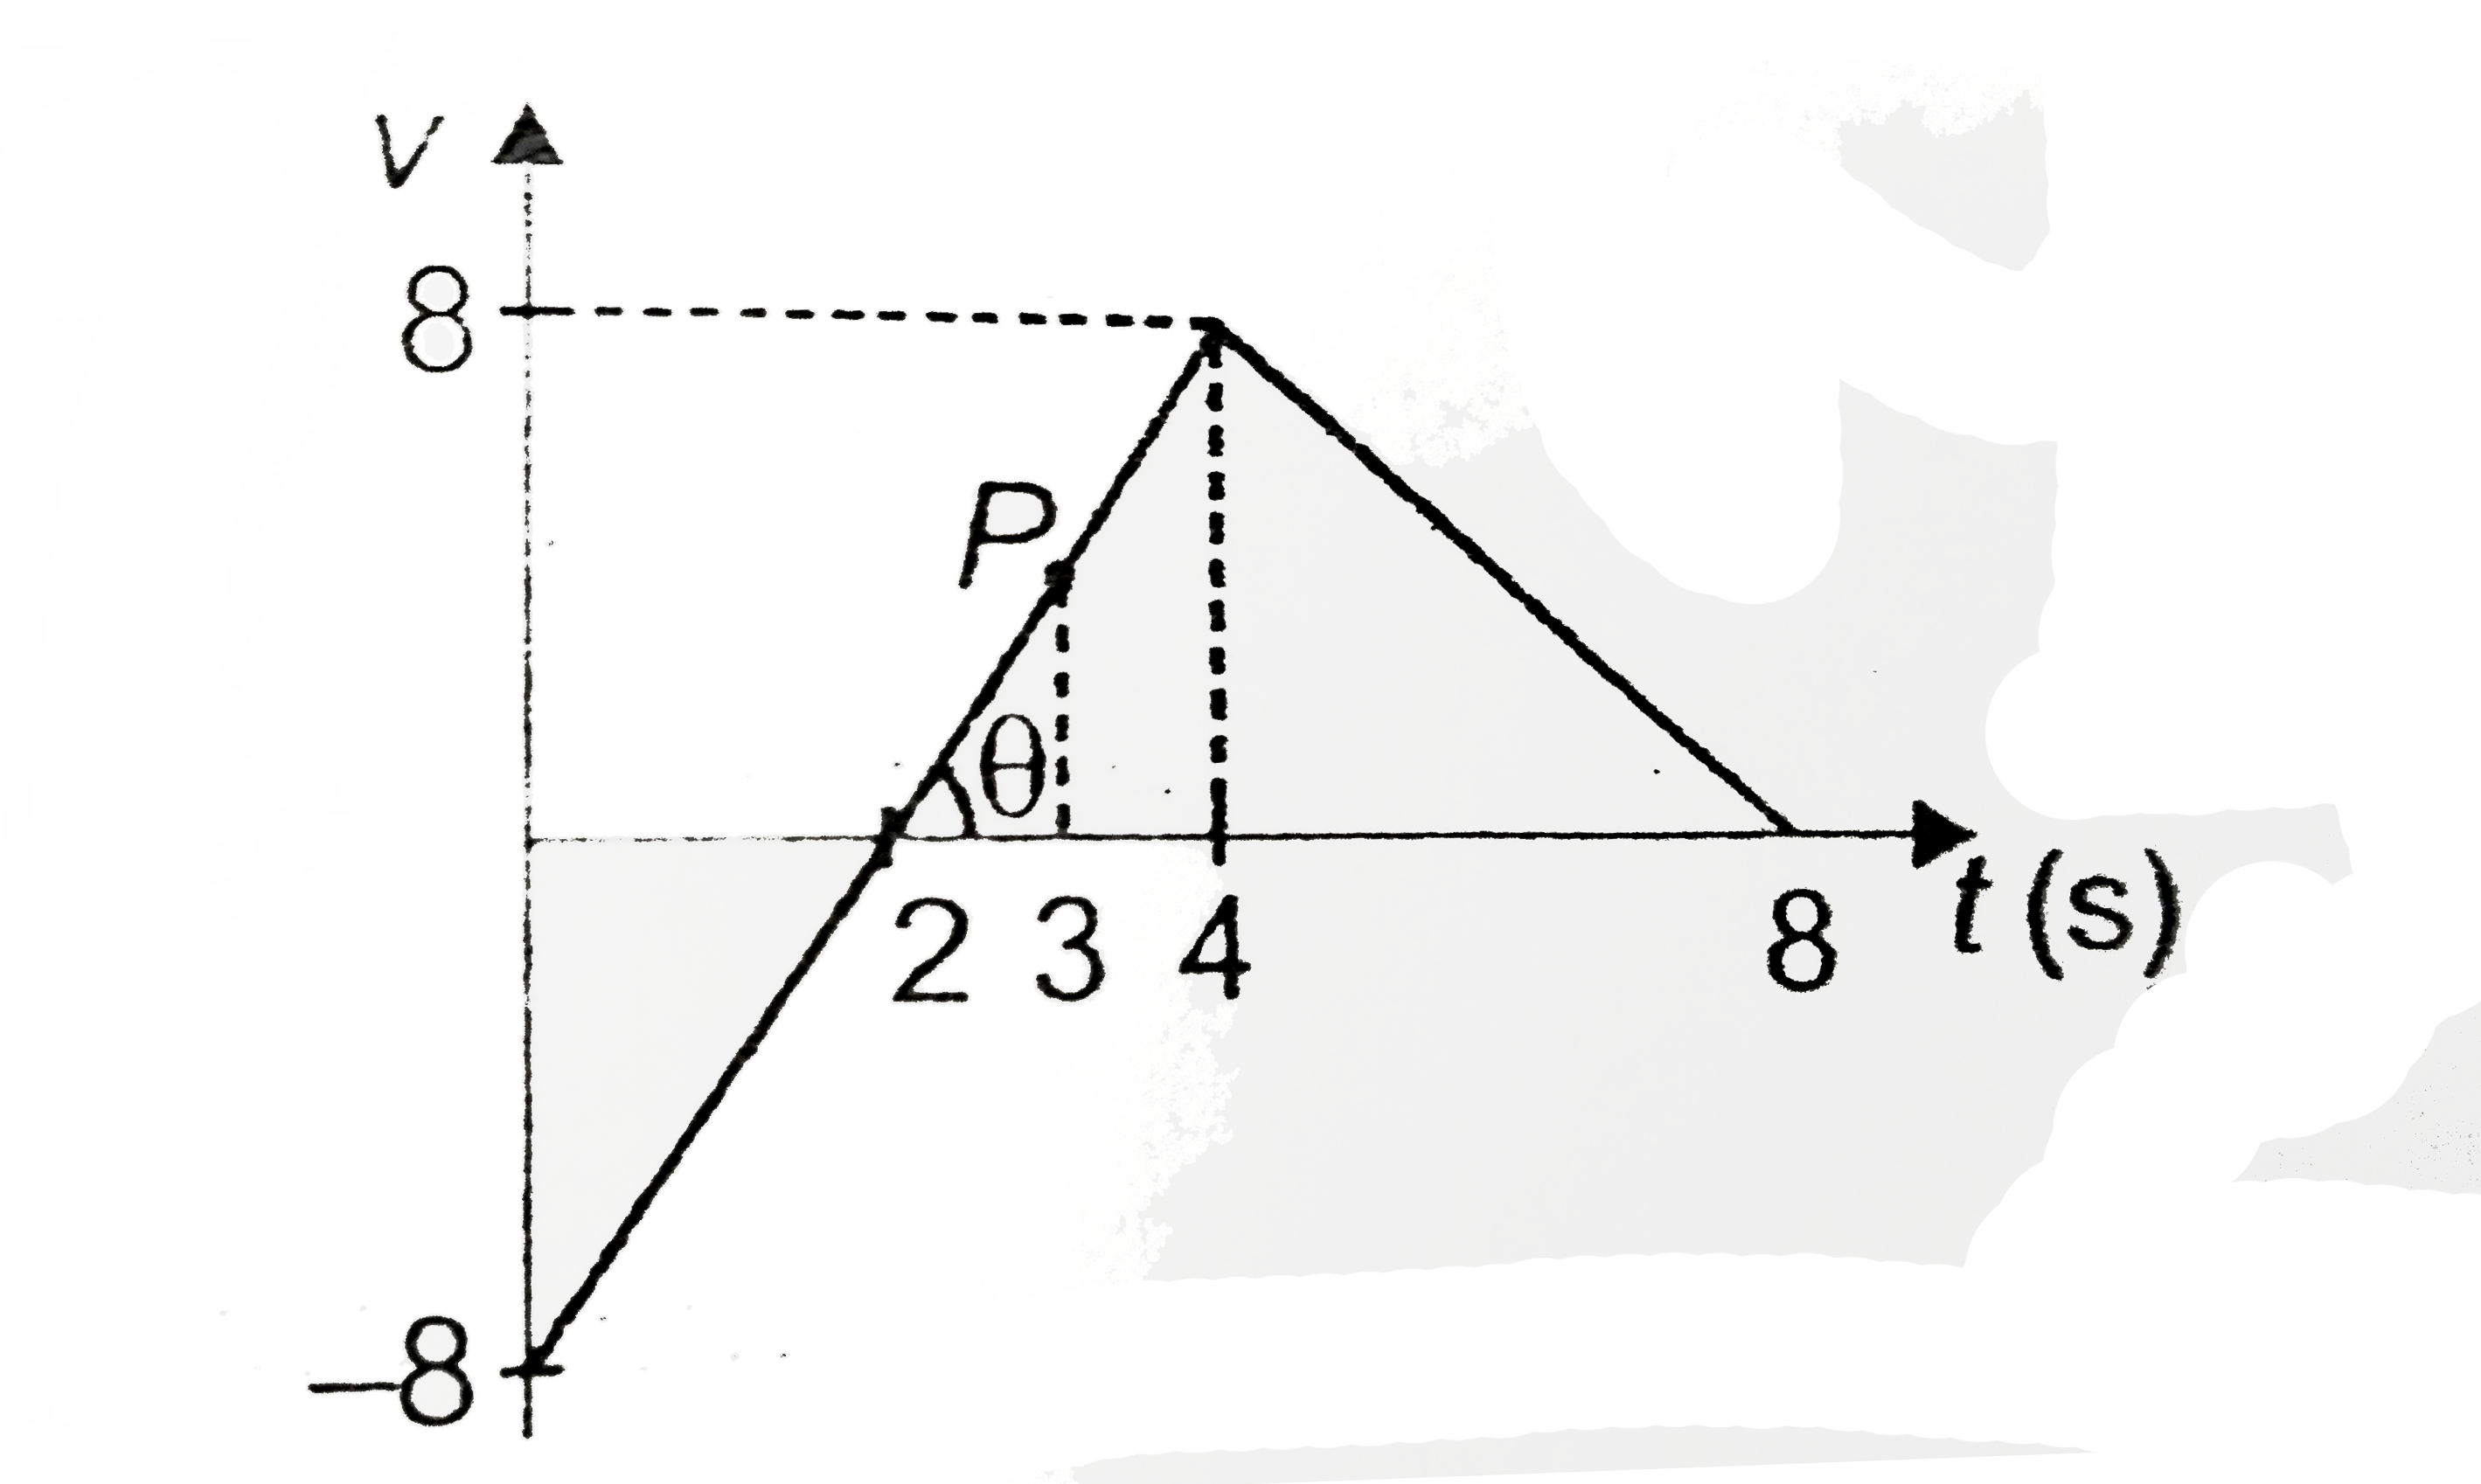
Instantaneous acceleration at t = 3 s is the slope of graph at point
P=tanθ=82=4m/s2
Topper's Solved these Questions
- MOTION IN STRAIGHT LINEBOOK - AAKASH INSTITUTE ENGLISHCHAPTER - MOTION IN STRAIGHT LINEEXERCISE - Try Yourself
40 Videos
- MOTION IN STRAIGHT LINEBOOK - AAKASH INSTITUTE ENGLISHCHAPTER - MOTION IN STRAIGHT LINEEXERCISE - Assignment (SECTION - A)
50 Videos
- MOTION IN A STRAIGHT LINEBOOK - AAKASH INSTITUTE ENGLISHCHAPTER - MOTION IN A STRAIGHT LINEEXERCISE - ASSIGNMENT (SECTION - D)
15 Videos
- MOVING CHARGE AND MAGNESIUMBOOK - AAKASH INSTITUTE ENGLISHCHAPTER - MOVING CHARGE AND MAGNESIUMEXERCISE - SECTION D
16 Videos
Similar Questions
The velocity (v)-time (t) graph of a partide moving along a straight line is as shown in the figure. The displacement of the particle from t = 0 to t = 4 is
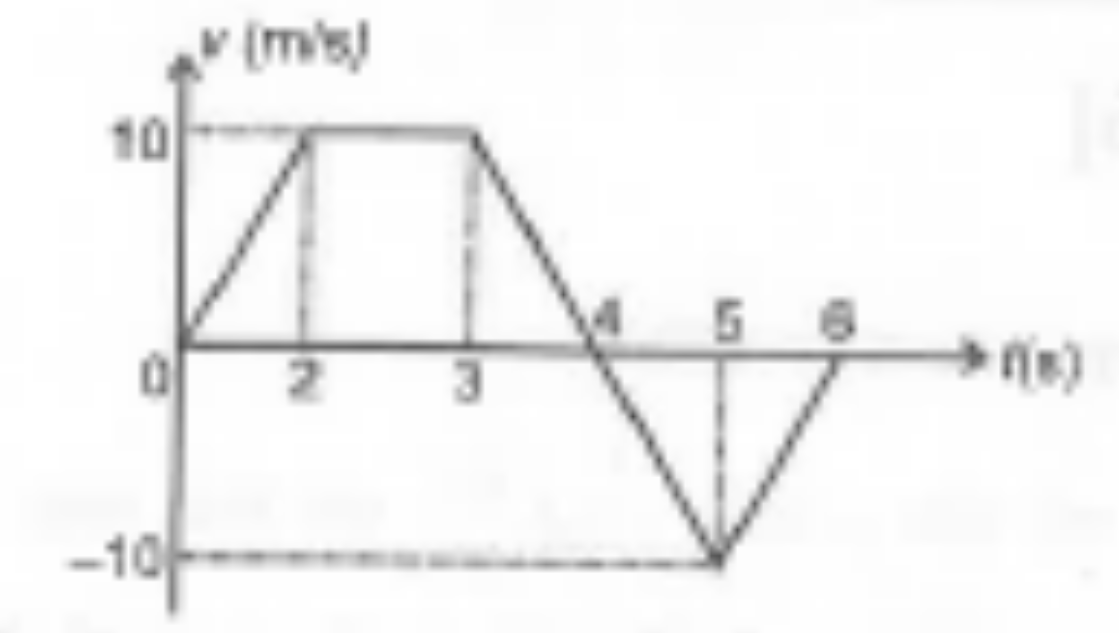
View SolutionThe velocity (v) - time (t) graph for a particle moving along x -axis is shown in the figure.The average velocity in the time interval t=0 to t=8s is
1)4.5ms
2) 2.5ms
3) 5ms
4)2ms
View SolutionPosition-time graph for a particle moving along x− direction is as shown in the figure. Average speed of the particle from t=0 to t=4 is :

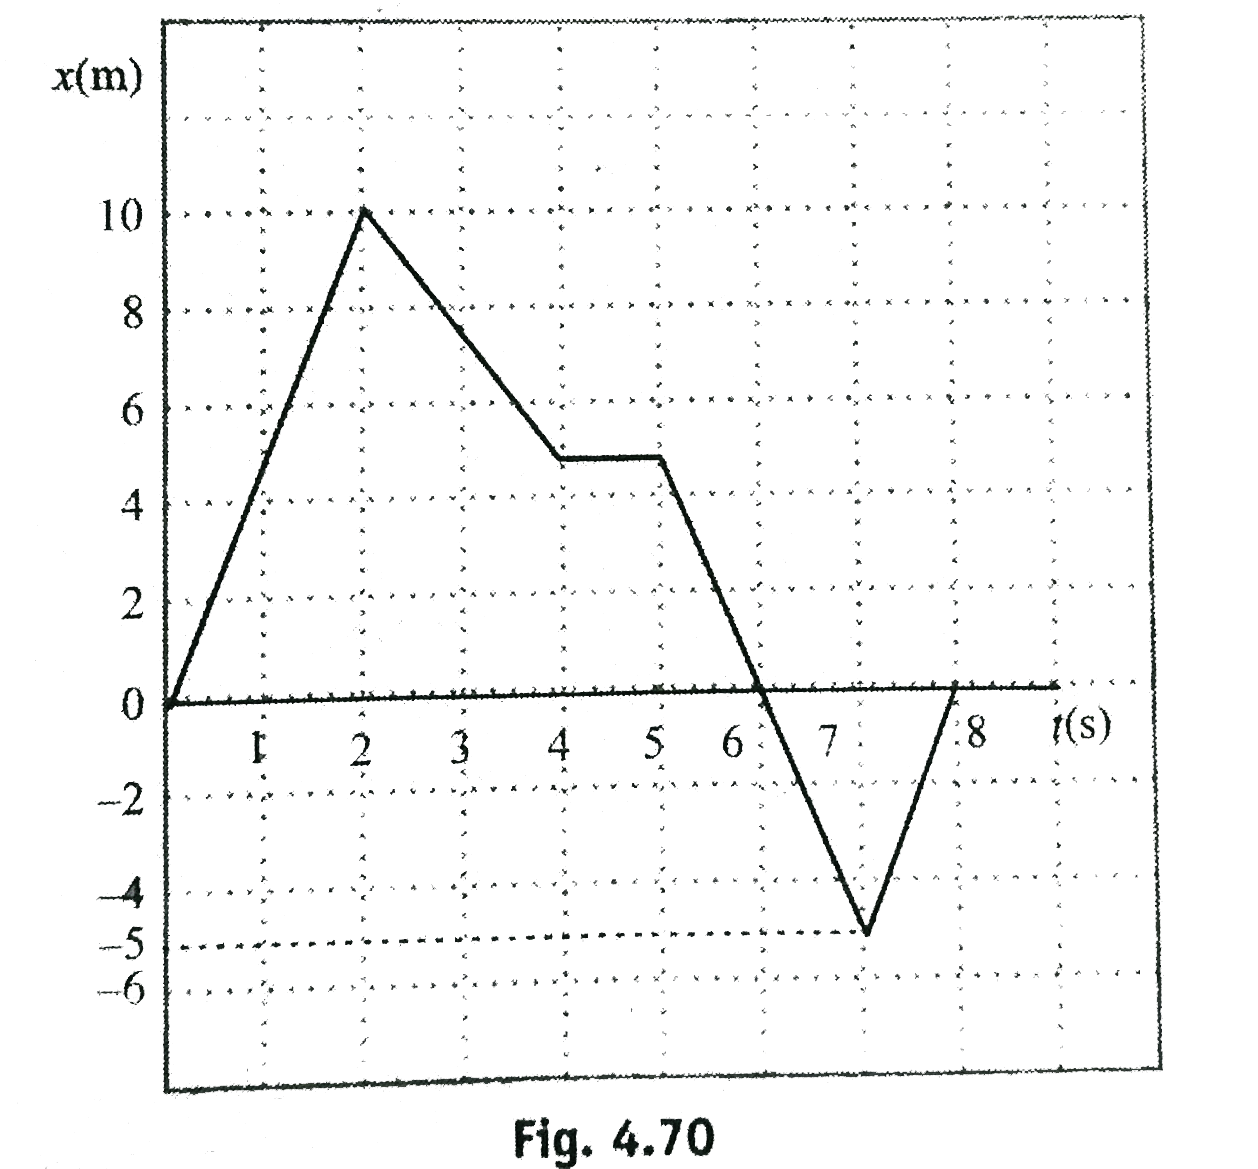
View SolutionThe position verus time graph time graph for a certain particle moving along the x-axis is shown in . Find the average velocity in the time intervals (a) 0 to 2s, (b) 2s to 4s, and (c) 4,s to 7s,
 .
.
View Solutioni) Find the average velcity in the time intervals
a) 0 to 2 s, b) 0 to 4 s, c)2s to 4s
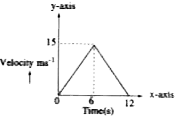
View SolutionThe velocity and time graph for a particle moving in a straight line s shown in the figure. Then, the average velocity between t=4 s and t=6 s is _____
View SolutionA particle is moving in a straight line. Its displacement at any instant t is given by x=10t+15t3, where x is in meters and t is in seconds. Find
(i) the average acceleration in the intervasl t = 0 to t = 2s and
(ii) instantaneous acceleration at t = 2 s.
View Solutions-t graph of a particle in motion is shown in Fig. Calculate
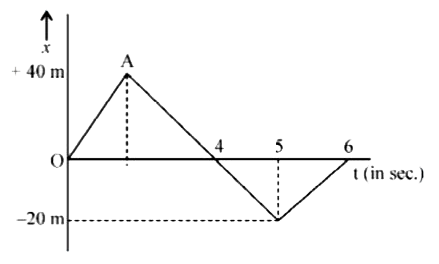
Average speed
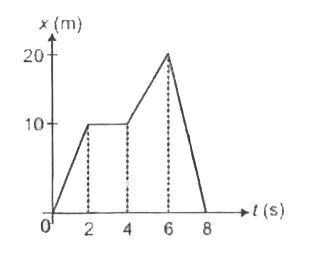
View SolutionThe position (x) - time (t) graph for a particle moving along a straight line is shown in figure. The average speed of particle in time interval t = 0 to t = 8 s is
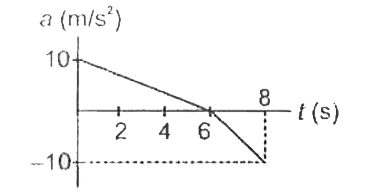
View SolutionThe acceleration - time graph for a particle moving along x - axis is shown in figure, If the initial velocity of particle is −5m/s, the velocity at t = 8 s is
View Solution
