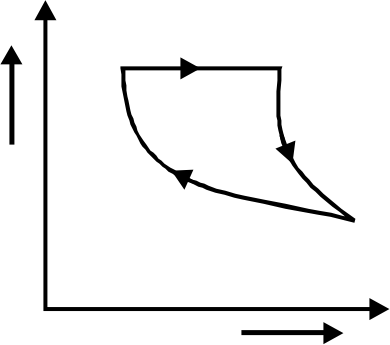
Indicator Diagram
P-T curve
P-V curve
V-T curve
Q-T curve
The correct Answer is:B
Step by step video & image solution for Indicator Diagram by Physics experts to help you in doubts & scoring excellent marks in Class 12 exams.
Updated on:21/07/2023Topper's Solved these Questions
- THERMODYNAMICSBOOK - AAKASH INSTITUTE ENGLISHCHAPTER - THERMODYNAMICSEXERCISE - Assignment (Section-B) Objective Type Questions (one option is correct)
15 Videos
- THERMODYNAMICSBOOK - AAKASH INSTITUTE ENGLISHCHAPTER - THERMODYNAMICSEXERCISE - Assignment (Section-C) Objective Type Questions (More than one option are correct)
11 Videos
- THERMODYNAMICSBOOK - AAKASH INSTITUTE ENGLISHCHAPTER - THERMODYNAMICSEXERCISE - Try Youself
13 Videos
- THERMAL PROPERTIES OF MATTERBOOK - AAKASH INSTITUTE ENGLISHCHAPTER - THERMAL PROPERTIES OF MATTEREXERCISE - Assignment (Section-J) Akash Challengers Questions
7 Videos
- UNITS AND MEASUREMENTSBOOK - AAKASH INSTITUTE ENGLISHCHAPTER - UNITS AND MEASUREMENTSEXERCISE - ASSIGNMENT (SECTION - D)
15 Videos
Similar Questions
For a given thermodynamic cyclic process, P−V indicator diagram is as shown in the figure. Process AB,BC&CA are isobaric, & isothermal respectively. Then which of the following curve represent correc V−T indicator diagram for the process ABCA?
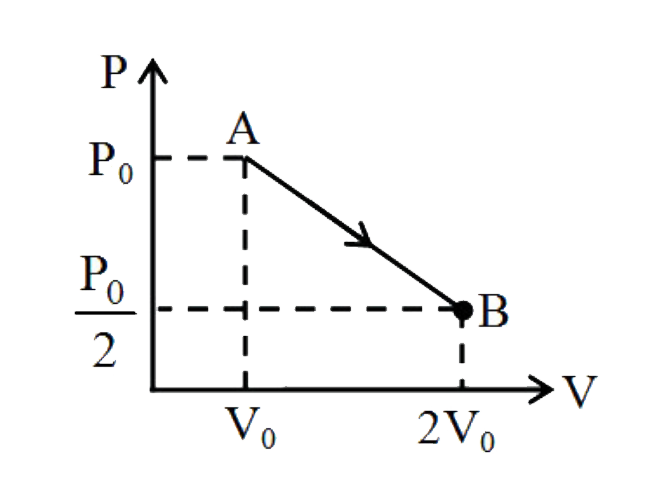
View SolutionAn ideal monoatomic gas undergoes an expansion from state A to state B following a process which is shown in the indicator diagram. If initially during the expansion, the gas was absorbing heat and later on it was rejecting heat, then what was the volume of the gas when it started rejecting the heat?
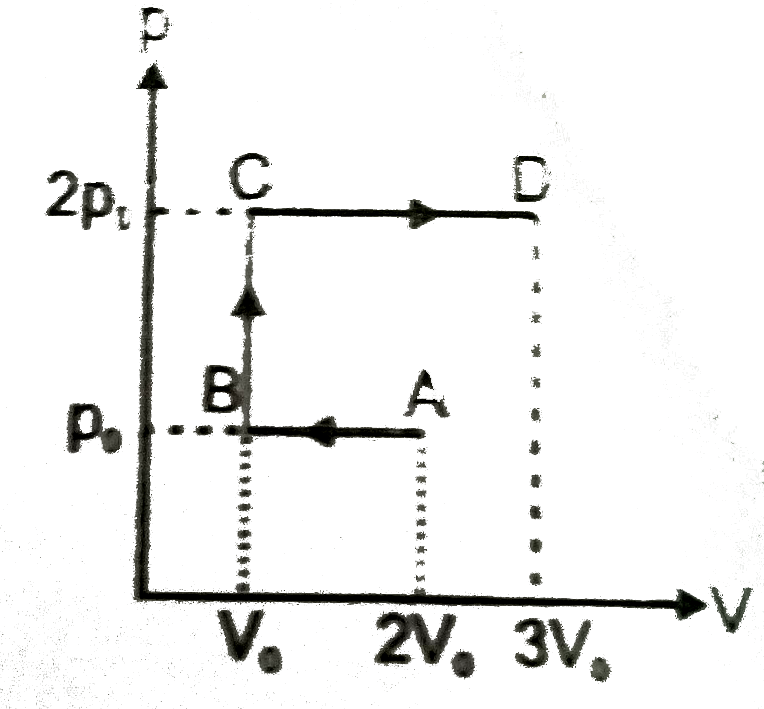
View SolutionP−V indicator diagram for a given sample of monoatomic ideal gas is shown in figure. If the average molar specific heat capacity of the system for the process ABCD is xR4 than find value of x:(R is a universal gas constant)
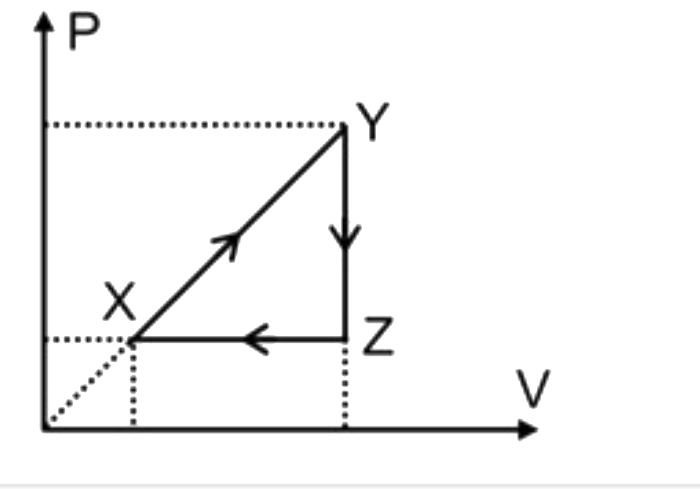
View SolutionIn the show indicator diagram over pressure - volume scales 'n' moles of an ideal gas is cycled . If the temperature of the gas in the state X and Y are respectively TXandTY . Temperature of the gas in the state Z is the (All temperature are in absolute scale )
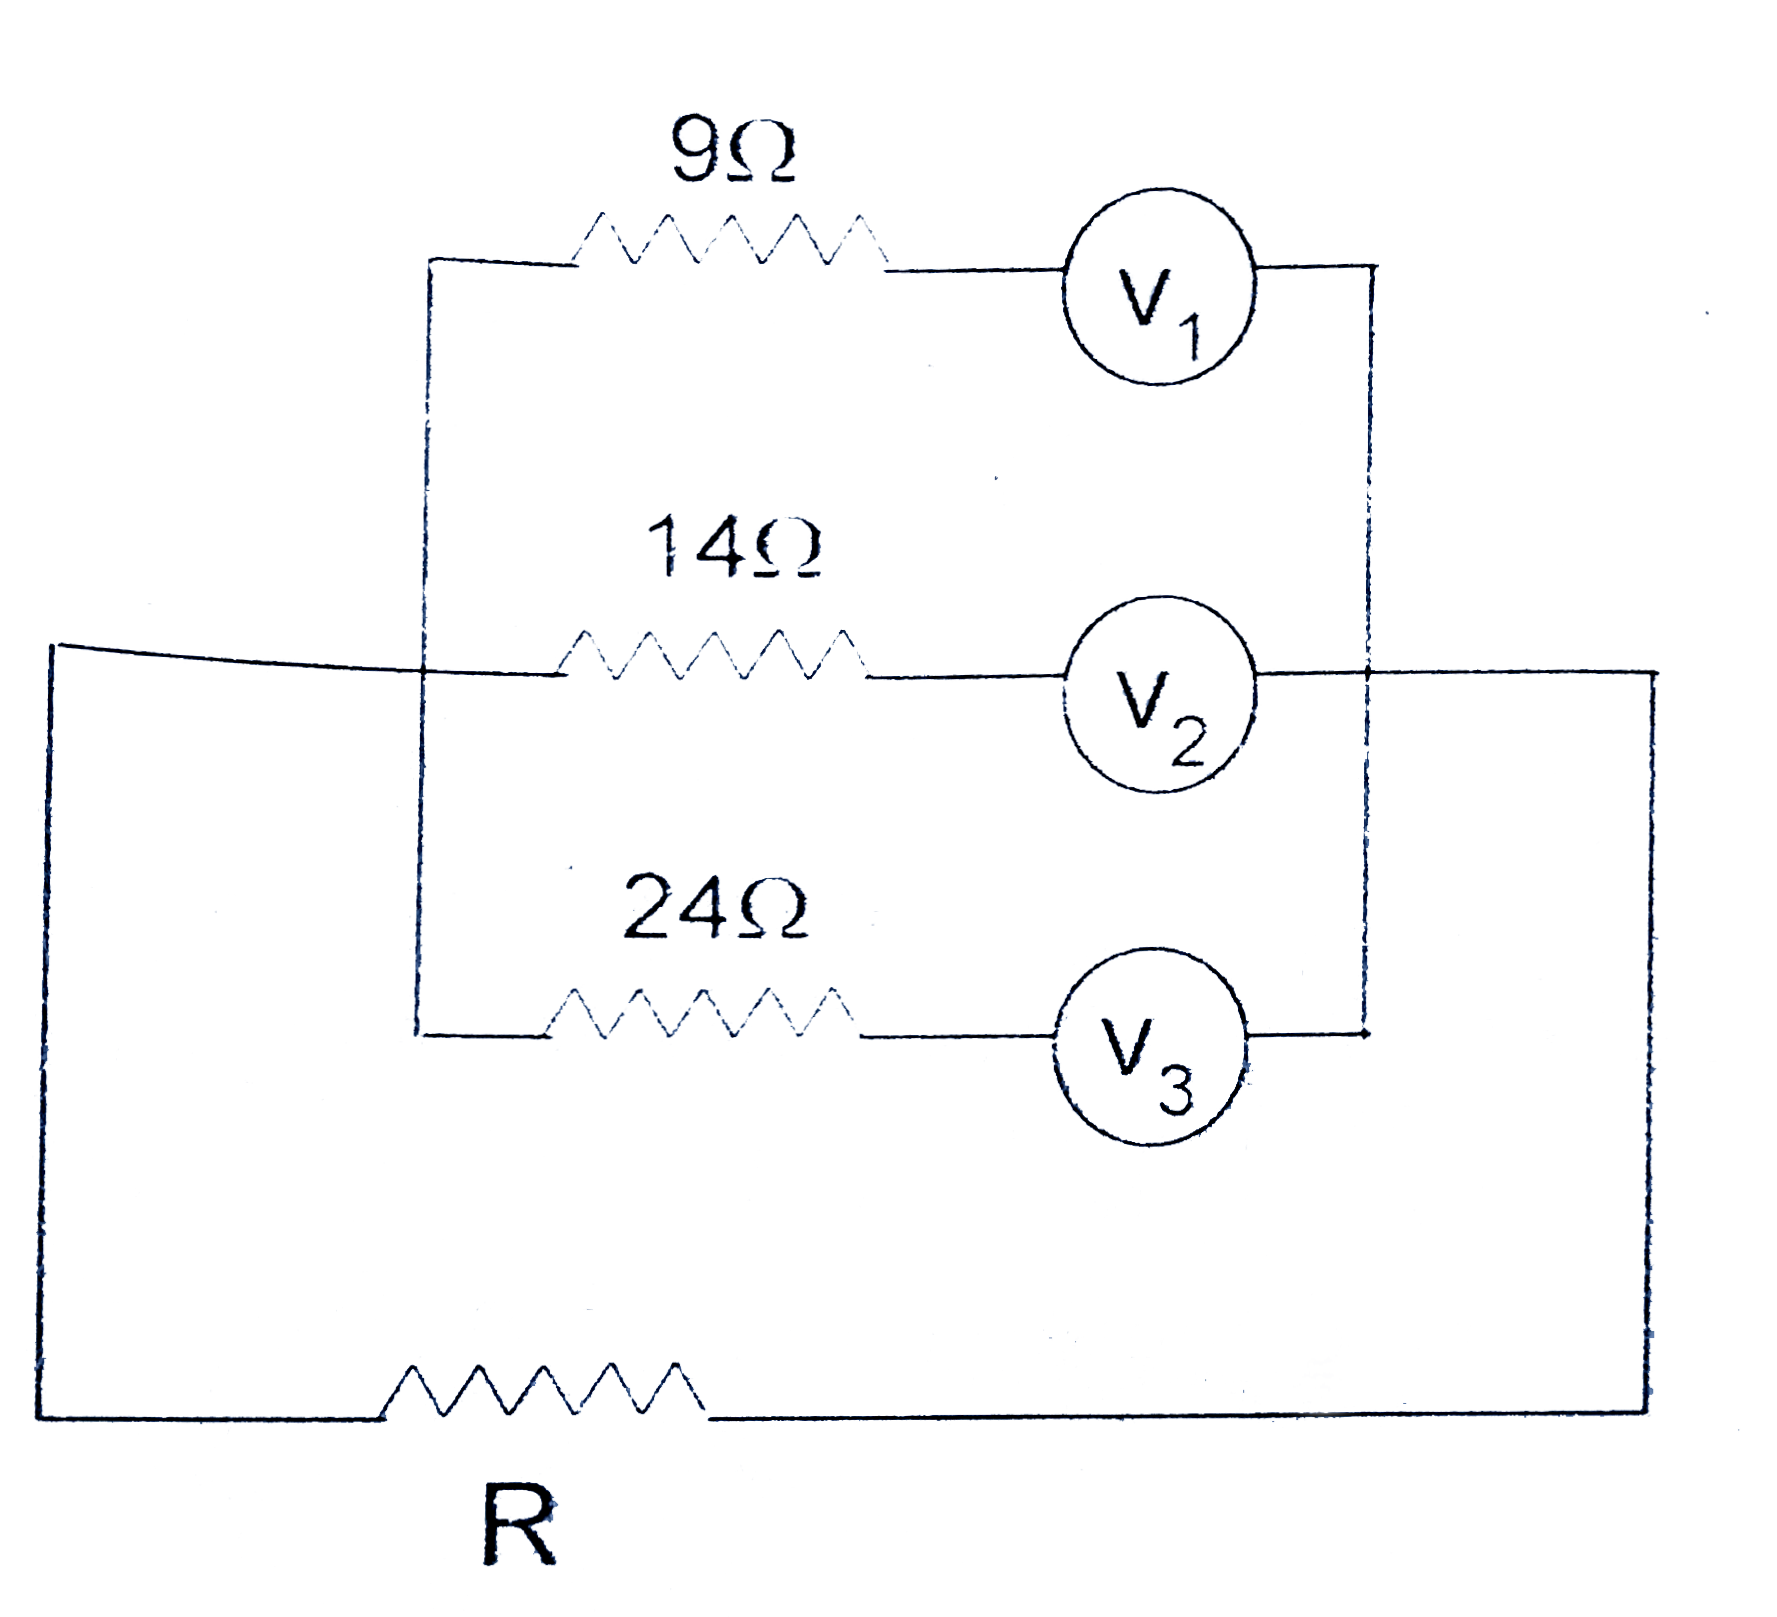
View SolutionThe figure shows a portion of a circuit. Resistor are known and indicated on diagram and voltmeter are identical. If voltmeters v1 and v2 reads 7.5v and 5v respecticely then reading of v3
View SolutionThat type of crystal defect is indicated in the diagram below

View SolutionDraw a diagram to show the energy changes in an oscillating simple pendulum. Indicate in your diagram how the total mechanical energy in it remains constant during the oscillation.
View SolutionGiven alongside a schematic representation of the circulatory system in man. Study the same and answer the question that follows.
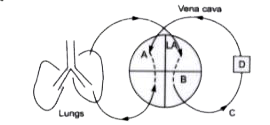
Label the parts A to D indicated in the diagram.
View SolutionDraw a diagram of a block and tackle system of pulleys having a velocity ratio of 5. in your diagram indicate clearly the points of application and the directions of the load L and effort E. also mark the tension T in each strand.
View SolutionWhat type of crystal defects is indicated in the diagram given below ?
Na+C21Na+Cl−Na+Cl−Cl−□□Cl−Na+Cl−Cl−Na+Cl−Na+Na+□
View Solution
