The plots of intensity versus wavelength for three black bodies at temperatures T1,T2 and T3 respectively are shown in Their temperatures are shown in How their temperatures are related ?
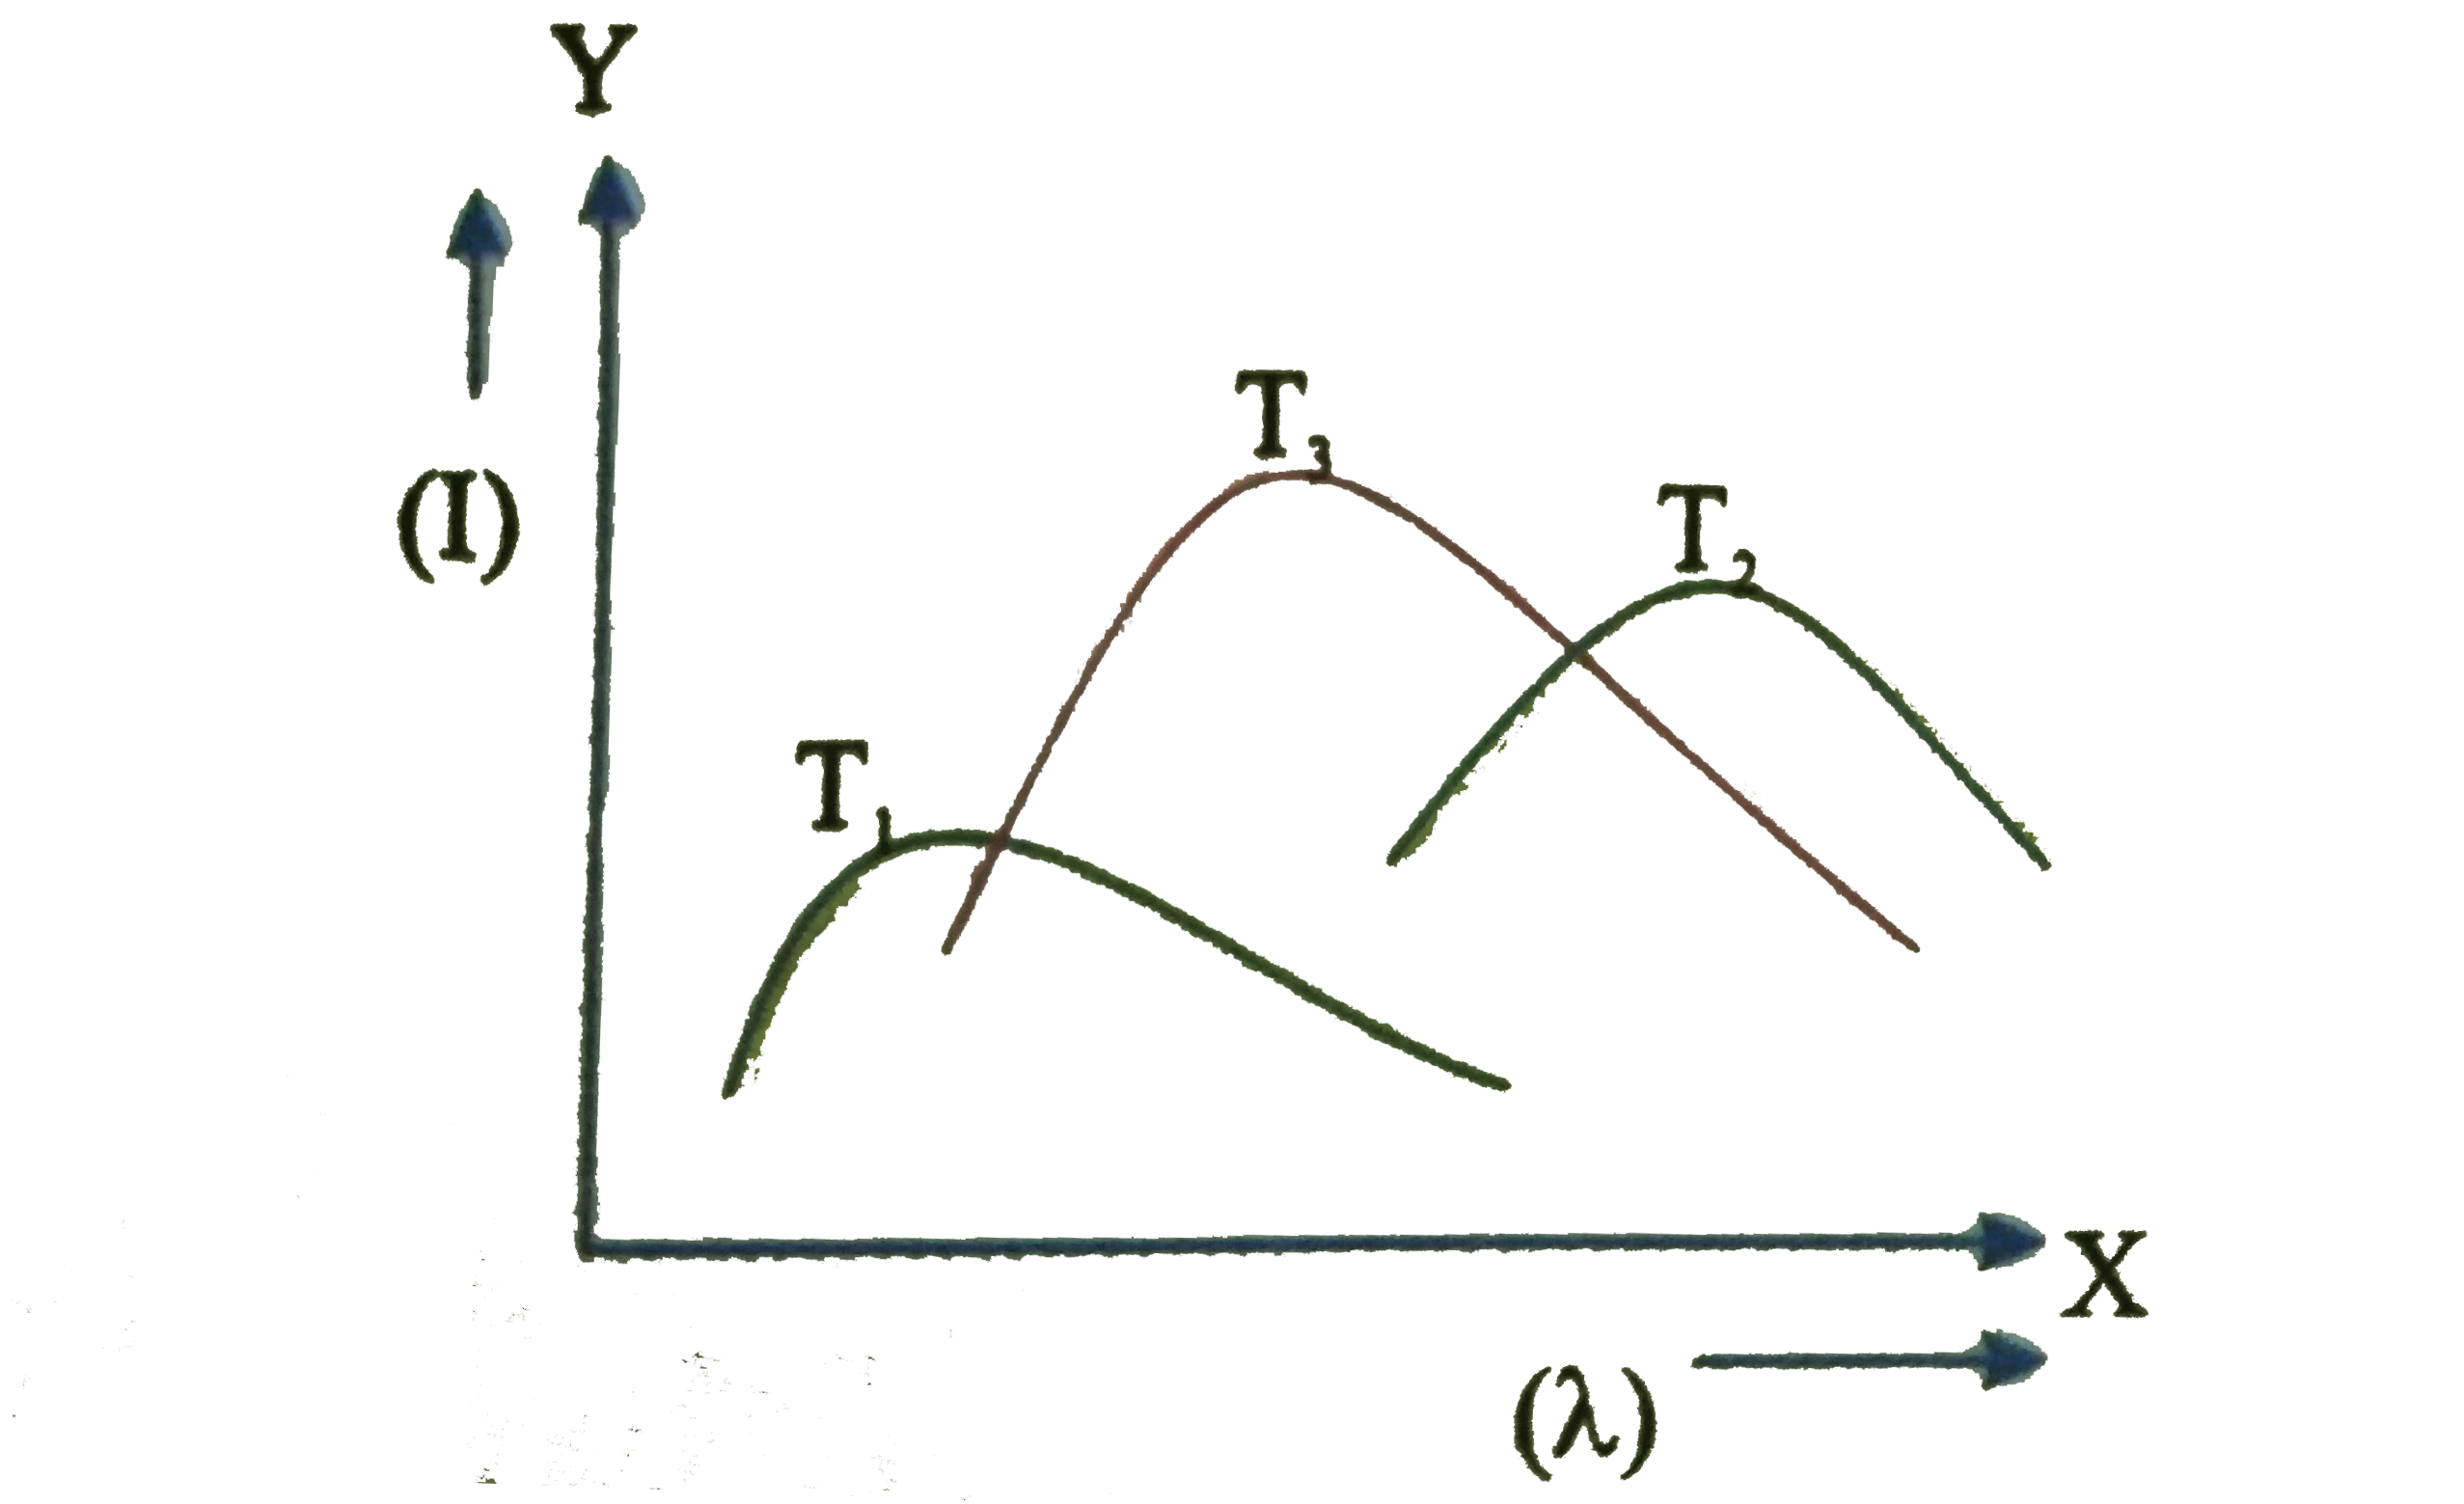 .
.
T1>T2>T3
T1>T3>T2
T2>T3>T1
T3>T2>T1
The correct Answer is:B
Step by step video & image solution for The plots of intensity versus wavelength for three black bodies at temperatures T_(1),T_(2) and T_(3) respectively are shown in Their temperatures are shown in How their temperatures are related ? . by Physics experts to help you in doubts & scoring excellent marks in Class 12 exams.
Topper's Solved these Questions
- BOOK - AAKASH INSTITUTE ENGLISHCHAPTER - THERMAL PROPERTIES OF MATTEREXERCISE - Assignment (Section-C) Objective Type questions (More than one option are correct)12videos
THERMAL PROPERTIES OF MATTER
- BOOK - AAKASH INSTITUTE ENGLISHCHAPTER - THERMAL PROPERTIES OF MATTEREXERCISE - Assignment (Section-D) Linked Comprehension Type Questions9videos
THERMAL PROPERTIES OF MATTER
- BOOK - AAKASH INSTITUTE ENGLISHCHAPTER - THERMAL PROPERTIES OF MATTEREXERCISE - Assignment (Section-A) Objective Type questions (one option is correct)50videos
THERMAL PROPERTIES OF MATTER
- BOOK - AAKASH INSTITUTE ENGLISHCHAPTER - TEST2EXERCISE - EXERCISE2videos
TEST2
- BOOK - AAKASH INSTITUTE ENGLISHCHAPTER - THERMODYNAMICSEXERCISE - ASSIGNMENT (SECTION -D) (Assertion - Reason Type Questions)10videos
THERMODYNAMICS
Similar Questions
The plots of intensity versus wavelength for three black bodies at temperature T1,T2andT3 respectively are as shown. Their temperatures are such that
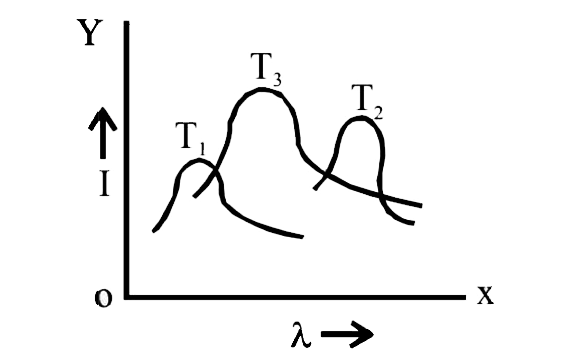 View Solution
Three isothermal plots (P versus V) A, B and C are plotted at three temperature T1,T2andT3 respectively
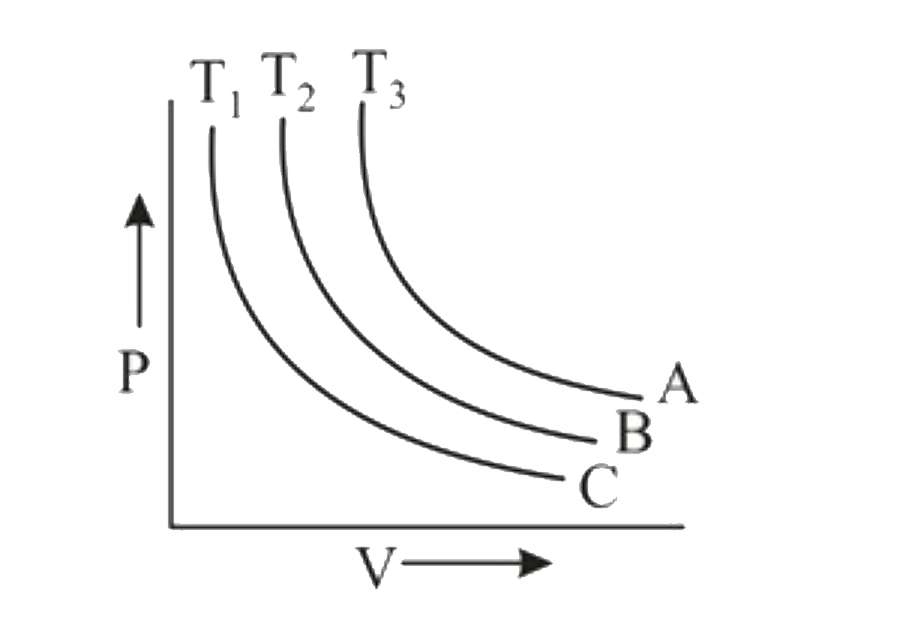
The correct order of the temperature will beView Solution
Knowledge Check
- Question 1 - Select One
The plots of intensity versus wavelength fro three black bodies at temperatures T1,T2 and T3 respectively and shown in Fig. 15.11.1. Their temperatures are such that
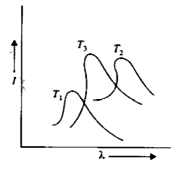 AT1>T2>T3BT1>T3>T2CT2>T3>T1DT3>T2>T1
 - Question 2 - Select One
The isothermal diagram of a gas at three different temperatures T1,T2andT3, is show in the given figure .Then
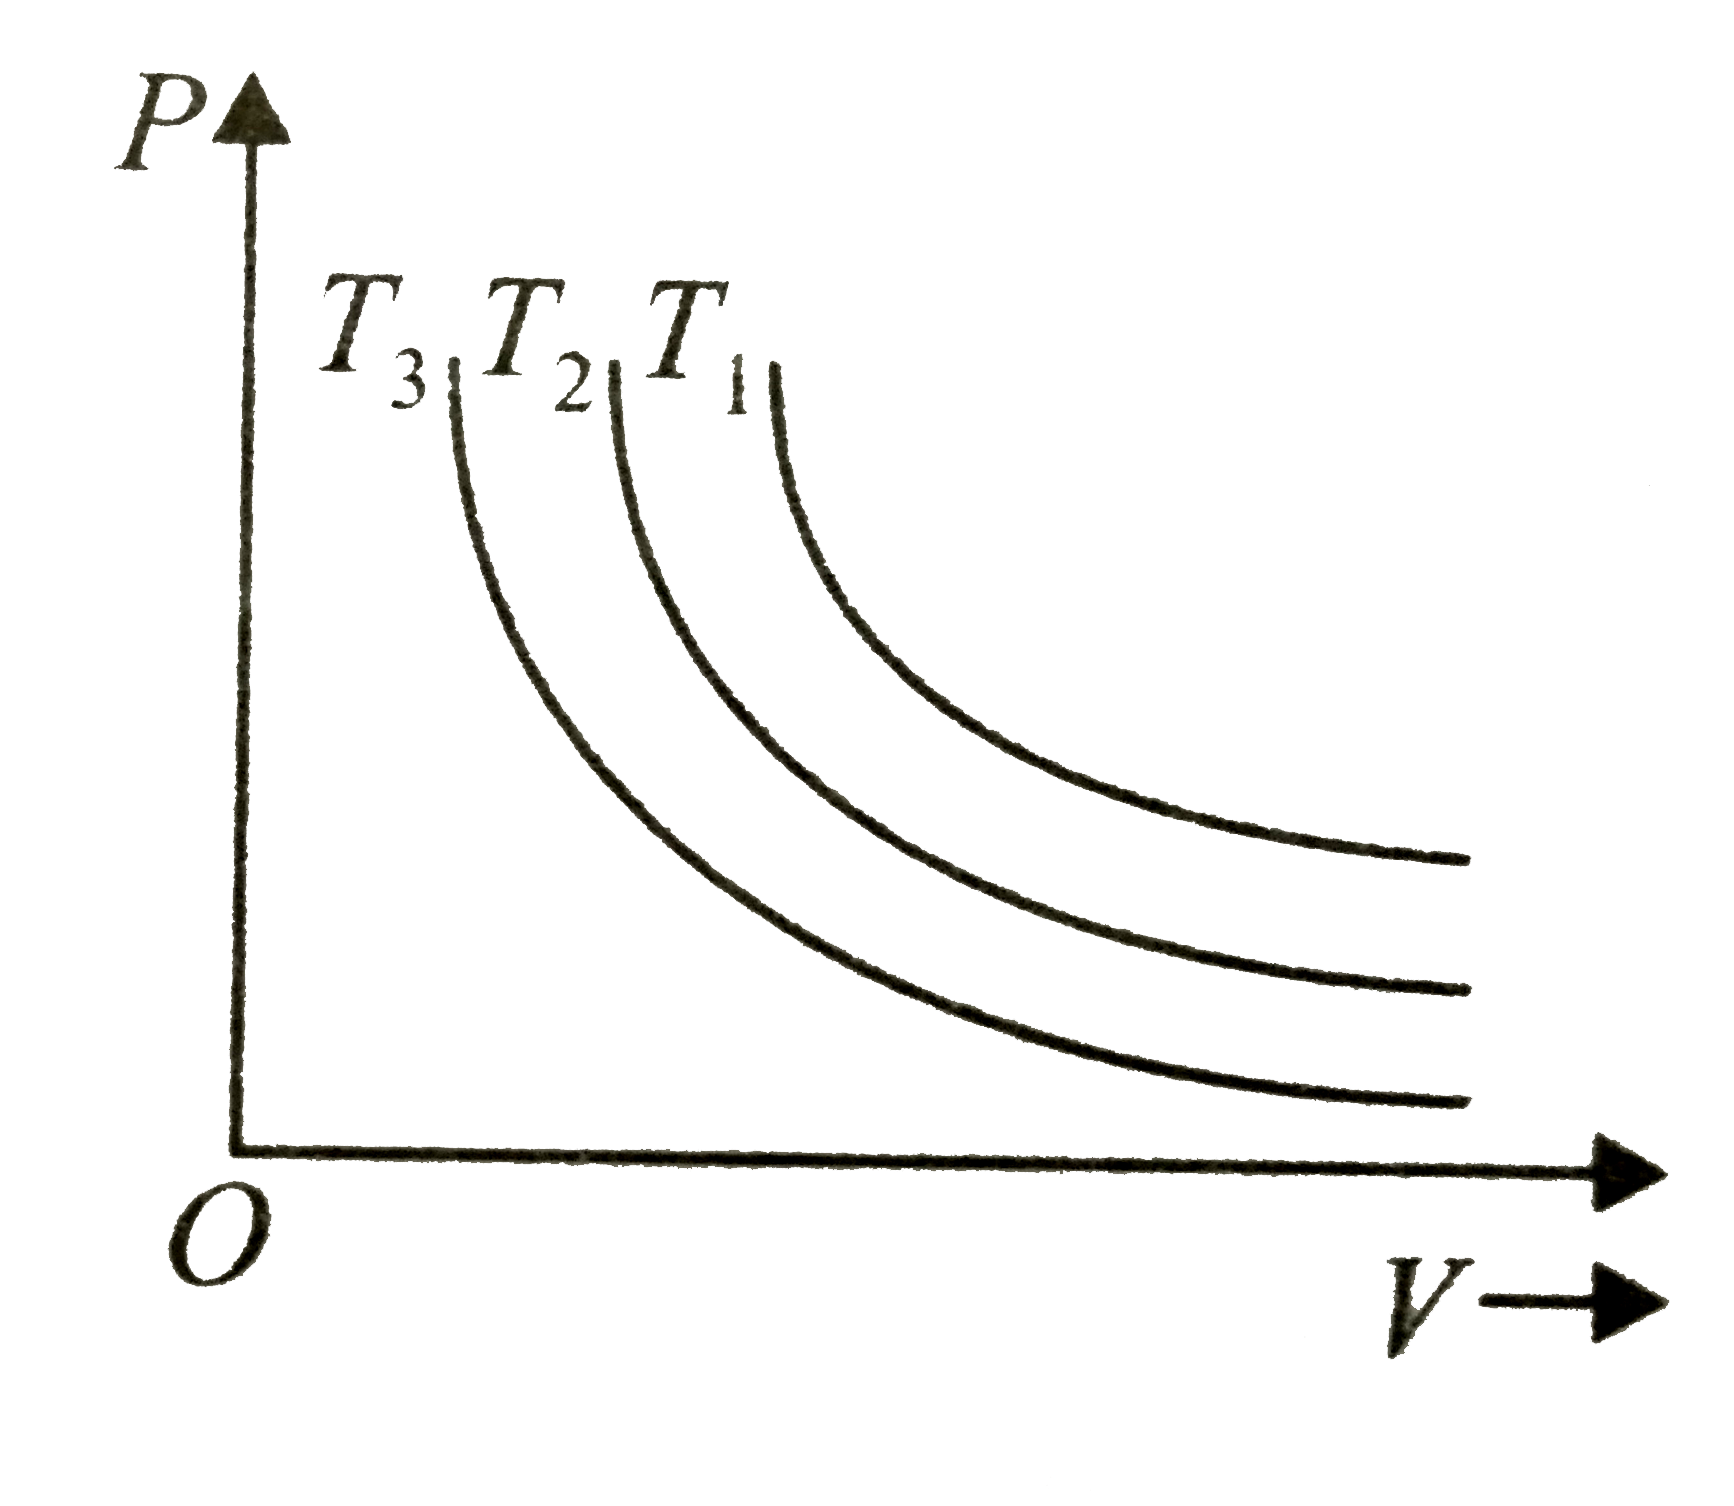 Aa.T1<T2<TBb. T1<T2>T3Cc.T1>T2>T3Dd.T1>T2<T3
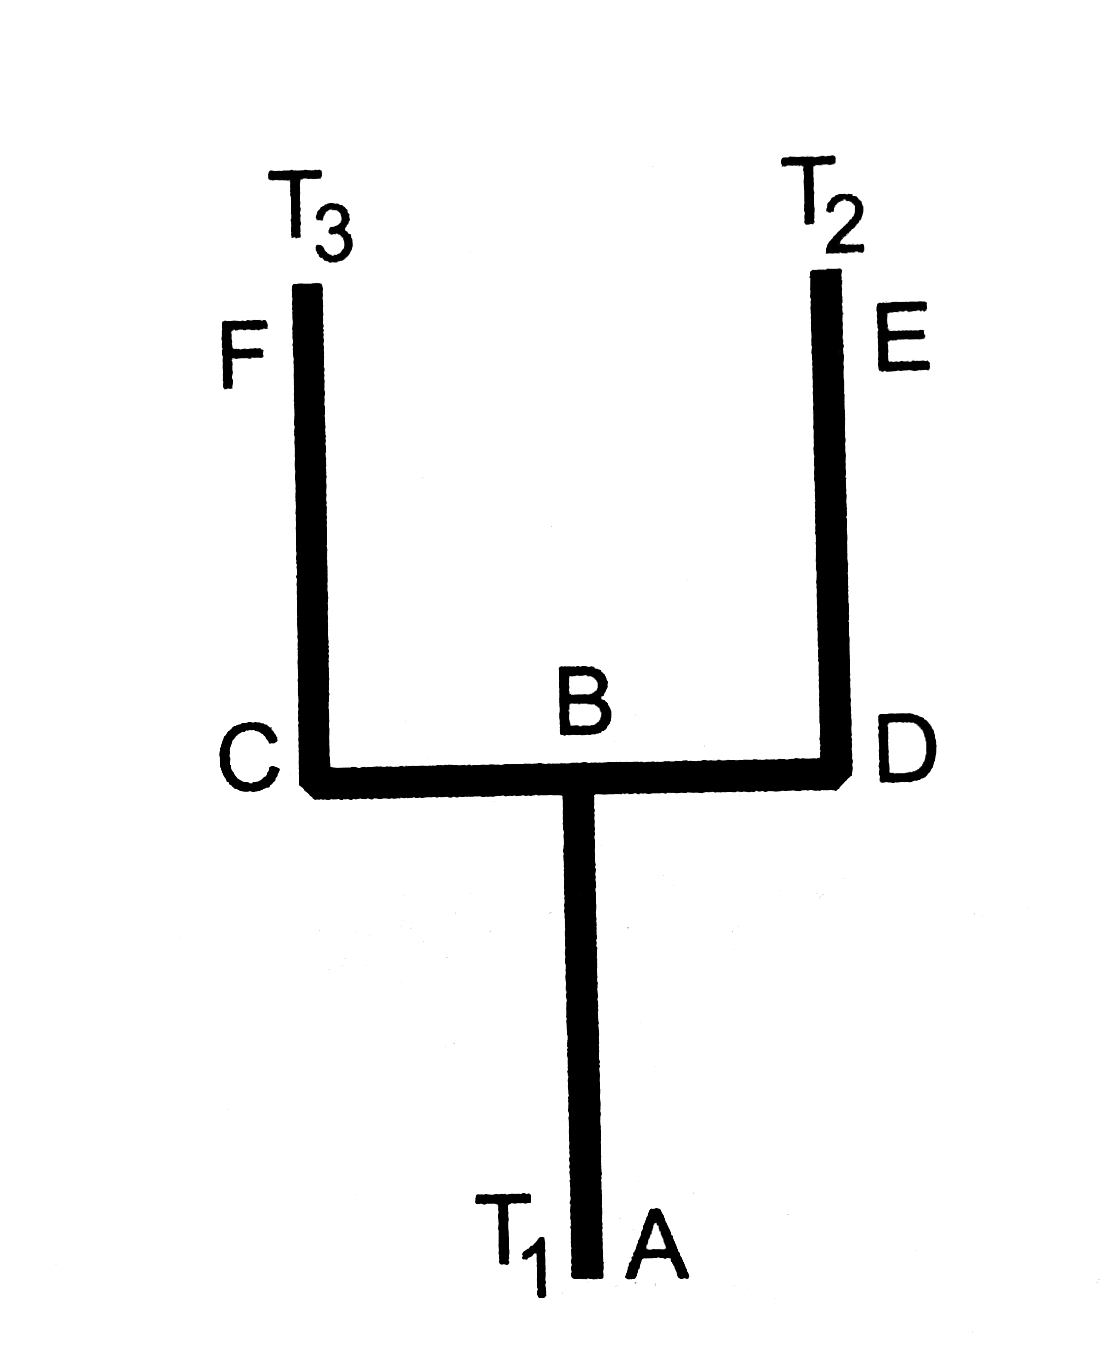
Four identical rods AB,CD,CFandDE are joined as shown in figure. The length, cross-sectional area and thermal conductivity of each rod are l,AandK respectively. The ends A,EandF are maintained at temperature T1 , T2 and T3 respectively. Assuming no loss of heat to the atmosphere, find the temperature at B.
 View Solution
Four identical rods AB, CD, CF and DE are joined as shown in figure. The length, cross-sectional area and thermal conductivity of each rod are l, A and K respectively. The ends A, E and F are maintained at temperature T1 , T2 and T3 respectively. Assuming no loss of heat to the atmosphere, find the temperature at B.
 View Solution
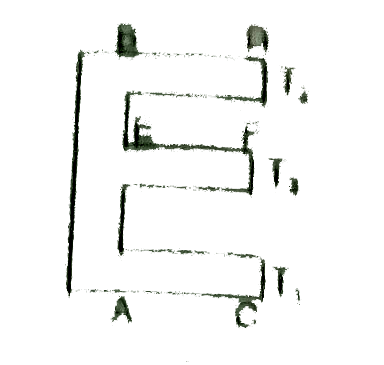
Four thin identical rods AB,AC,BD and EF made of the same material are joined as shown. The free-ends C,D and F are maintained at temperature T1,T2 and T3 respectively. Assuming that there is no loss of heat of the surroundings, the temperature at joint E when the steady state is attained is 1K(2T1+2T2+3T3). Find K(E is mid point of AB)
 View Solution
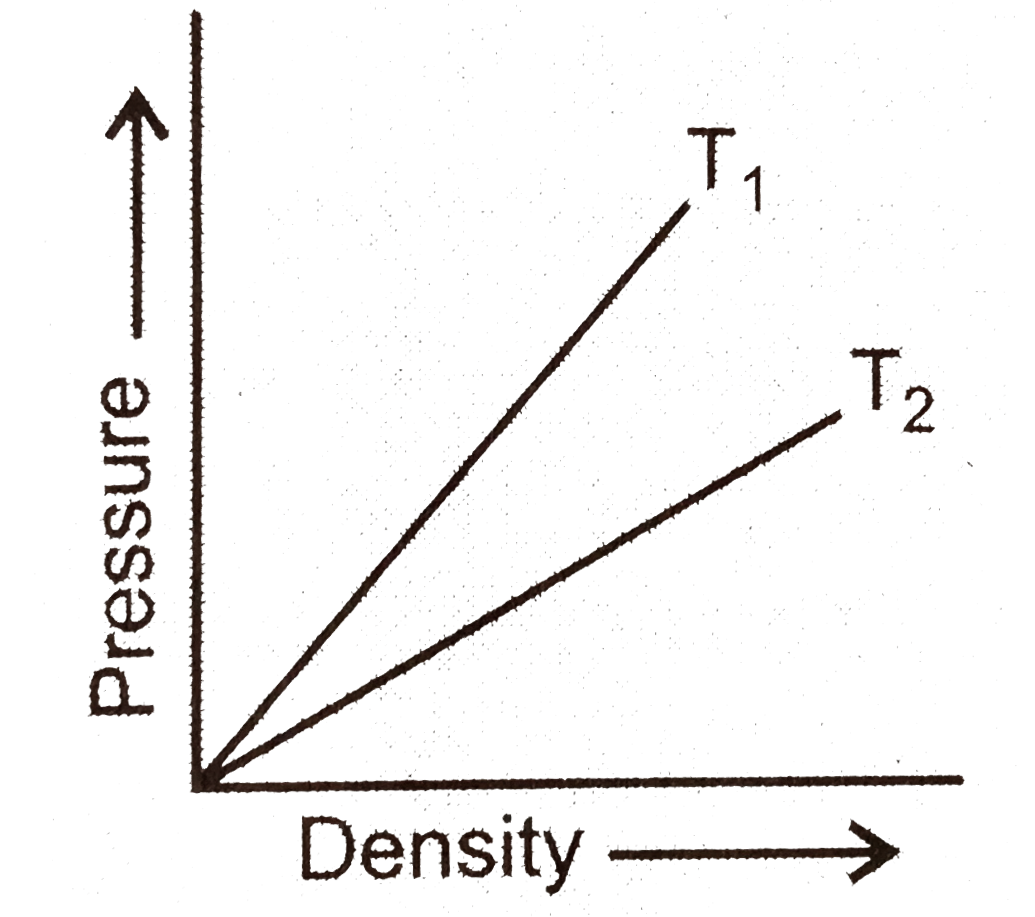
Figure shows graphs of pressure versus density for an ideal gas at two temperatures T1 and T2 Which is correct ?
 .View Solution
I-V graph for a metallie wire at two different tempearture, T1andT2 is as shown in the figure. Which of the two temperatures is lower and why ?
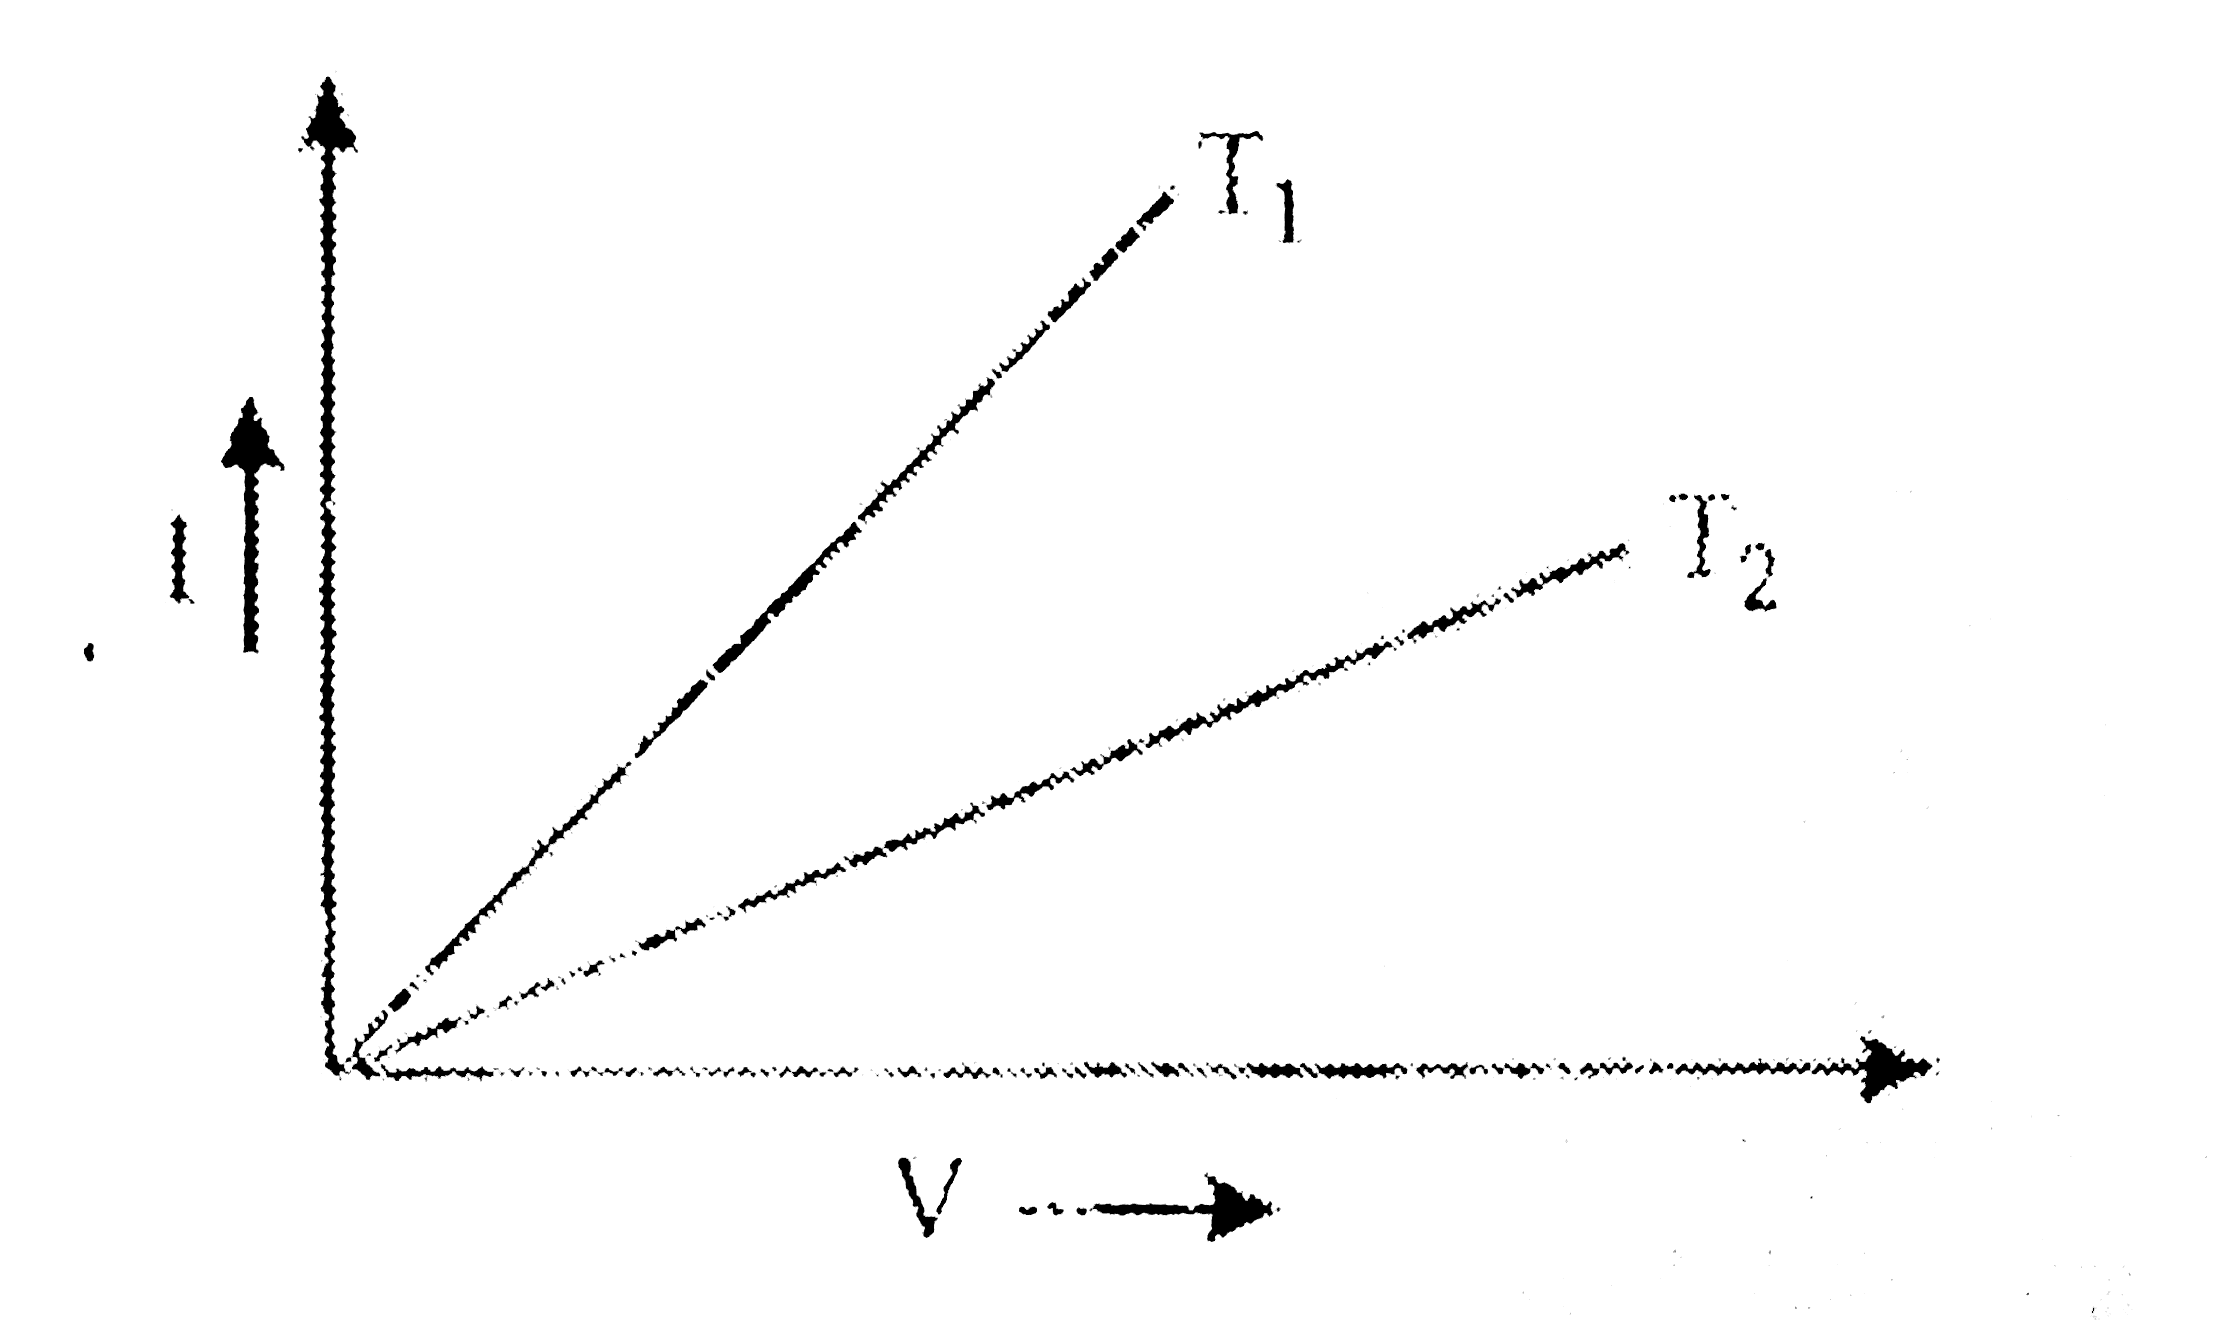 View Solution
A plot of Farenheit temperature (tF) versus celsius temperature
View Solution

