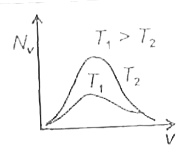
The effect of temperature on Maxwell's speed distribution is correctly shown by


The correct Answer is:A
To determine the effect of temperature on Maxwell's speed distribution, we need to analyze the Maxwell-Boltzmann distribution function and how it changes with temperature.
1. Understand Maxwell's Speed Distribution:
The Maxwell-Boltzmann distribution describes the distribution of speeds (or velocities) of particles in a gas. The mathematical expression is given by:
f(v)=n(2πkT)3/2⋅4πv2⋅e−mv22kT
where f(v) is the probability density function, n is the number of particles, m is the mass of the particles, k is the Boltzmann constant, T is the absolute temperature, and v is the speed.
2. Analyze the Effect of Temperature:
From the equation, we can see that temperature T appears in the denominator of the exponent. This indicates that as temperature increases, the exponent becomes less negative, leading to a higher probability of finding particles at higher speeds.
3. Graph Characteristics:
- At higher temperatures, the distribution curve shifts to the right, indicating that particles have higher average speeds.
- The peak of the distribution (the most probable speed) decreases with increasing temperature, meaning that while more particles are moving at higher speeds, the most probable speed is not the same.
4. Comparing Graphs:
We need to compare the graphs provided in the options. We are looking for:
- A graph where the curve for higher temperature (T1) is shifted to the right compared to the lower temperature (T2).
- The peak of the distribution for T1 should be lower than that for T2, indicating that while more particles are moving faster, the most probable speed is lower.
5. Identifying the Correct Graph:
- In the first graph, T1 (higher temperature) has a peak that is lower than T2, and the distribution is shifted to the right, which is consistent with our understanding.
- In the second graph, T1 has a higher peak than T2, which contradicts the expected behavior.
- The third and fourth graphs can be eliminated based on similar reasoning.
6. Conclusion:
The correct graph that shows the effect of temperature on Maxwell's speed distribution is the first graph, where T1 is greater than T2, and the peak for T1 is lower than that for T2.
Final Answer:
The effect of temperature on Maxwell's speed distribution is correctly shown by option number one.
The Maxwell-Boltzmann distribution describes the distribution of speeds (or velocities) of particles in a gas. The mathematical expression is given by:
f(v)=n(2πkT)3/2⋅4πv2⋅e−mv22kT
where f(v) is the probability density function, n is the number of particles, m is the mass of the particles, k is the Boltzmann constant, T is the absolute temperature, and v is the speed.
From the equation, we can see that temperature T appears in the denominator of the exponent. This indicates that as temperature increases, the exponent becomes less negative, leading to a higher probability of finding particles at higher speeds.
- At higher temperatures, the distribution curve shifts to the right, indicating that particles have higher average speeds.
- The peak of the distribution (the most probable speed) decreases with increasing temperature, meaning that while more particles are moving at higher speeds, the most probable speed is not the same.
We need to compare the graphs provided in the options. We are looking for:
- A graph where the curve for higher temperature (T1) is shifted to the right compared to the lower temperature (T2).
- The peak of the distribution for T1 should be lower than that for T2, indicating that while more particles are moving faster, the most probable speed is lower.
- In the first graph, T1 (higher temperature) has a peak that is lower than T2, and the distribution is shifted to the right, which is consistent with our understanding.
- In the second graph, T1 has a higher peak than T2, which contradicts the expected behavior.
- The third and fourth graphs can be eliminated based on similar reasoning.
The correct graph that shows the effect of temperature on Maxwell's speed distribution is the first graph, where T1 is greater than T2, and the peak for T1 is lower than that for T2.
The effect of temperature on Maxwell's speed distribution is correctly shown by option number one.
Topper's Solved these Questions
- KINETIC THEORYBOOK - AAKASH INSTITUTE ENGLISHCHAPTER - KINETIC THEORYEXERCISE - EXERCISE (ASSIGNMENT) SECTION - B Objective Type Questions
30 Videos
- KINETIC THEORYBOOK - AAKASH INSTITUTE ENGLISHCHAPTER - KINETIC THEORYEXERCISE - EXERCISE (ASSIGNMENT) SECTION - C Previous Years Questions
21 Videos
- KINETIC THEORYBOOK - AAKASH INSTITUTE ENGLISHCHAPTER - KINETIC THEORYEXERCISE - EXERCISE
10 Videos
- GRAVITATION BOOK - AAKASH INSTITUTE ENGLISHCHAPTER - GRAVITATION EXERCISE - ASSIGNMENT SECTION - D (ASSERTION-REASON TYPE QUESTIONS)
15 Videos
- LAWS OF MOTIONBOOK - AAKASH INSTITUTE ENGLISHCHAPTER - LAWS OF MOTIONEXERCISE - Assignment (SECTION-D) (Assertion-Reason Type Questions)
15 Videos
Similar Questions
Knowledge Check
Which one of the following statements is not true about the effect of an increase in temperature on the distribution of molecular speeds in a gas?
AThe area under the distribution curve remains the same as under the lower temperature.BThe distribution becomes broader.CThe fraction of the molecules with the most probable speed increases.DThe most probable speed increases.
What is the effect of temperature on elasticity?
View SolutionWhat is the effect of temperature on elasticity?
View SolutionSelect the incorrect statement about Maxwell's speed distribution.
View SolutionWhat is the effect of temperature on surface tension?
View SolutionThe effect of temperature on the rate constant of a reaction is given by
View SolutionWhich one of the following statement is not true about the effect of an increase in temperature on the distribution of molecular speed of gas ? .
View SolutionWhich one of the following statement is not true about the effect of an increase in temperature on the distribution of molecular speed of gas ? .
View Solution
