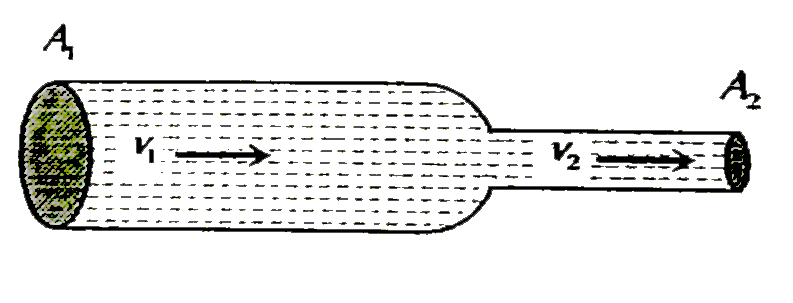
A liquid flows in a tube from left to right as shown in figure. A1 and A2 are the cross-section of the portions of the tube as shown. Then the ratio of speeds v1/v2 will be
A1A2
A2A1
√A2A1
√A1A2
Step by step video & image solution for A liquid flows in a tube from left to right as shown in figure. A_(1) and A_(2) are the cross-section of the portions of the tube as shown. Then the ratio of speeds v_(1)//v_(2) will be by Physics experts to help you in doubts & scoring excellent marks in Class 12 exams.
Updated on:21/07/2023Similar Questions
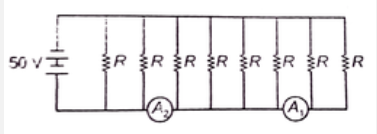
In the situation shown , the readings of ideal ammeters A1 and A2 are in the ratio.
View SolutionWater flows through the tube shown in figure. The areas of cross section of the wide and the narrow portions of the tube are 5cm2and2cm2 respectively. The rate of flow of water through the tube is 500cm3s−1 . Find the difference of mercury levels in the U-tube.

View Solution
Knowledge Check
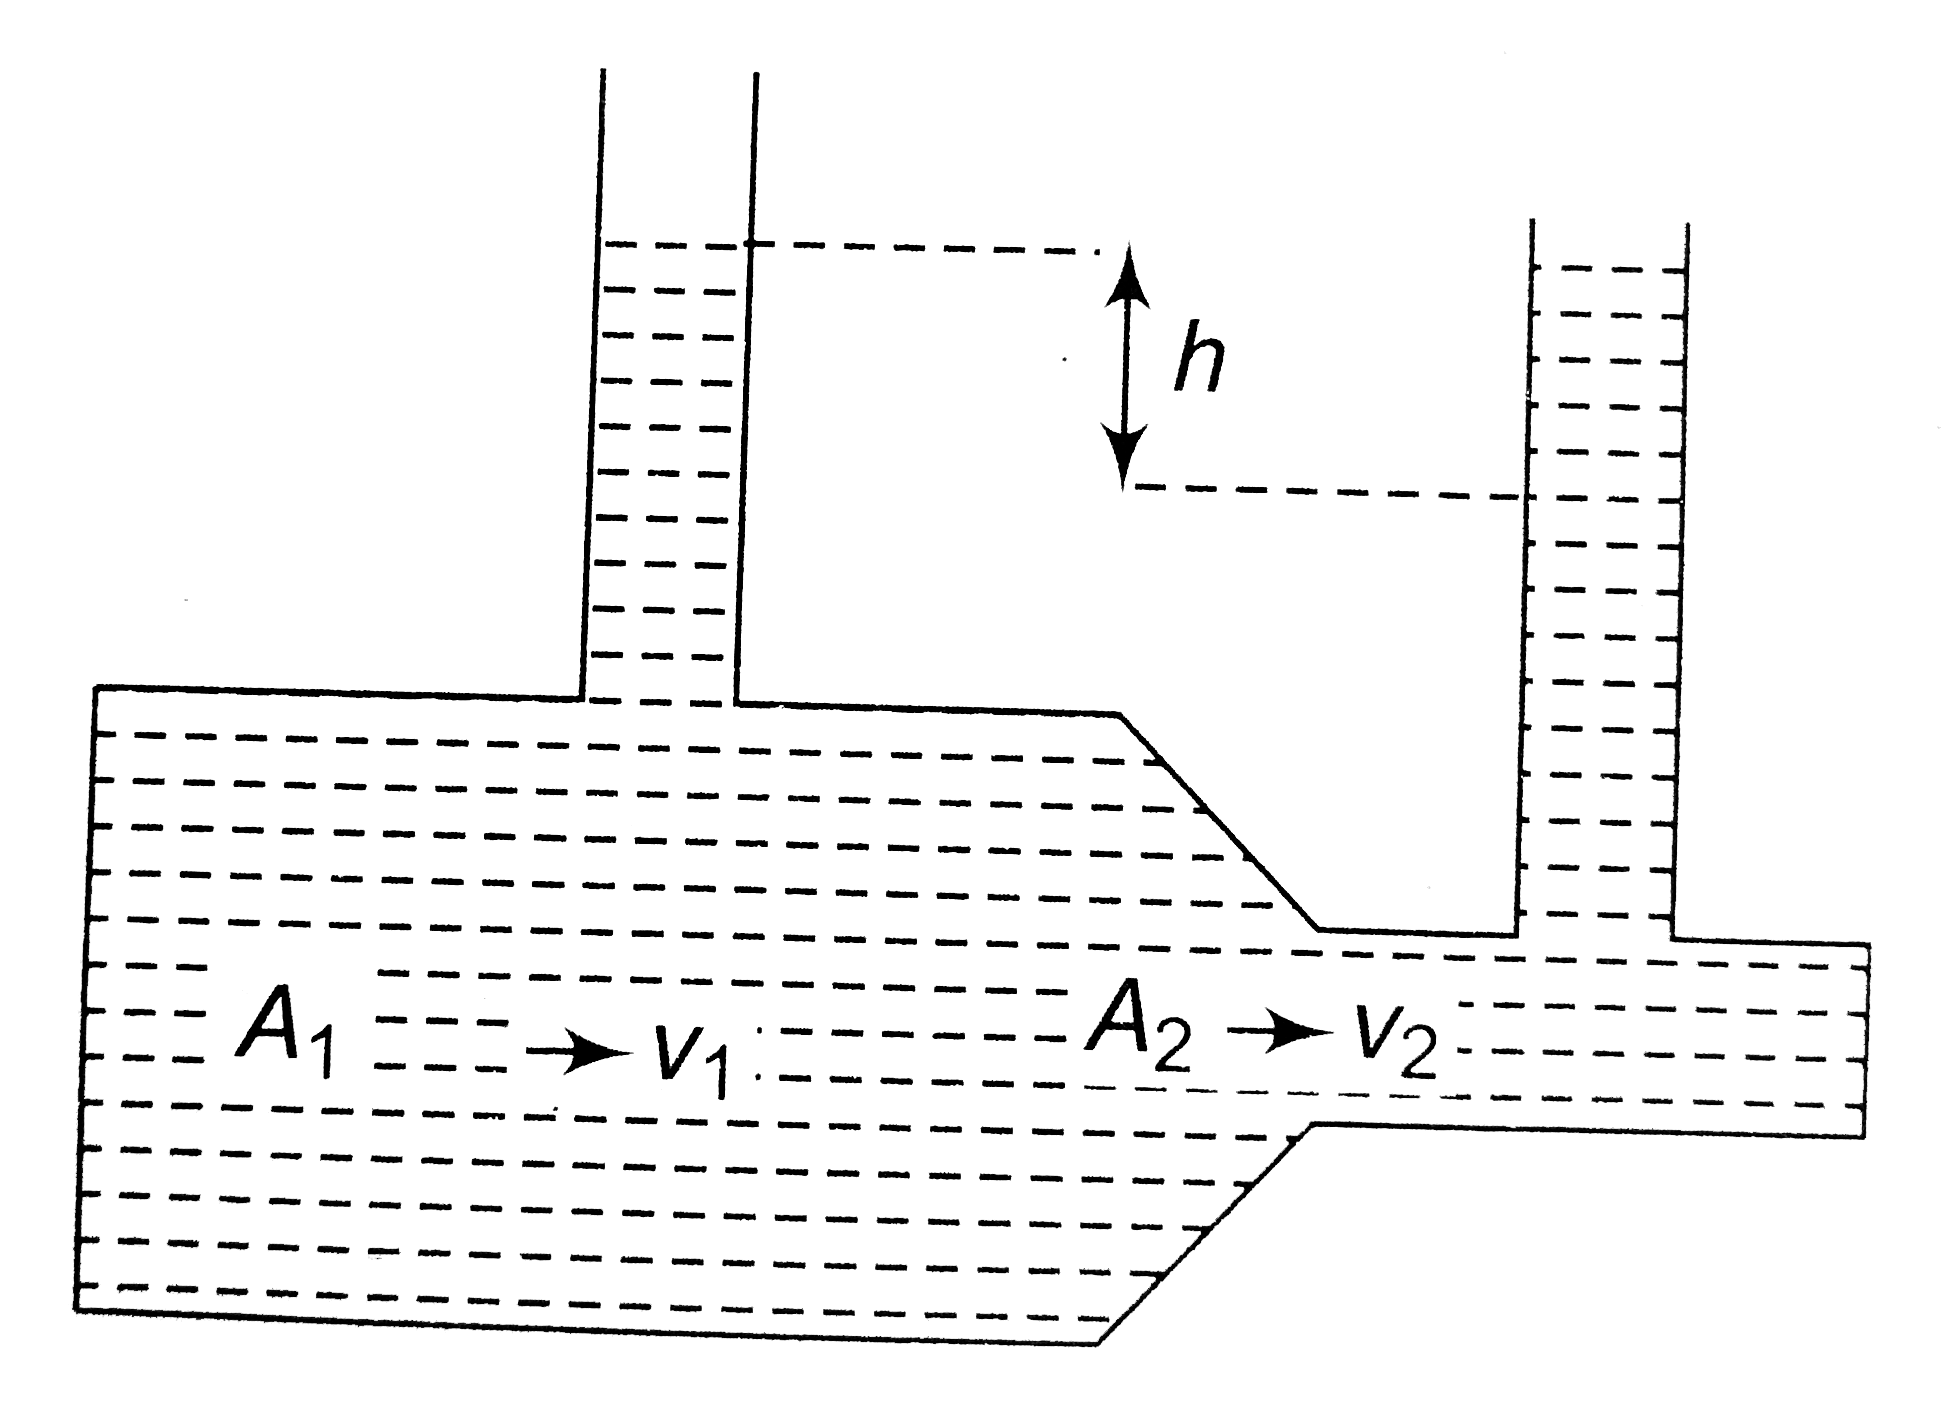
A liquid flows through a horizontal tube as shown in figure. The velocities of the liquid in the two sections, which have areas of cross-section A1 and A2 and v1 and v2 respectively. The differnece in the levels of the liquid in the two vertical tubes is h. then
 Av22−v21=2ghBv22+v21=2ghCv22−v21=ghDv22+v21=gh
Water flows through the tube shown in figure. The areas of cross section of the wide and the narrow portions of the tube are 5cm2and2cm2 respectively. The rate of flow of water through the tube is 500cm3s−1 . Find the difference of mercury levels in the U-tube.

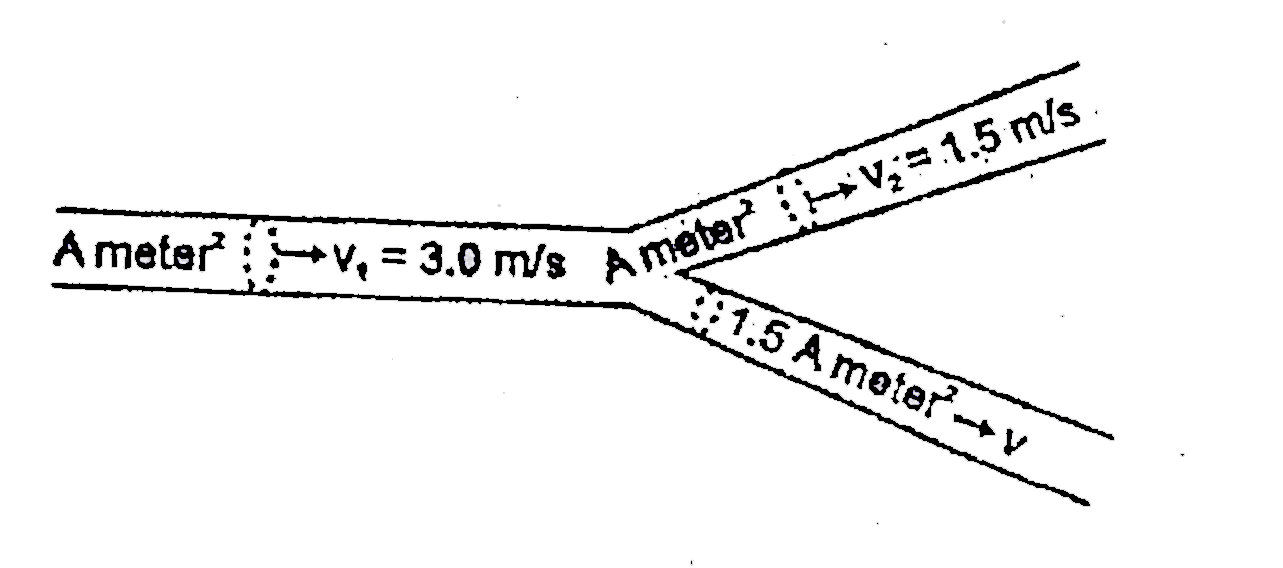
View SolutionAn incompressible liquid flows through a horizontal tube as shown in the figure. Then the velocity 'v' of the fluid is:
View Solution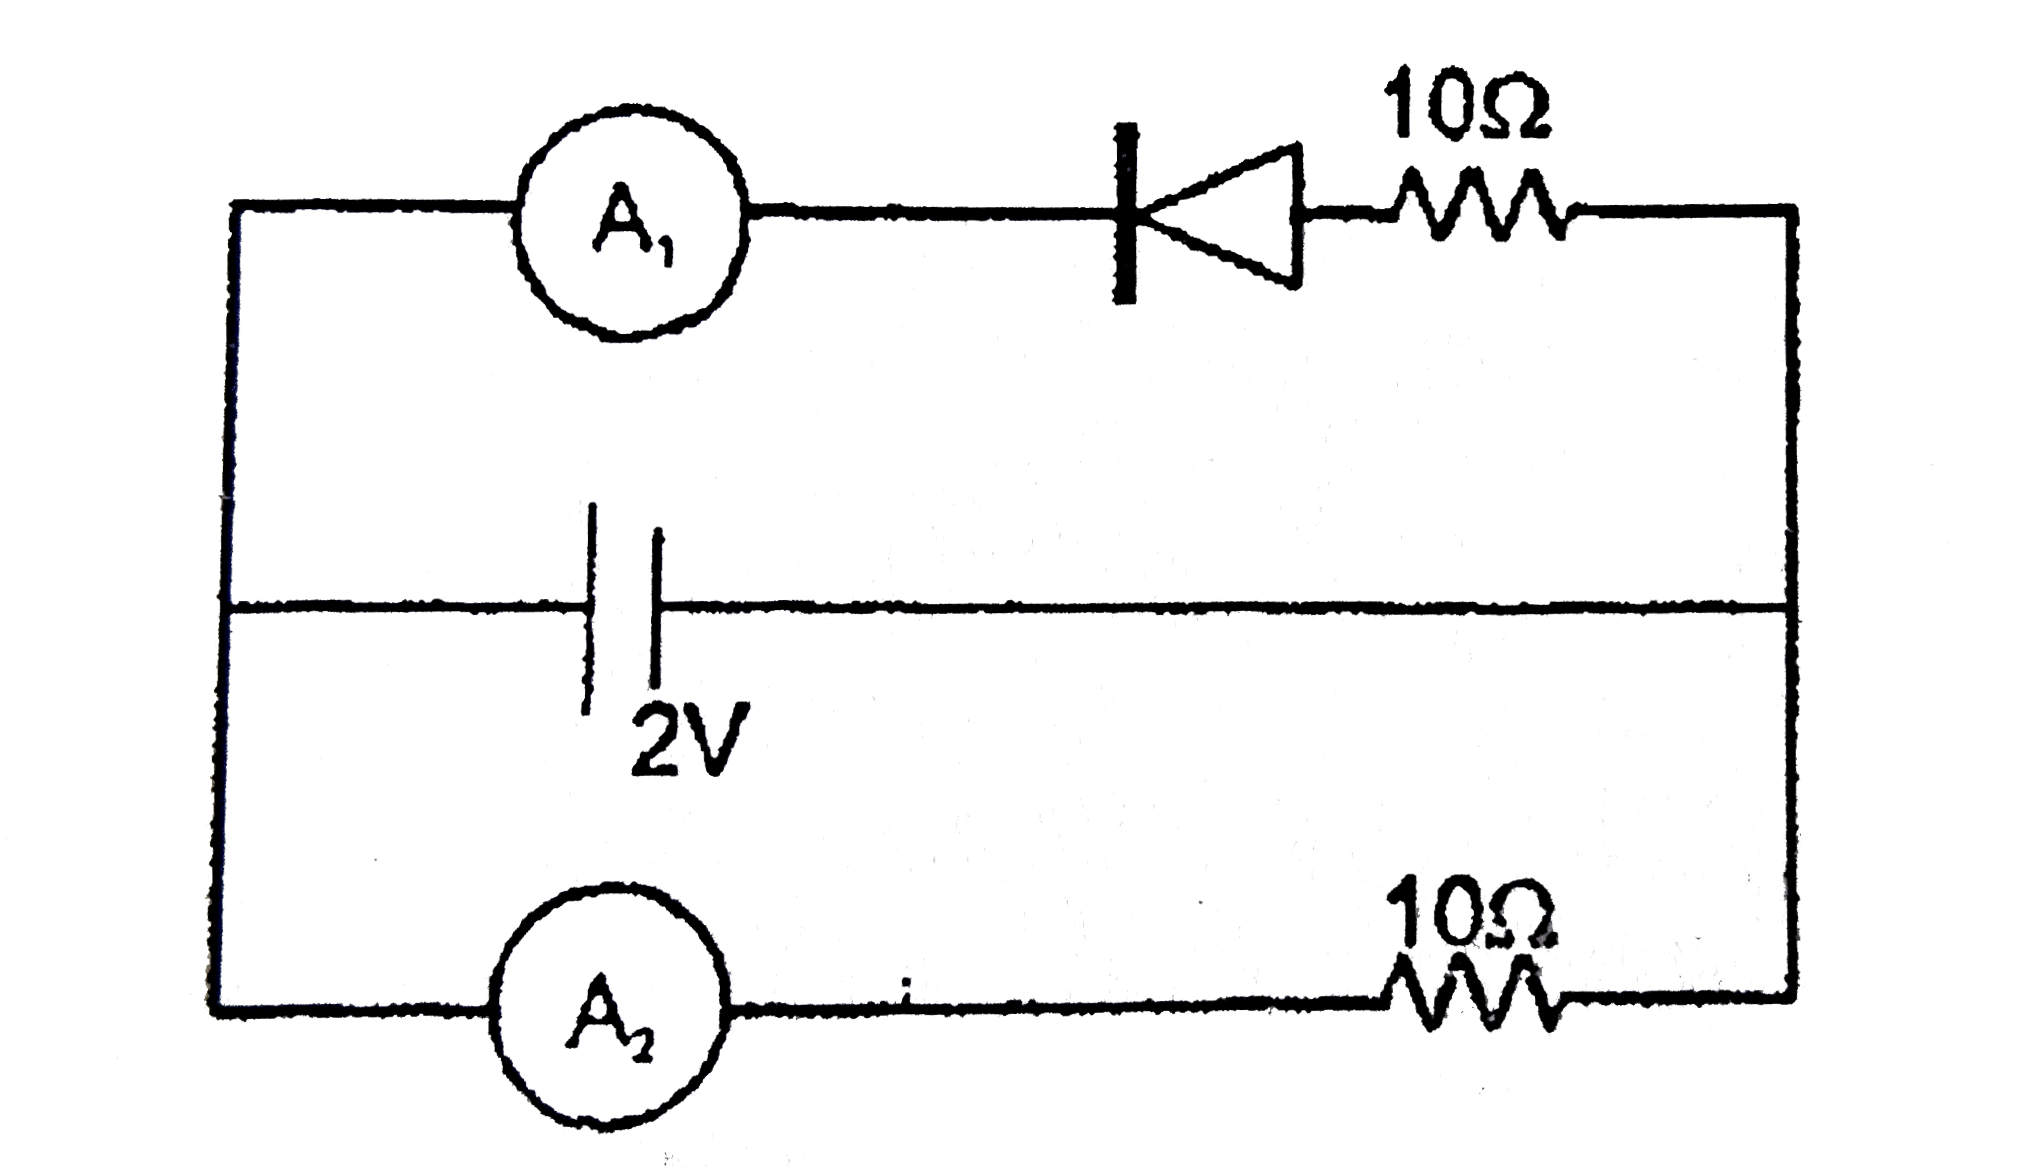
What are the readint of the ammeters A1 and A2 shown in figure. Neglect the resistance of the maters.
View SolutionA non viscous liquid is flowing through a frictionless duct, cross-section varying as shown in figure.

Which of the following graph represents the variation of pressure p along the axis of tube ?
View SolutionA non viscous liquid is flowing through a frictionless duct, cross-section varying as shown in figure.

Which of the following graph represents the variation of pressure p along the axis of tube ?
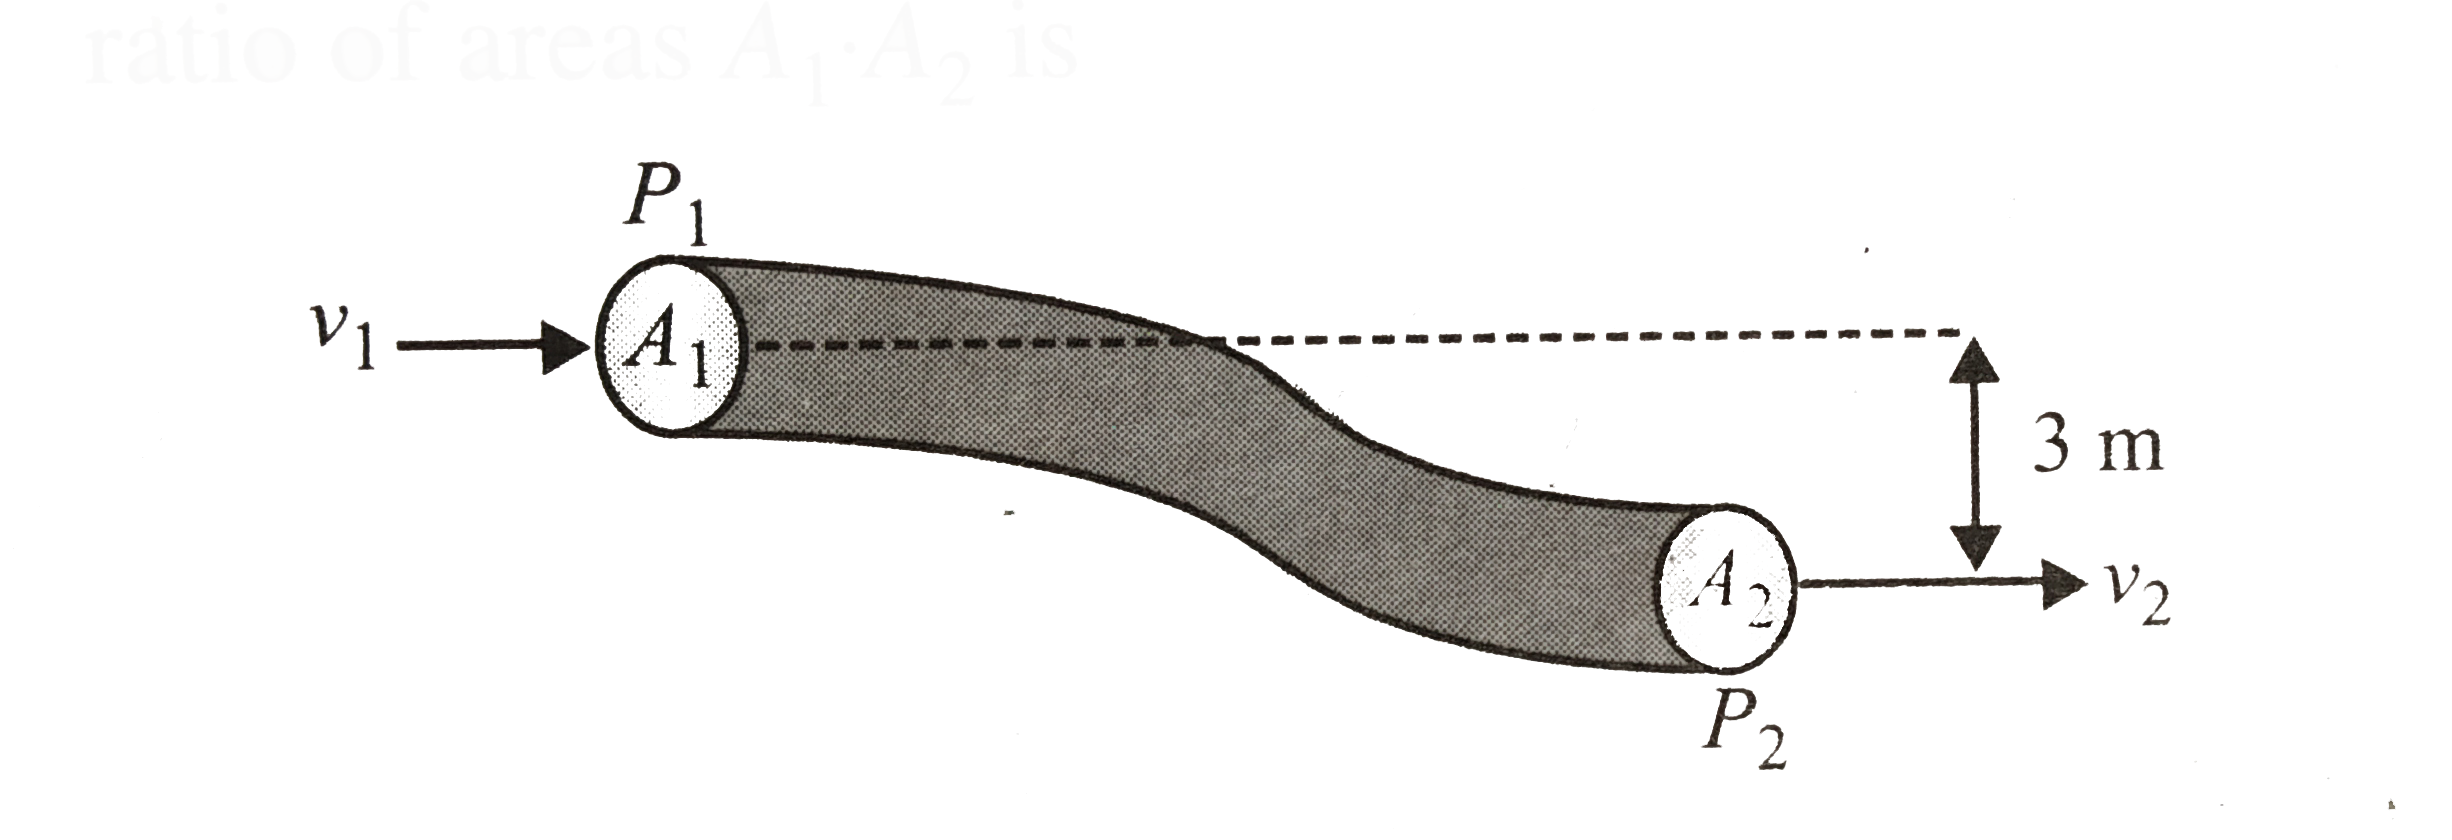
View SolutionAn ideal fluid flows in the pipe as shown in the figure. The pressure in the fluid at the bottom P2 is the same as it is at the top P1. If the velocity of the top v1=2m/s. Then the ratio of areas A1.A2, is
View SolutionTwo capillary tubes of lengths in the ratio 2:1 and radii in the ratio 1:2 are connected in series. Assume the flow of the liquid through the tube is steady. Then, the ratio of pressure difference across the tubes is
View Solution
