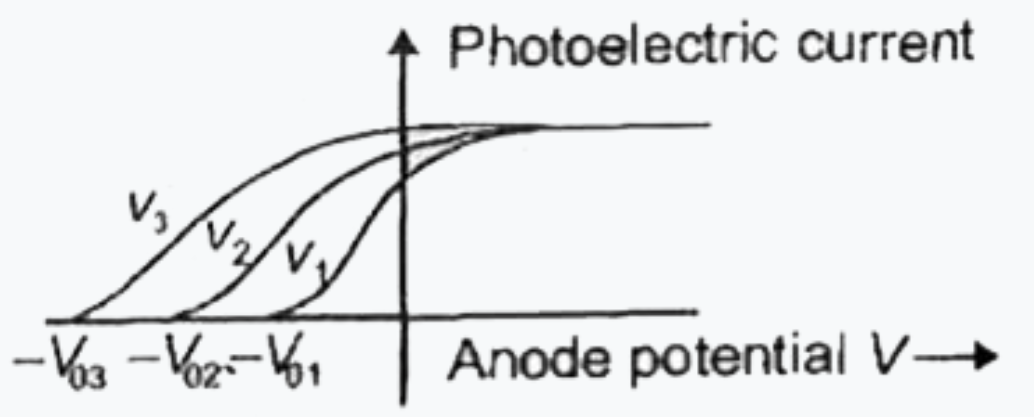
In photoelectric effect , the curve between photoelectric current and anode potential V (for different frequencies ) is shown in figure , then

A
v1>v2>v3
B
v1<v2<v3
C
v1=v2=v3
D
v1>v2<v3
Video Solution
Text Solution
The correct Answer is:B
|
Answer
Step by step video & image solution for In photoelectric effect , the curve between photoelectric current and anode potential V (for different frequencies ) is shown in figure , then by Physics experts to help you in doubts & scoring excellent marks in Class 12 exams.
Updated on:21/07/2023Topper's Solved these Questions
- ALTERNATING CURRENT BOOK - AAKASH INSTITUTE ENGLISHCHAPTER - ALTERNATING CURRENT EXERCISE - Try Yourself
15 Videos
- ALTERNATING CURRENT BOOK - AAKASH INSTITUTE ENGLISHCHAPTER - ALTERNATING CURRENT EXERCISE - Assignment (Section - A) ( Objective Type Questions ( One option is correct))
40 Videos
- ATOMSBOOK - AAKASH INSTITUTE ENGLISHCHAPTER - ATOMSEXERCISE - ASSIGNMENT SECTION J (Aakash Challengers )
5 Videos
Similar Questions
Knowledge Check
In photoelectric effect, the photoelectric current is independent of
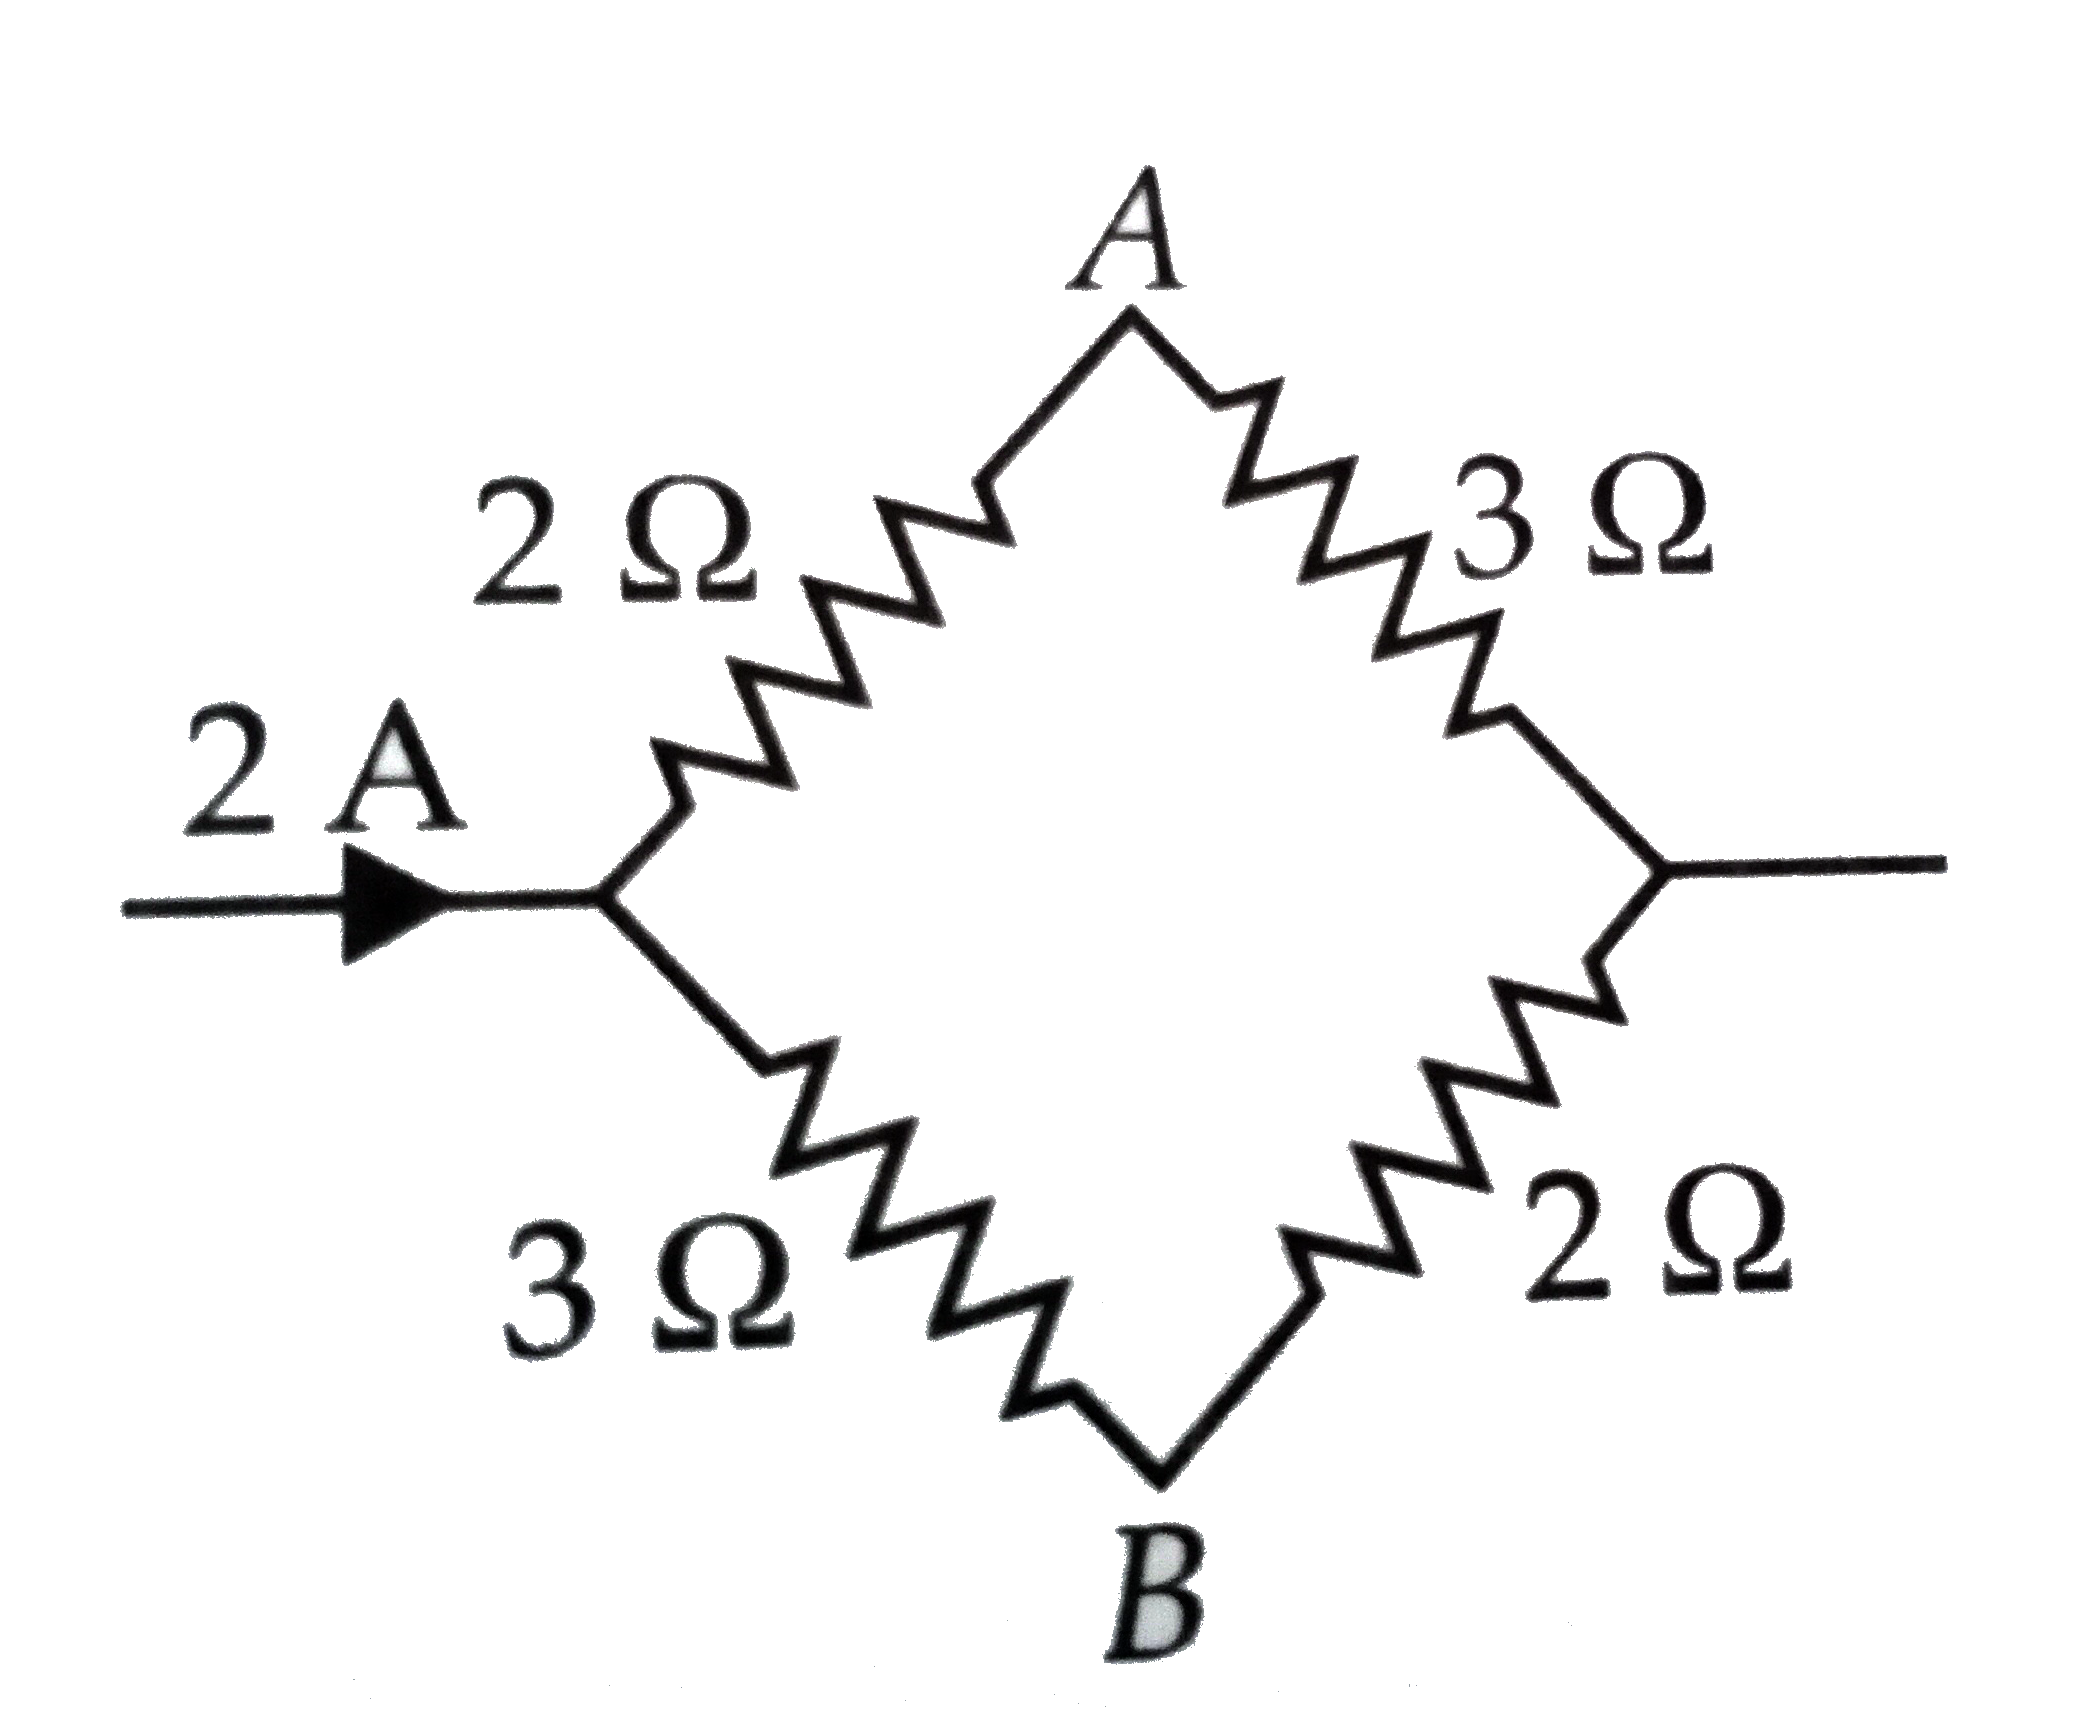
Aintensity of incident lightBpotential difference applied between the two electrodesCthe nature of emitter materialDfrequency of incident lightThe potential difference between A and B as shown in figure is
 A1VB2VC3VD4V
In photoelectric effect, stopping potential depends on
Afrequency of incident lightBnature of the emitter materialCintensity of incident lightDboth (a) and (b)
Photoelectric effect is the maximum in
View SolutionIn a photoelectric effect, electrons are emitted
View SolutionFind the potential difference between A and B as shown in the figure

View SolutionIn photoelectric effect, the number of photoelectrons emitted is proportional to :
View SolutionIn photoelectric effect, the number of photoelectrons emitted is proportional to :
View Solution
