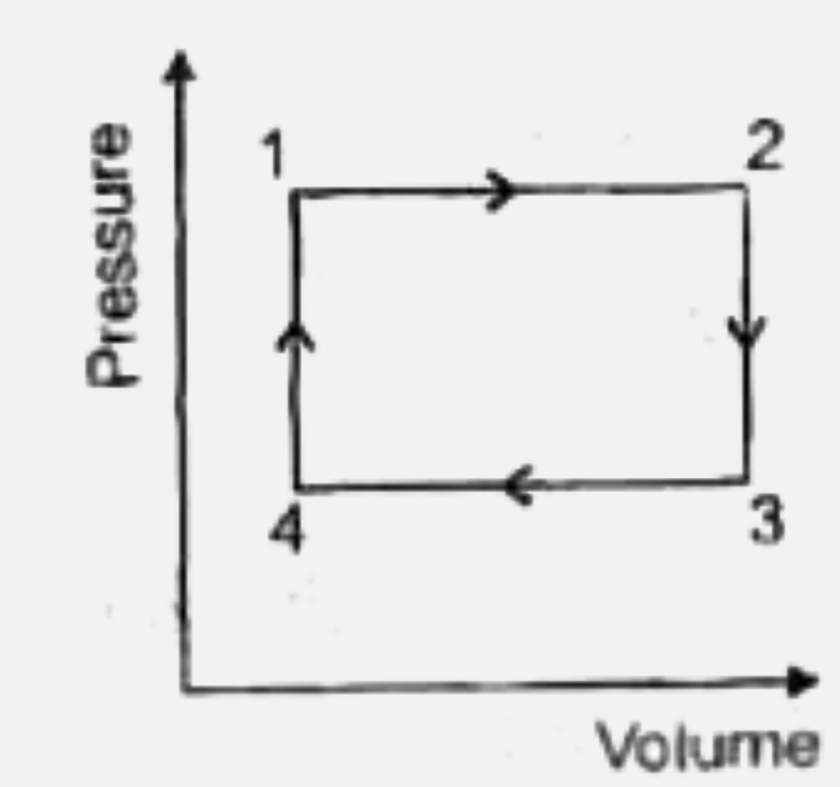
A particular cyclic process on a P-V diagram is a rectangle as shown below. Plot it on (a) T-V and P-T diagram.
Video Solution
Text Solution
(a) Given on P-V diagram we have two isobaric and two isochoric lines. On a T-V diagram, isobaric lines will have the tendency to pass through the originand the isochoric lines will be vertical: So, the basic shape of the cycle 1-2-3-4 on T-V diagram will apear as follows:

Here a, b are isochoric lines and c, d are isobaric lines. Now, if we can locate a single corner to be point 1,2,3 or 4 and put the arrow of its process, the cycle will be automatically completed.
Here isochoric lines are easy to deal with. Note the process 2-3 on P-V diagram is for larger volume, so is the line b on T-V diagram.In the process 2-3 the temperature decreases (You can check by drawin severalisothermal lines). So on the line .b. the arrow should point down because that is the direaction of decreasing temperature. So the point 2 will be on the upper side of line .b. and the process arrow will be down to point 3 on the T-V diagram depicted below.

Now, rest of tthe cycle to be complete is very easy. The arrow here indicates that the clockwise cycle will continue. From point 3 to point 4 then to 1 and finally to point 2 as shown below. Hence the final answer.

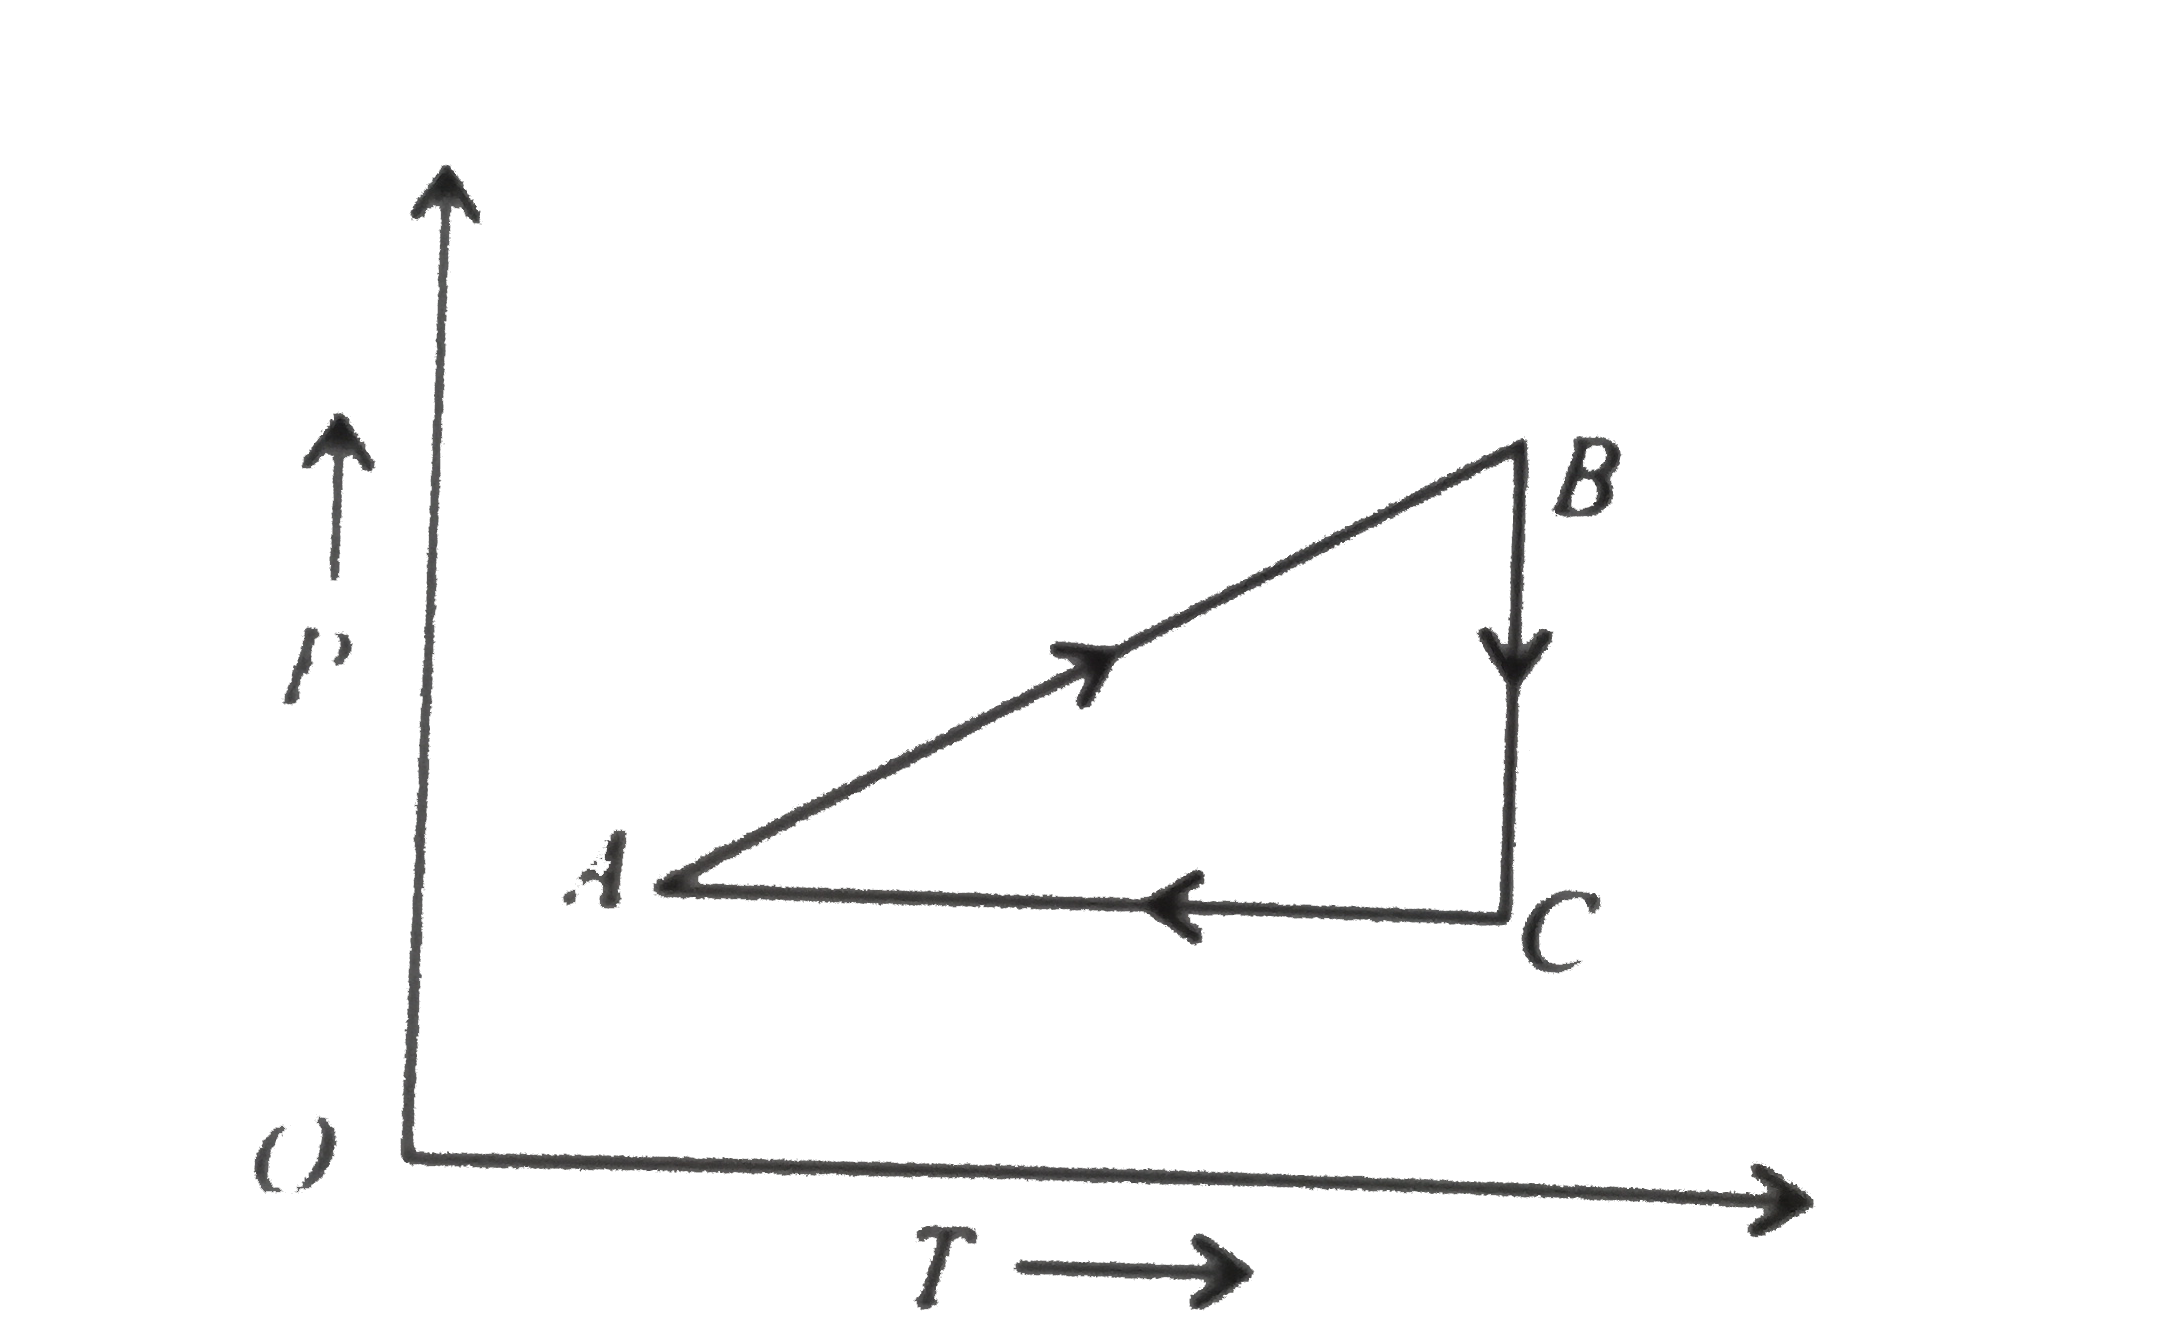
(b) Going by the same logic for the P-T diagram try to get the final answer as follows:

Because on P-T diagram the isobaric lines will be horizontal and isochoric line will have the tendency to pass throught he origin. If you concentrate on the process 1-2 in P-V diagram,you can note that it.s a higher pressure line and the temperature increases from 1 to 2. Same thing we have shown on P-T diagram here higher preseure line is the top horizontal line and the arrow will point left to right because that is the direaction of increasing temperature.
|
Similar Questions
Knowledge Check
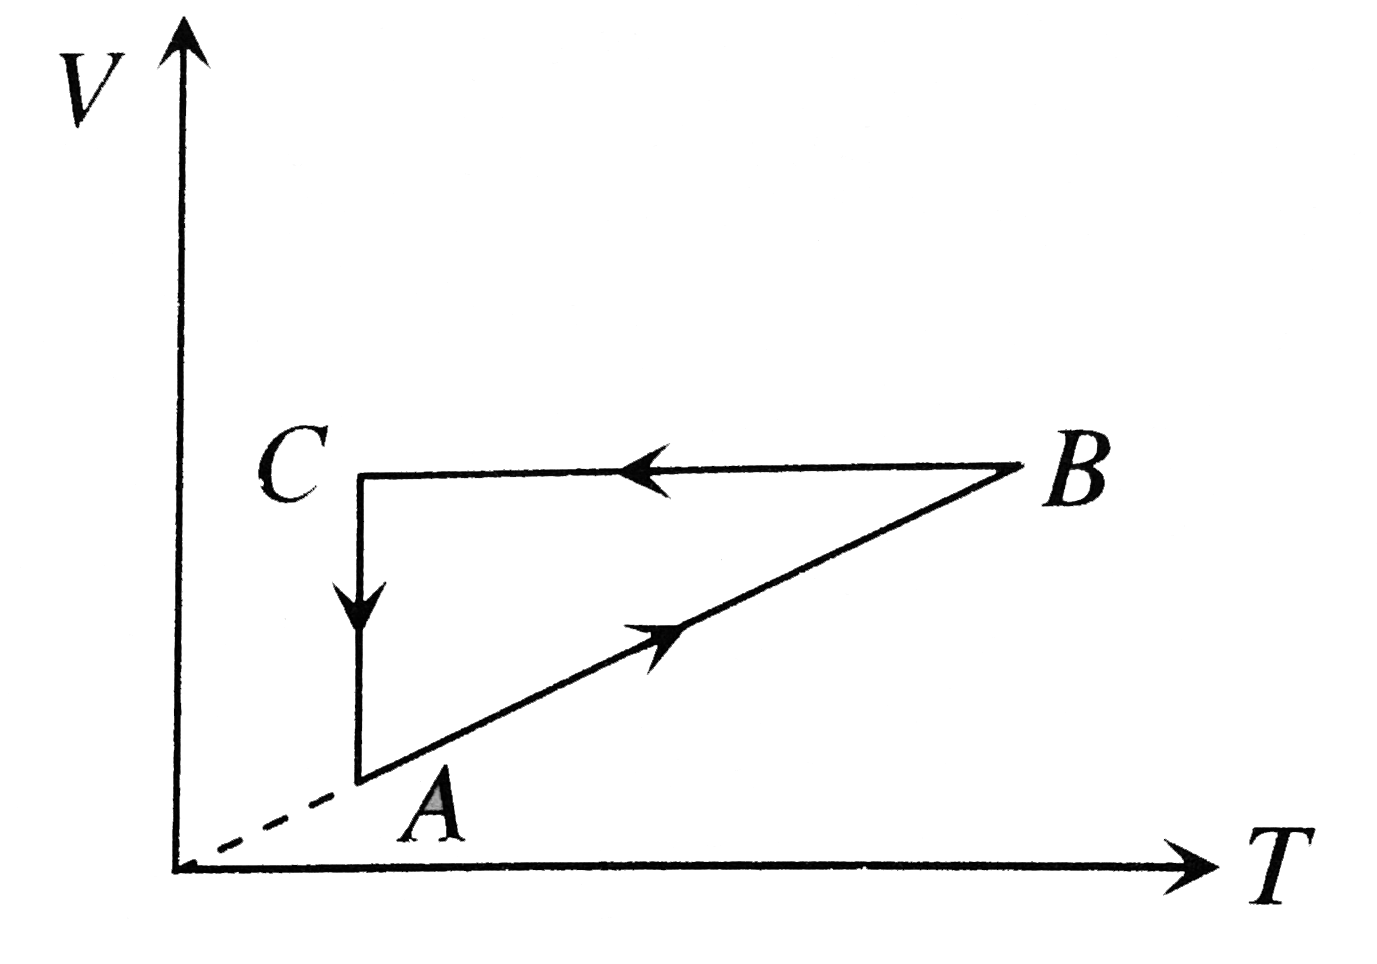
A cyclic process ABCA is shown in the V−T diagram process on the P−V
 A
A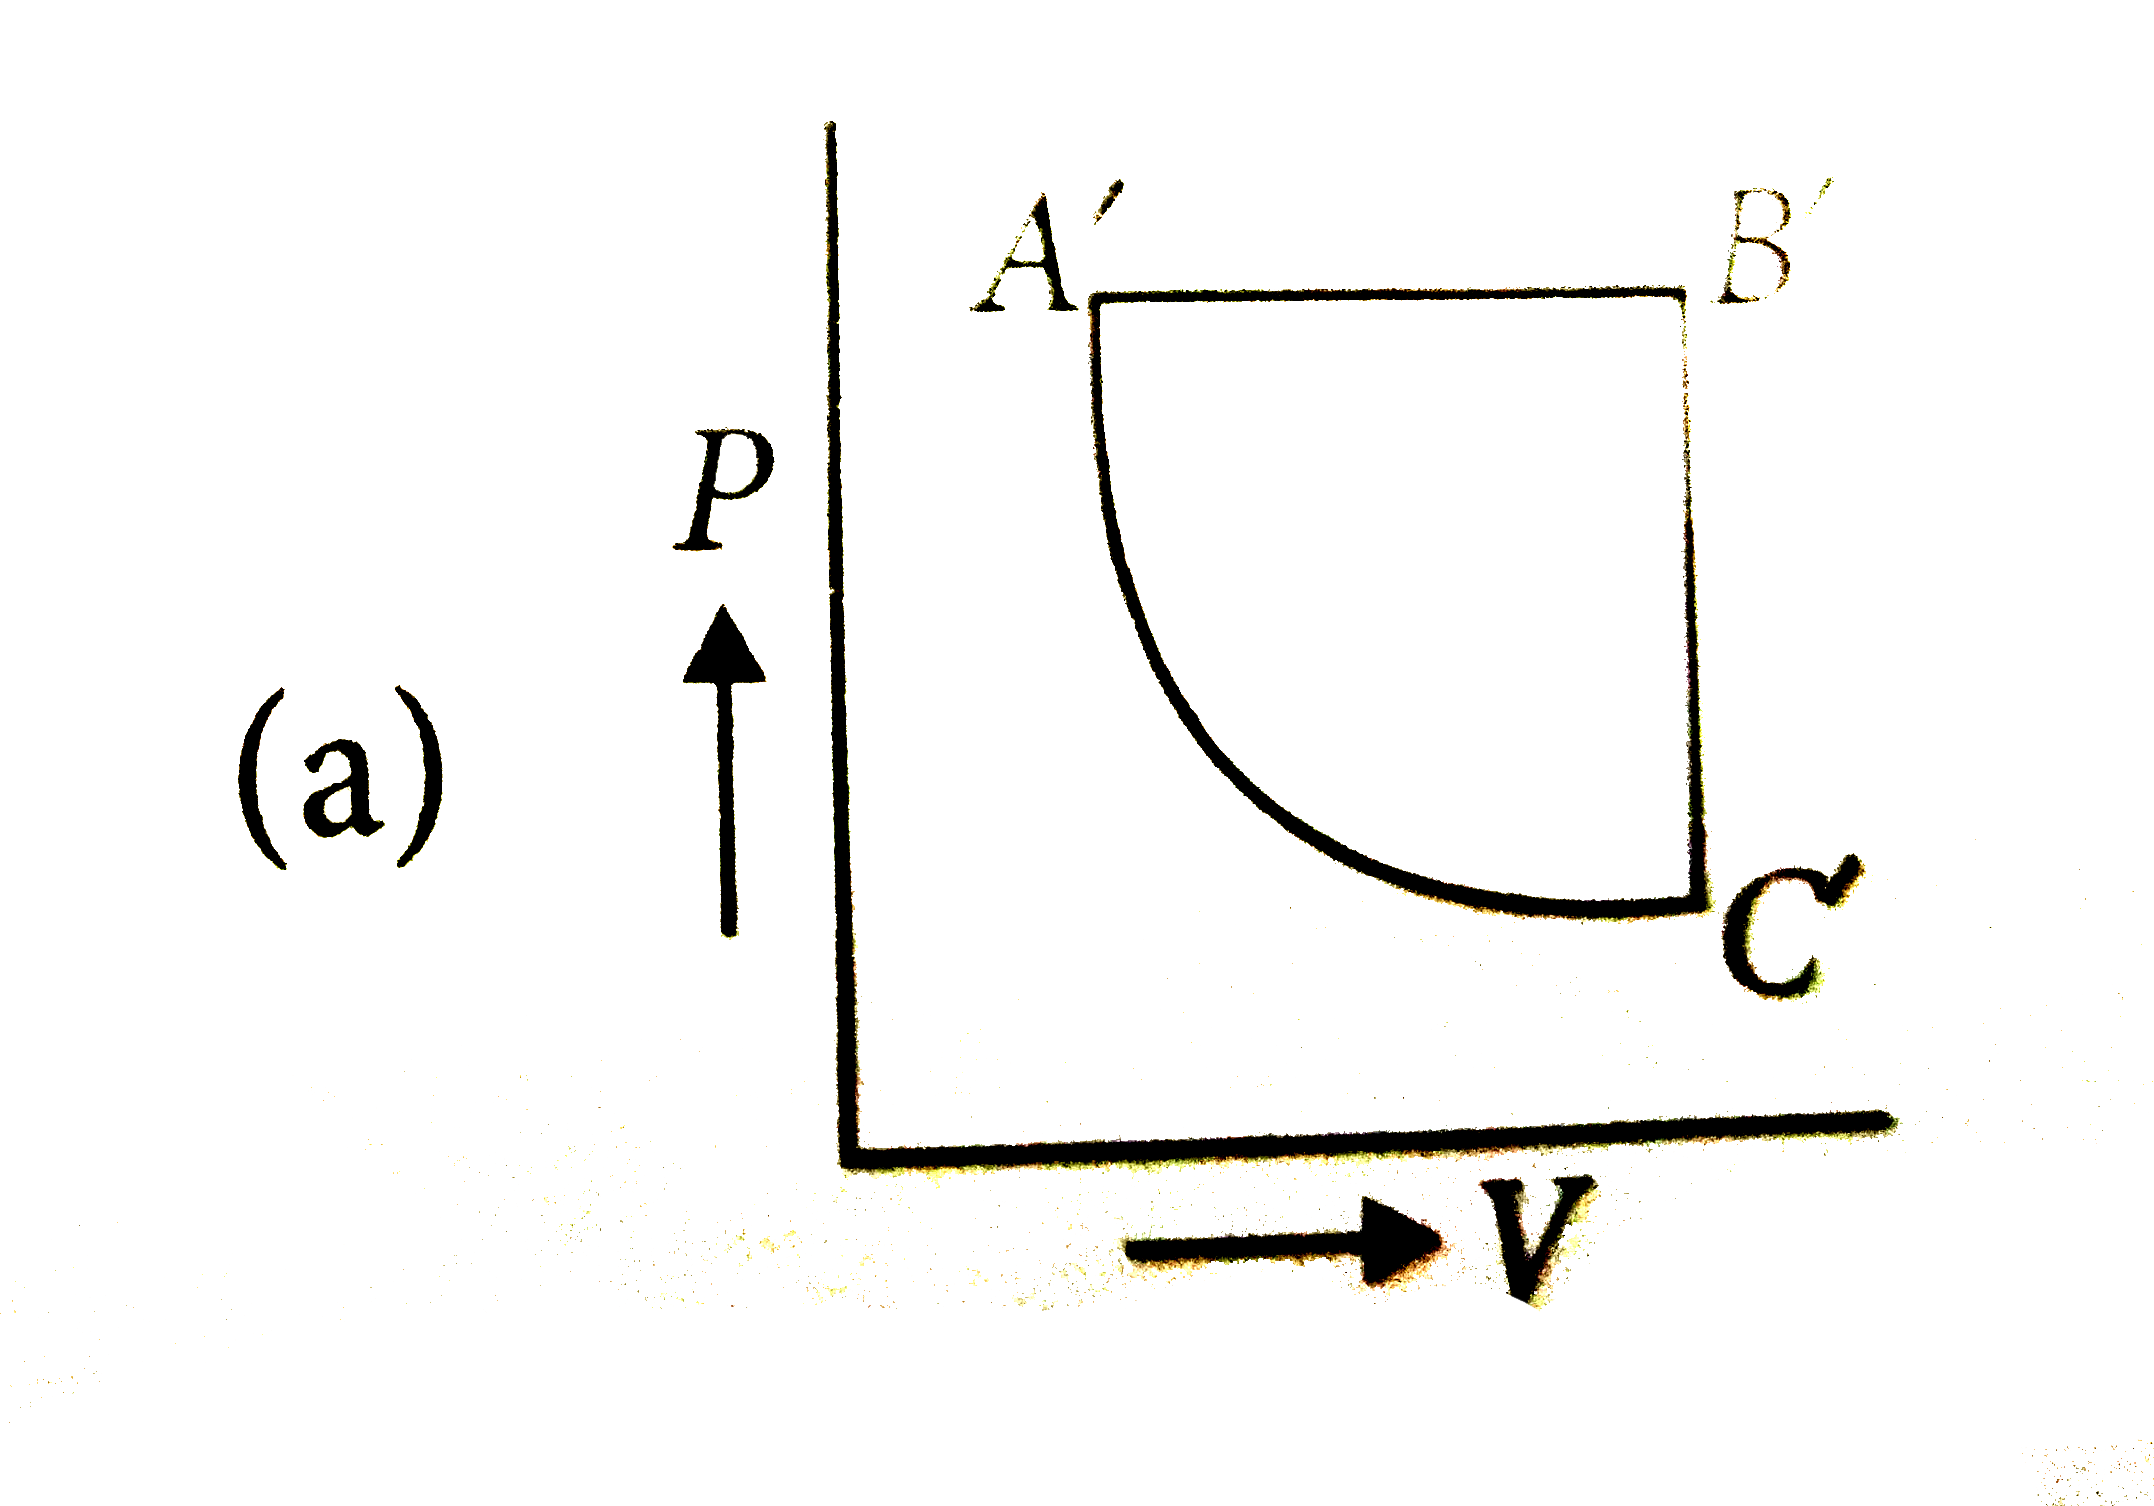 B
B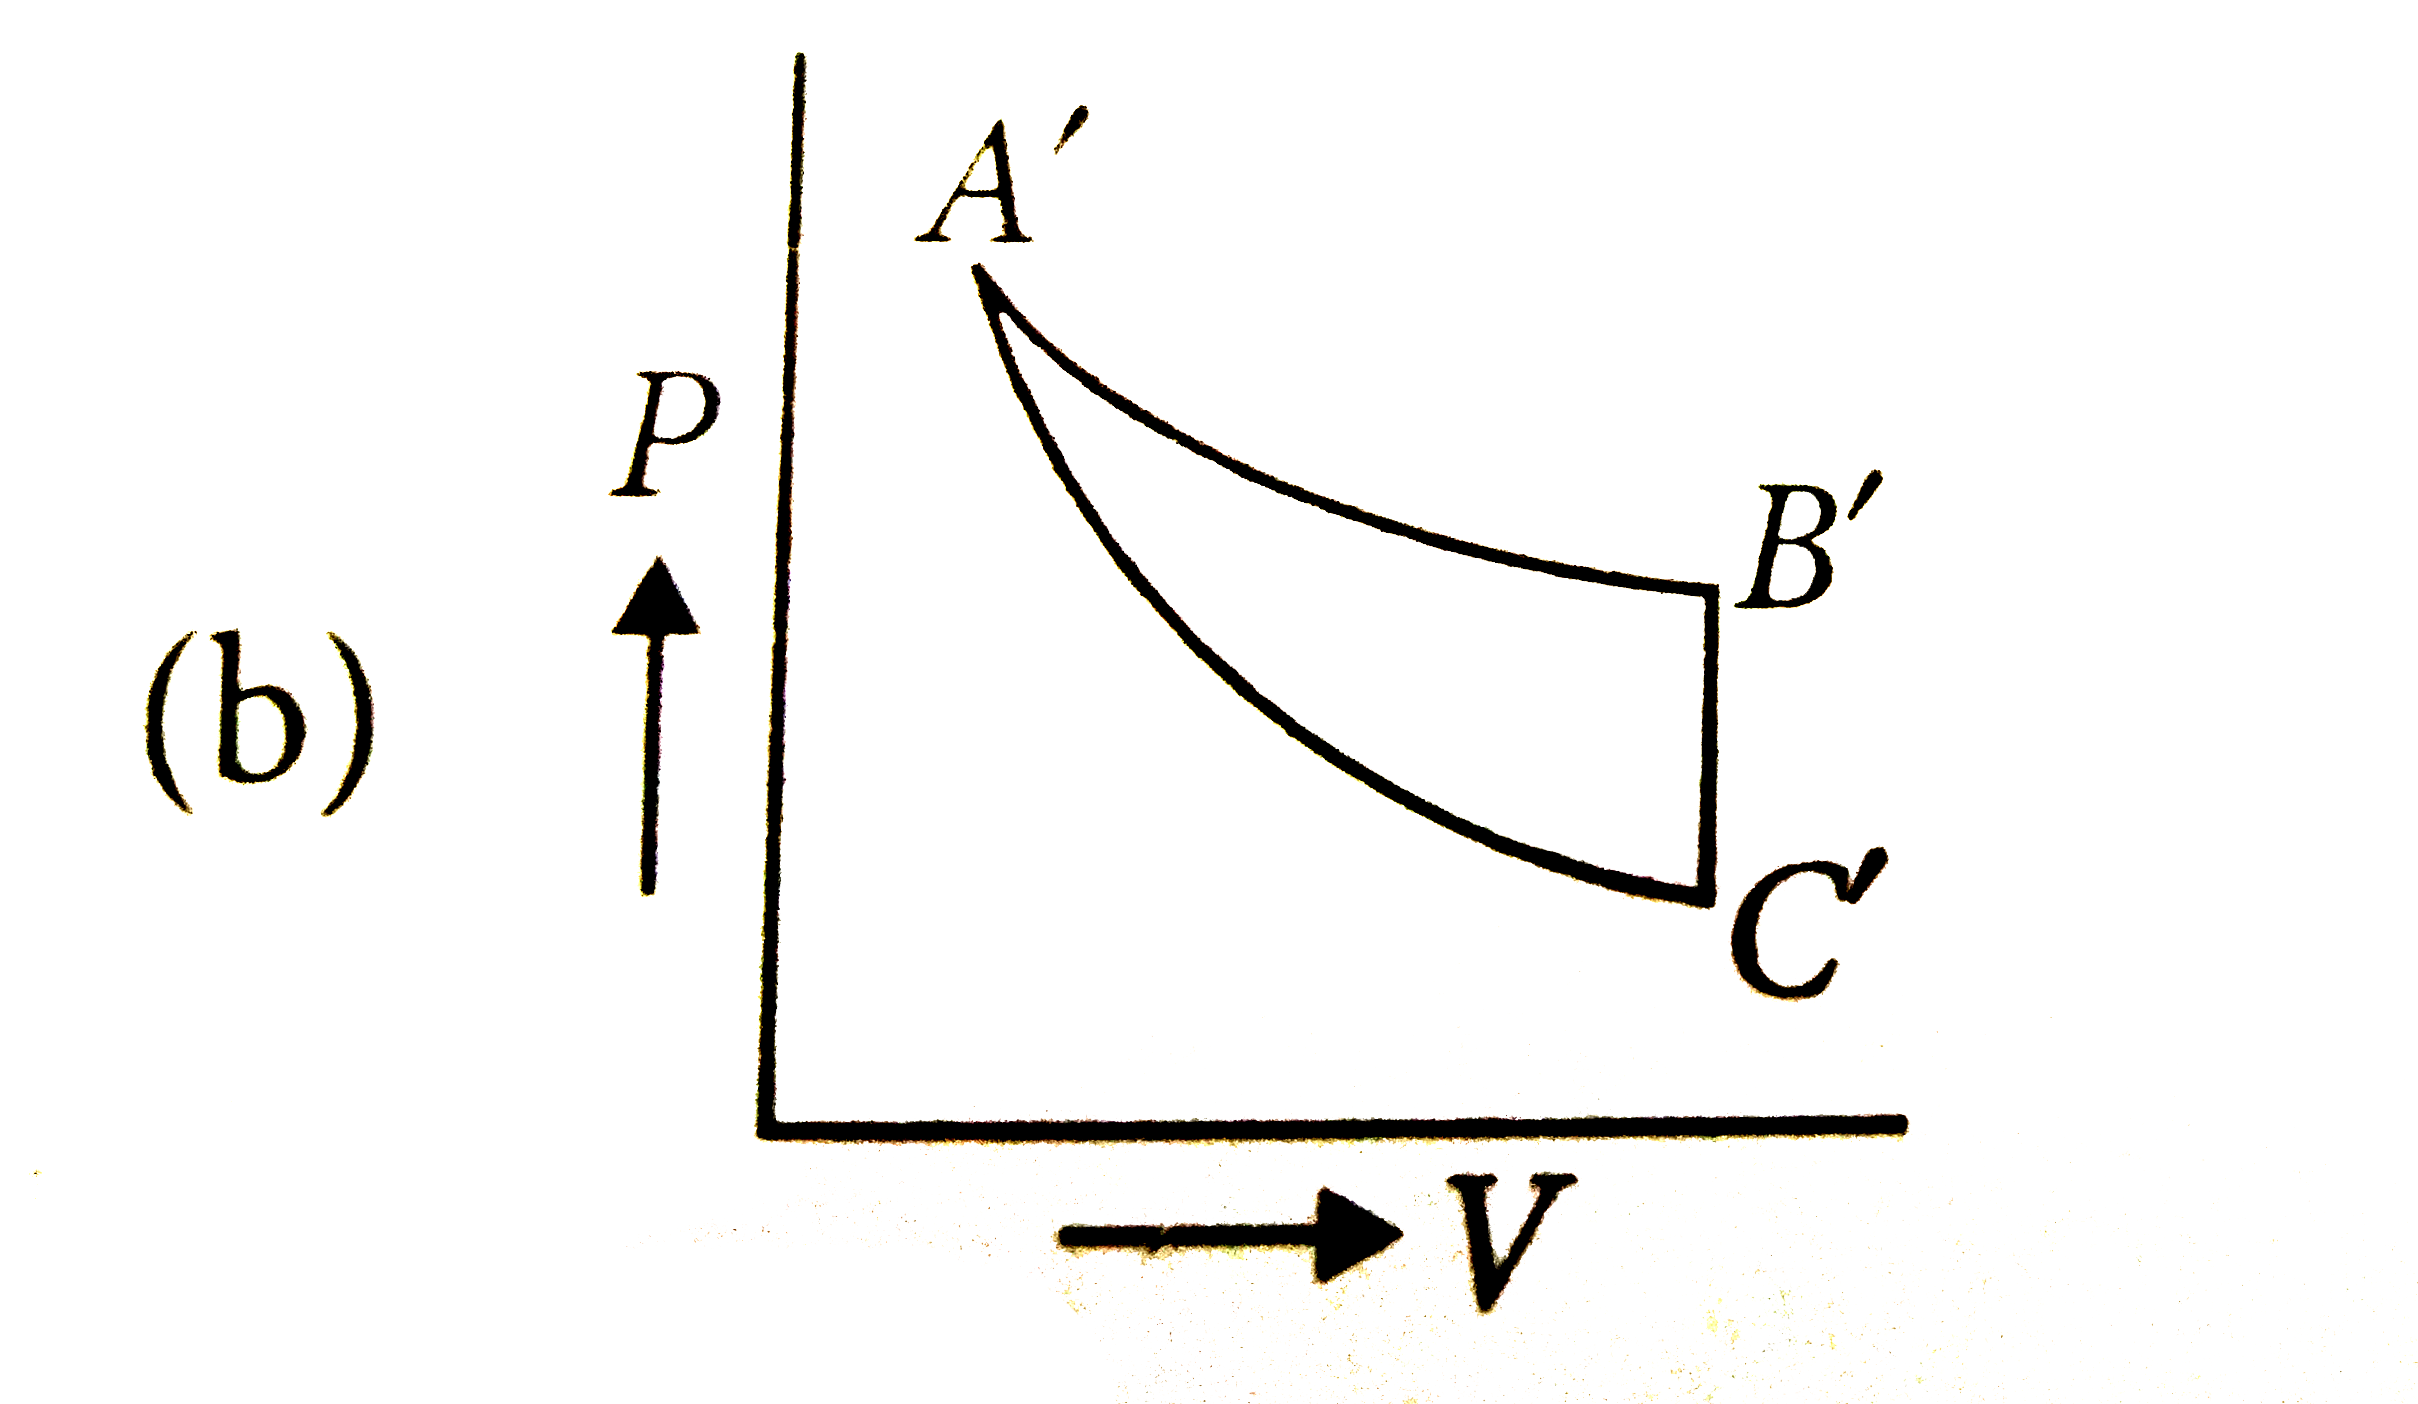 C
C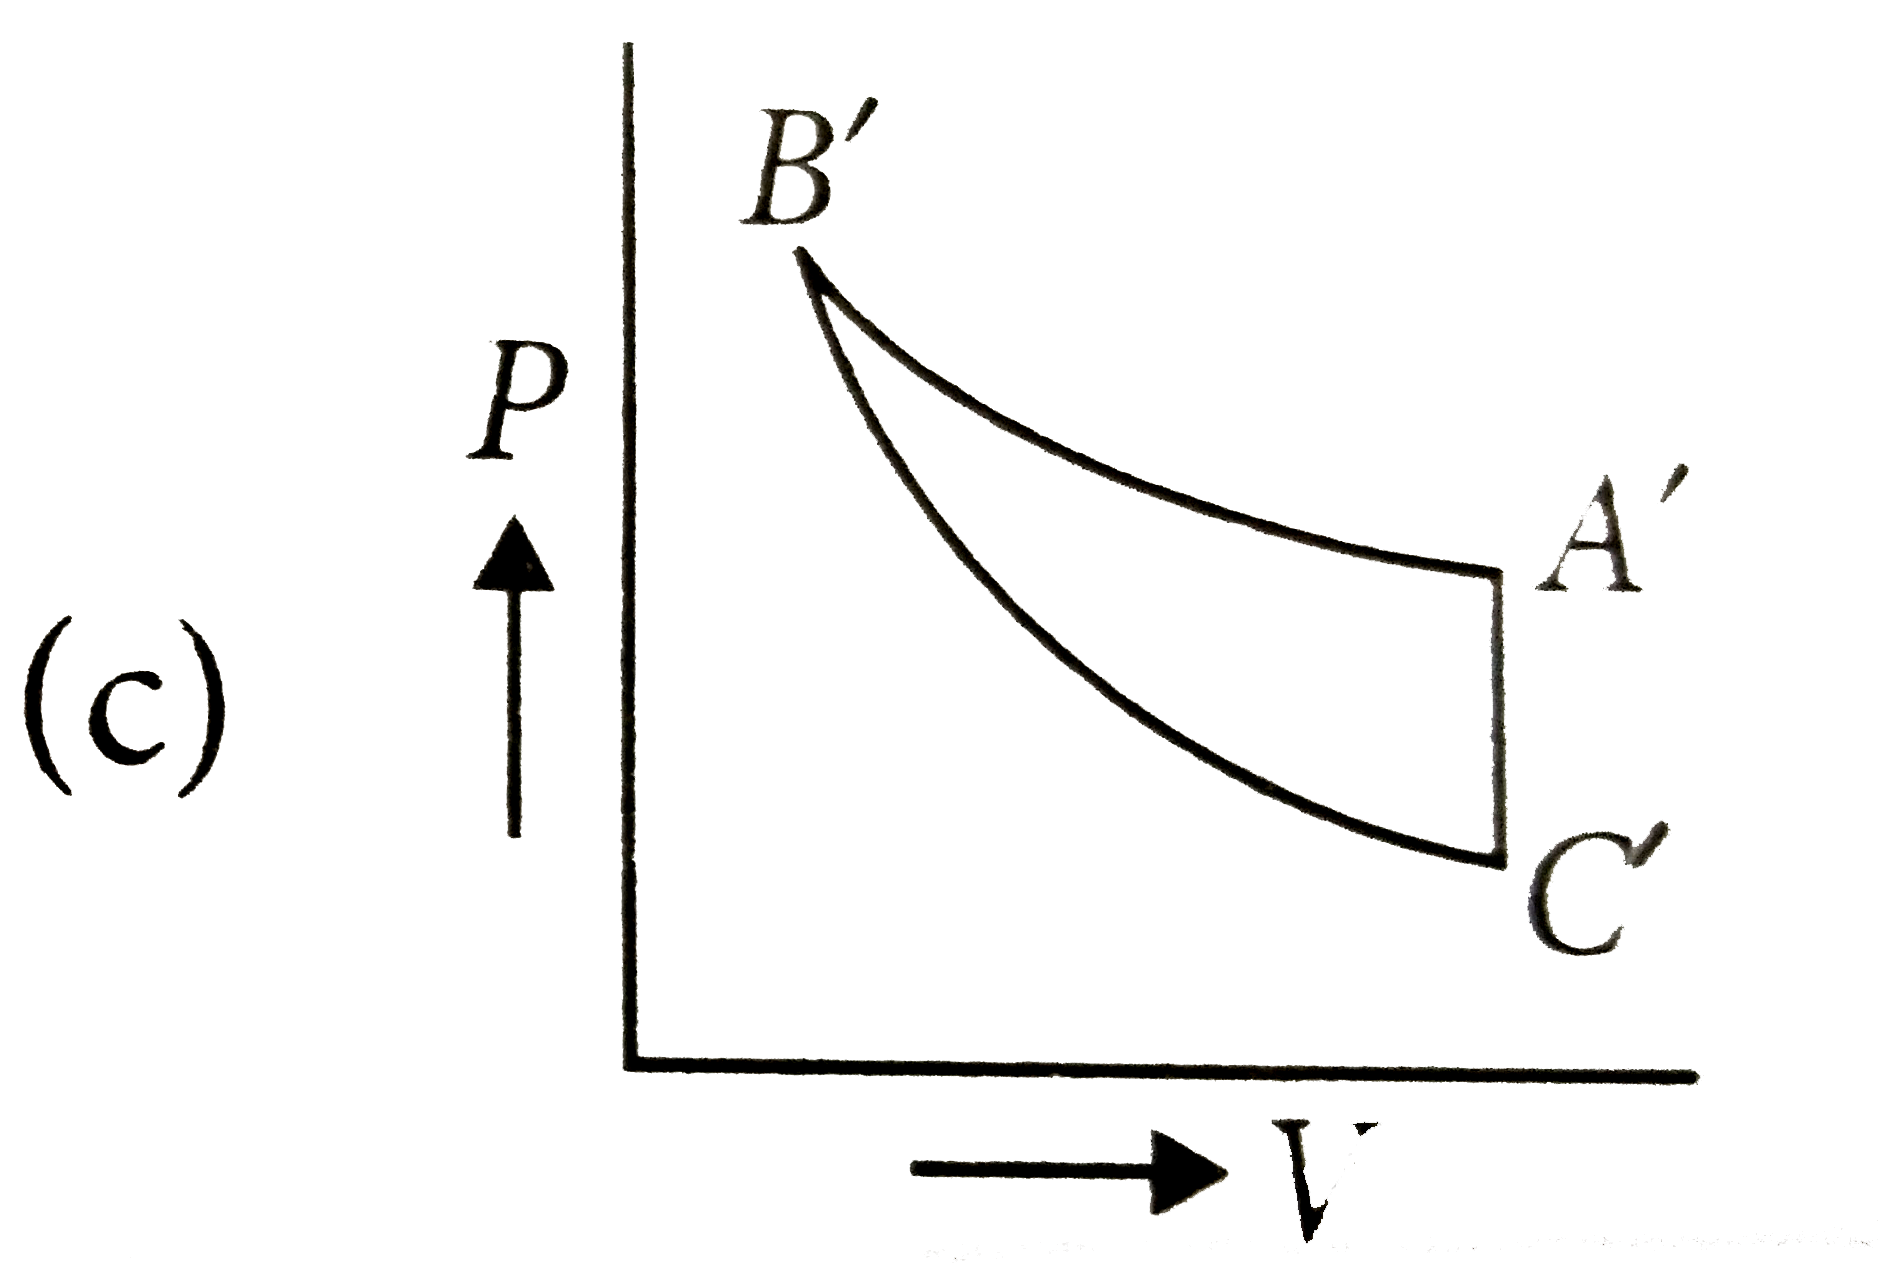 D
D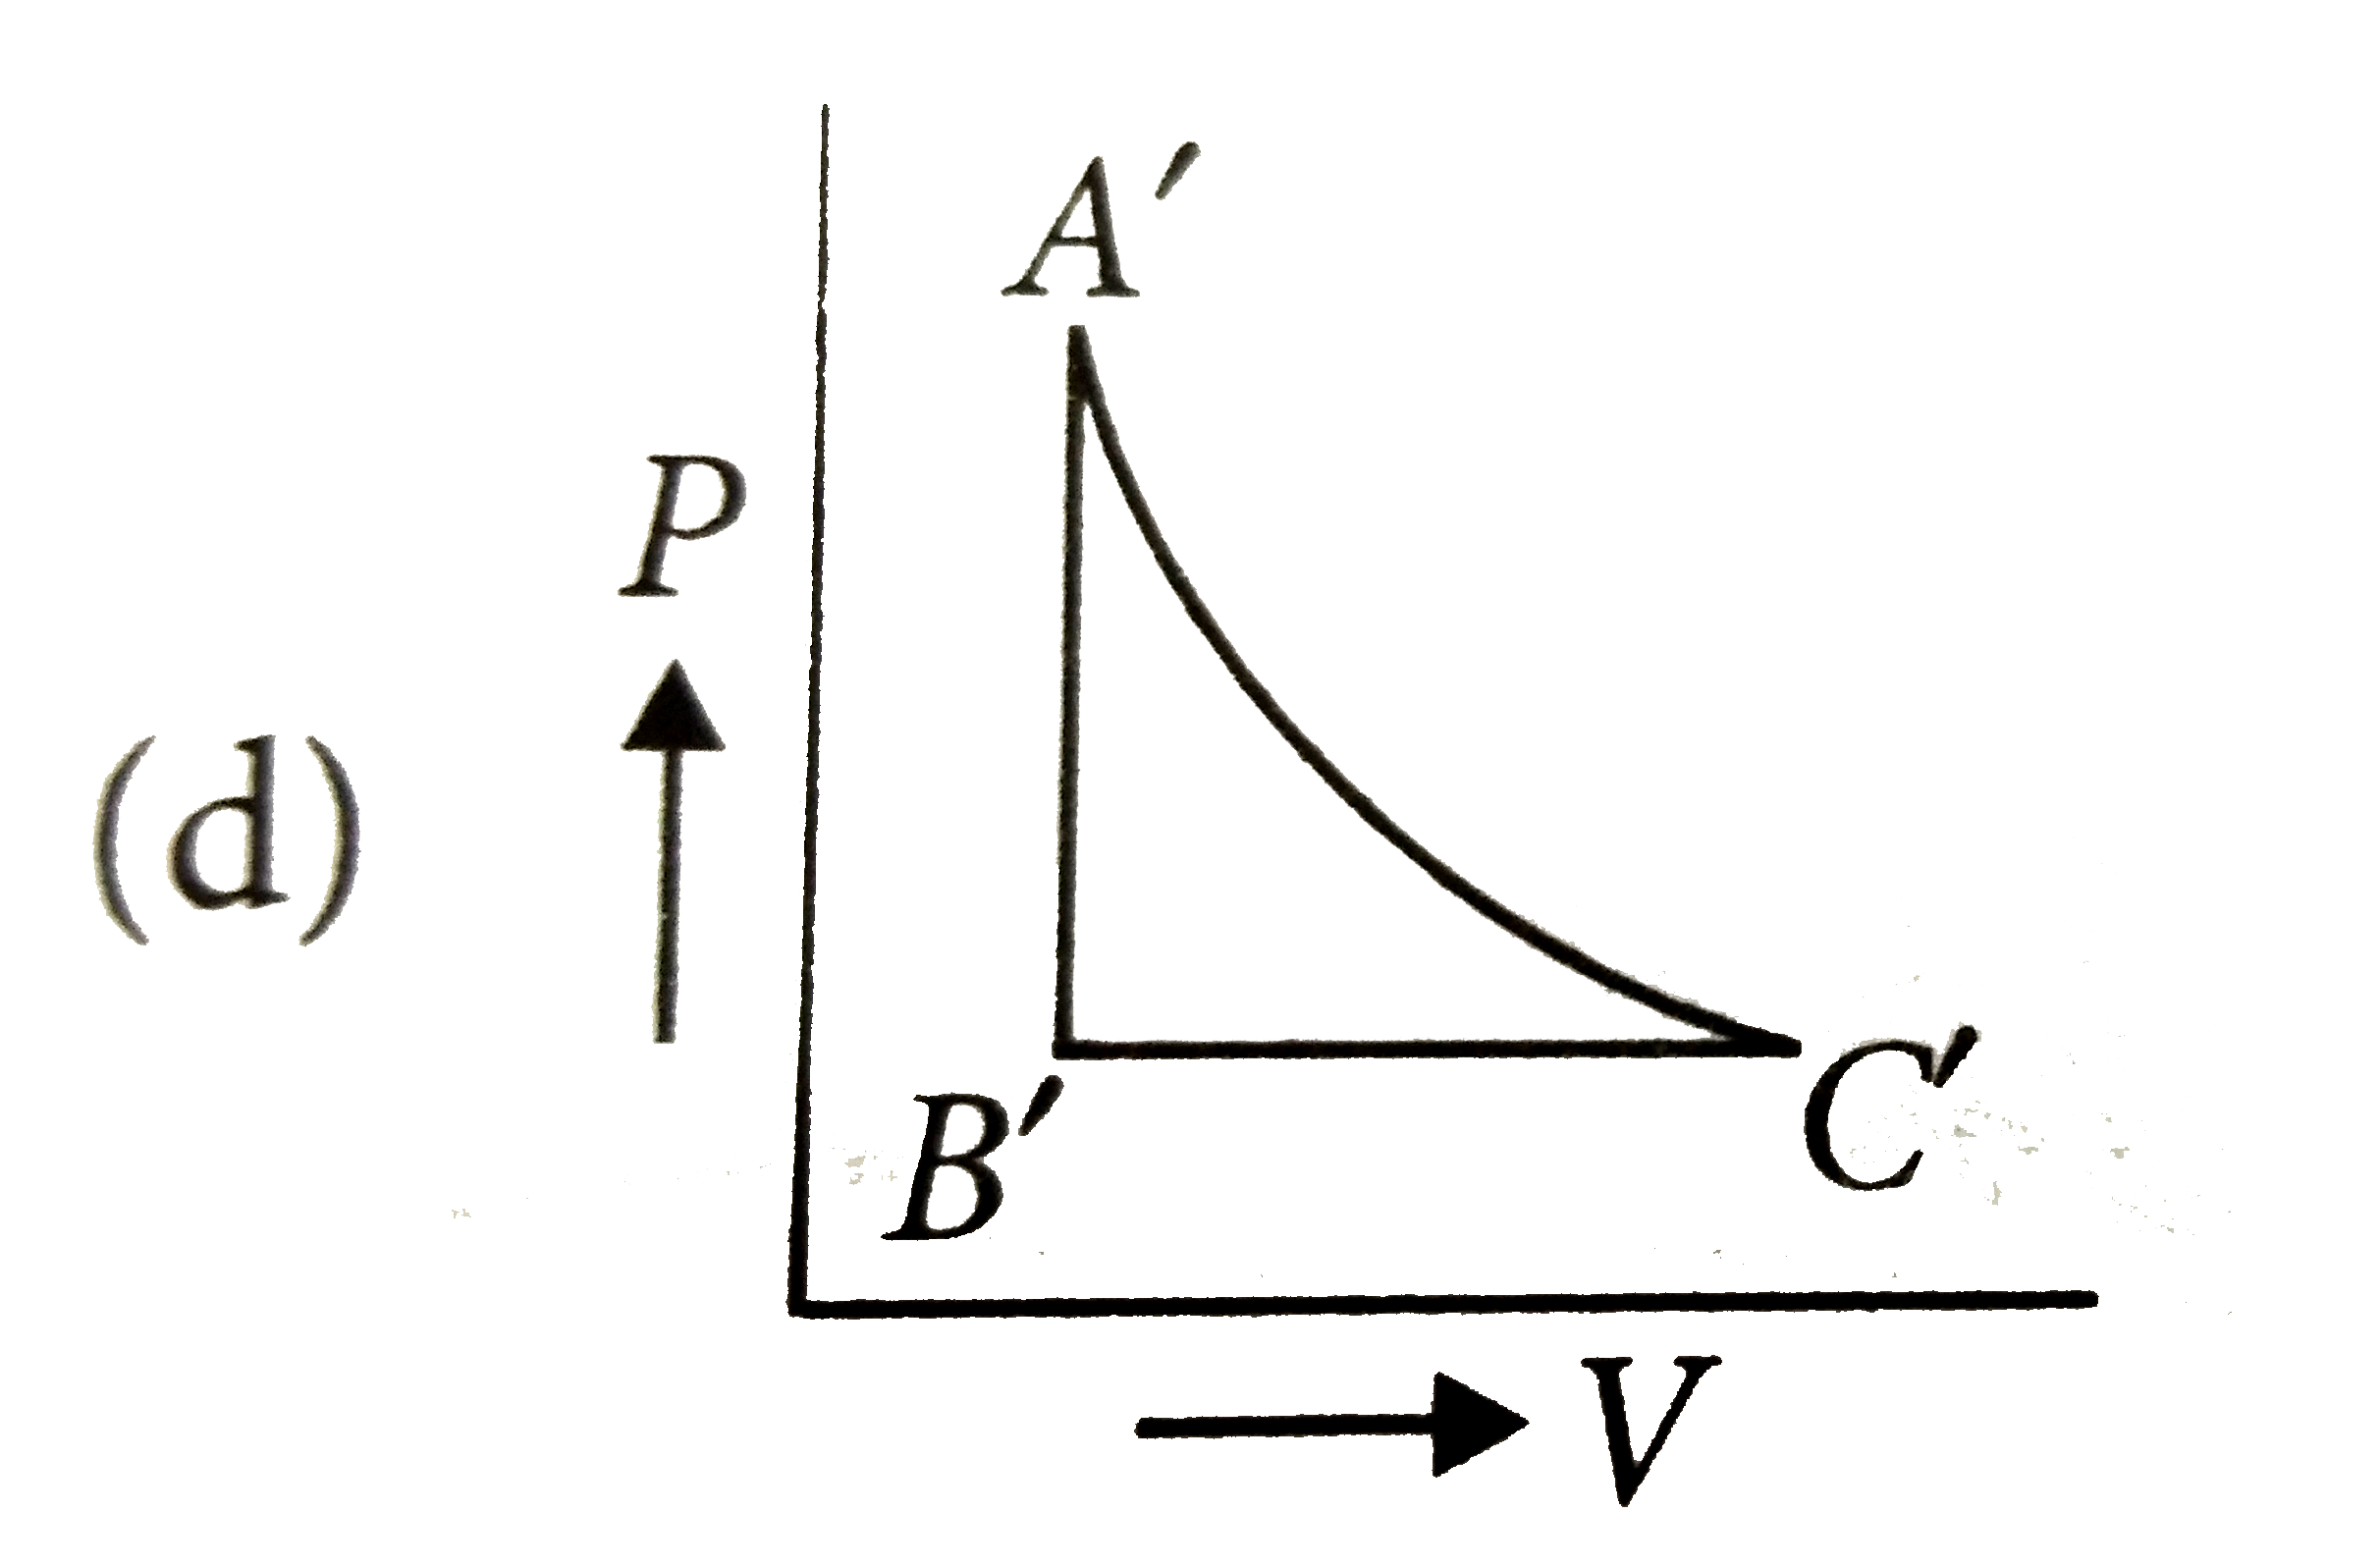
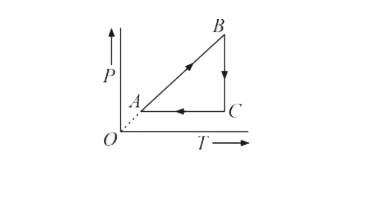
A cyclic process is shown in theP–T diagram. Which of the curves show the same process on a V–T diagram?
View SolutionA cyclic process is shown in theP–T diagram. Which of the curves show the same process on a V–T diagram?

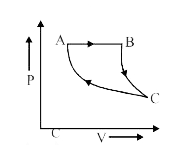
View SolutionFor a given thermodynamic process, the P – V diagram is as shown below:
Which of the following is the V – T diagram for the process?
A→B: isobaric
B→C: adiabatic
C→A : isothermal
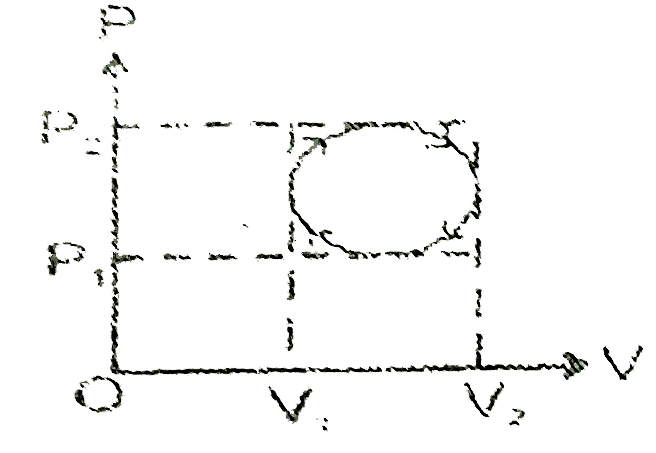
View SolutionIn a cyclic process shown on the P−V diargam the magnitude of the work done is :
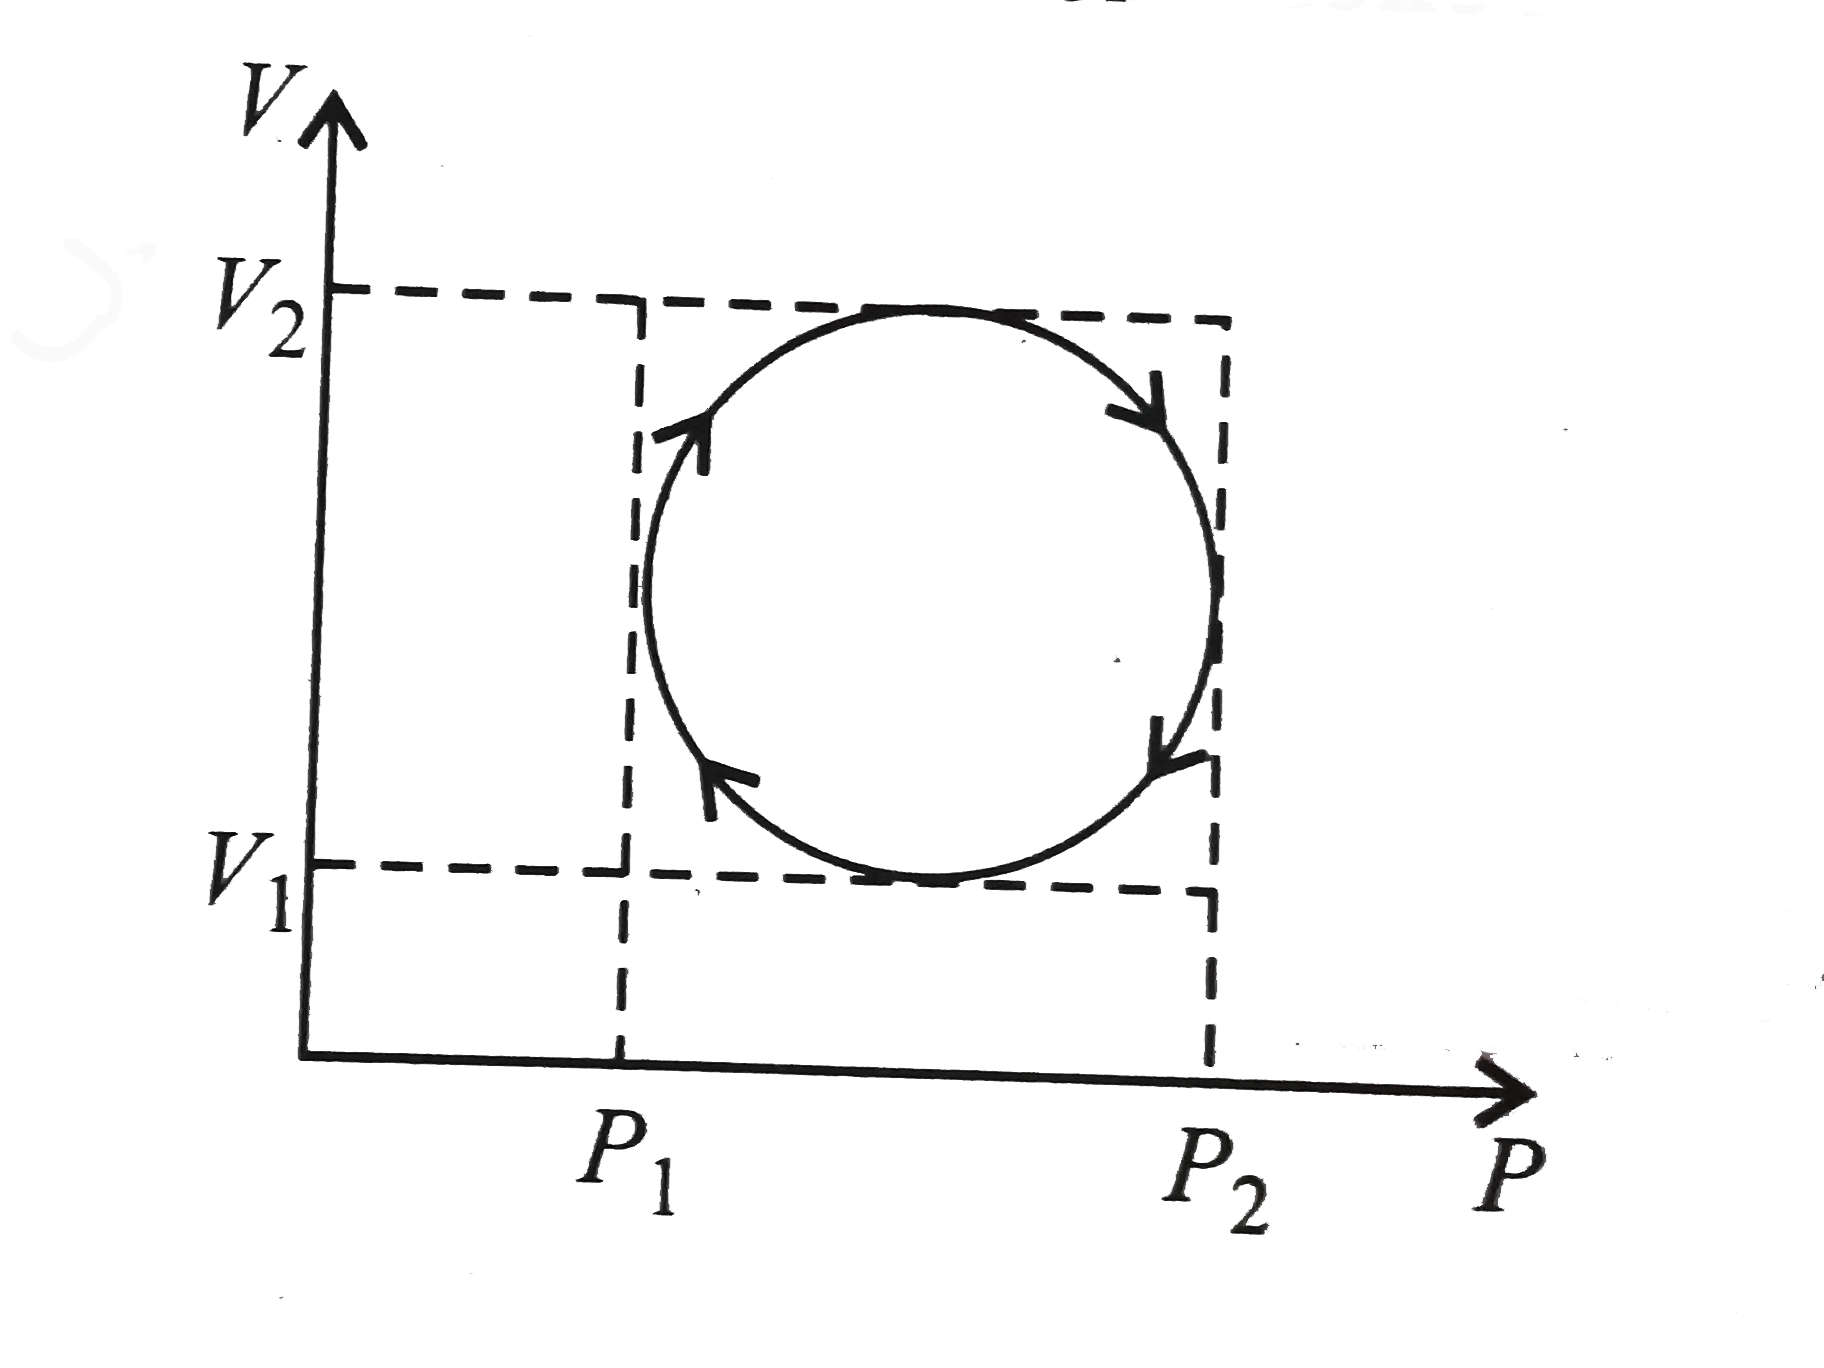
View SolutionIn the cyclic process shown on V−P diagram, the magnitude of the work done is
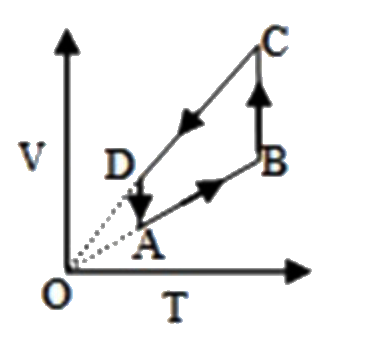
View SolutionA cyclic process is shown on the V - T diagram . The same process on a P - T diagram is shown by
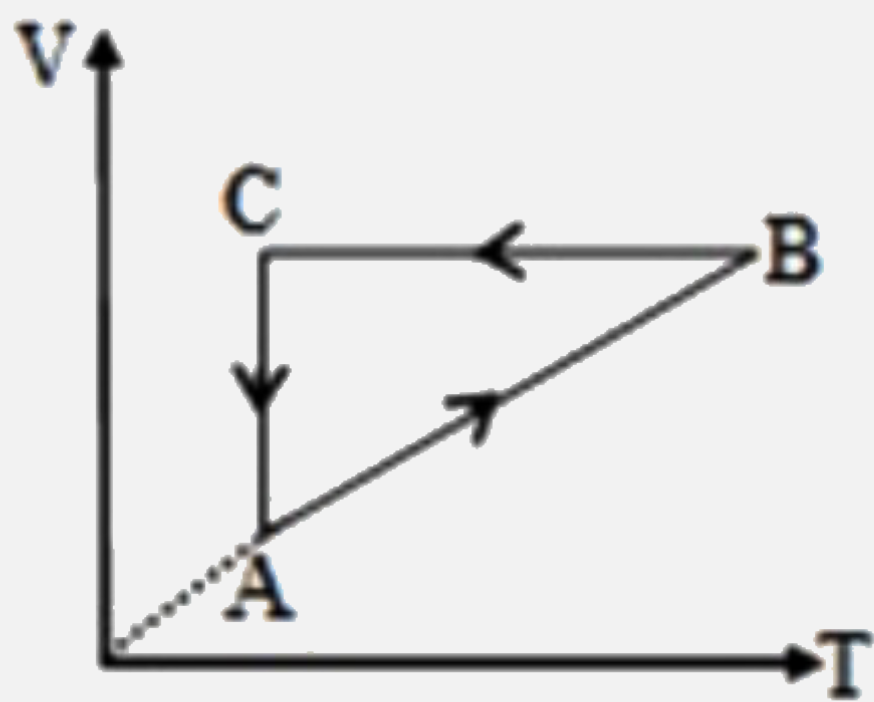
View SolutionA cyclic process ABCA is shown in the V - T diagram . Process on the P – V diagram is
View Solution

