IF C2H5OHandH2O solution is example of non-ideal solution then which graphically representation is correct?
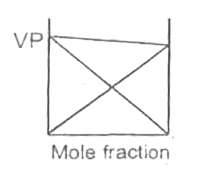
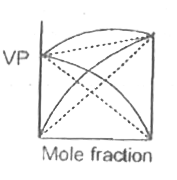
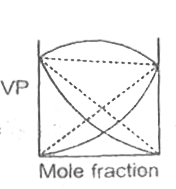
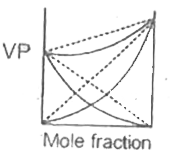
The correct Answer is:B
To determine the correct graphical representation of a non-ideal solution of ethanol (C₂H₅OH) and water (H₂O), we need to understand the behavior of this mixture in relation to Raoult's Law.
1. Understanding Non-Ideal Solutions:
- Non-ideal solutions do not obey Raoult's Law, which states that the vapor pressure of a solution is directly proportional to the mole fraction of the solvent.
- In the case of ethanol and water, the solution exhibits a positive deviation from Raoult's Law.
2. Reason for Positive Deviation:
- When ethanol and water are mixed, the hydrogen bonds that form between water molecules are disrupted.
- Ethanol forms weaker hydrogen bonds with water compared to the strong hydrogen bonds between water molecules themselves.
- As a result, the vapor pressure of the solution increases compared to what would be expected if Raoult's Law held true.
3. Graphical Representation:
- In a graphical representation of vapor pressure versus composition, a positive deviation is indicated by a curve that lies above the straight line that represents ideal behavior.
- This means that as the concentration of ethanol increases in the solution, the vapor pressure also increases.
4. Identifying the Correct Graph:
- Among the options provided, we need to look for a graph that shows an increase in vapor pressure as the mole fraction of ethanol increases.
- The correct graph will show a rising trend in vapor pressure for the solution, indicating that the vapor pressure is higher than expected for an ideal solution.
5. Conclusion:
- The correct representation of the ethanol-water solution, which shows positive deviation from Raoult's Law, is the graph that illustrates an increase in vapor pressure with an increase in the concentration of ethanol.
Final Answer:
The correct graphical representation is Option 2, which shows an increase in vapor pressure as the mole fraction of ethanol increases.
- Non-ideal solutions do not obey Raoult's Law, which states that the vapor pressure of a solution is directly proportional to the mole fraction of the solvent.
- In the case of ethanol and water, the solution exhibits a positive deviation from Raoult's Law.
- When ethanol and water are mixed, the hydrogen bonds that form between water molecules are disrupted.
- Ethanol forms weaker hydrogen bonds with water compared to the strong hydrogen bonds between water molecules themselves.
- As a result, the vapor pressure of the solution increases compared to what would be expected if Raoult's Law held true.
- In a graphical representation of vapor pressure versus composition, a positive deviation is indicated by a curve that lies above the straight line that represents ideal behavior.
- This means that as the concentration of ethanol increases in the solution, the vapor pressure also increases.
- Among the options provided, we need to look for a graph that shows an increase in vapor pressure as the mole fraction of ethanol increases.
- The correct graph will show a rising trend in vapor pressure for the solution, indicating that the vapor pressure is higher than expected for an ideal solution.
- The correct representation of the ethanol-water solution, which shows positive deviation from Raoult's Law, is the graph that illustrates an increase in vapor pressure with an increase in the concentration of ethanol.
The correct graphical representation is Option 2, which shows an increase in vapor pressure as the mole fraction of ethanol increases.
Similar Questions
Which is not an example of an ideal solution ?
View SolutionFor non ideal solution (positive deviation) which of the following
is/are correct?
View Solution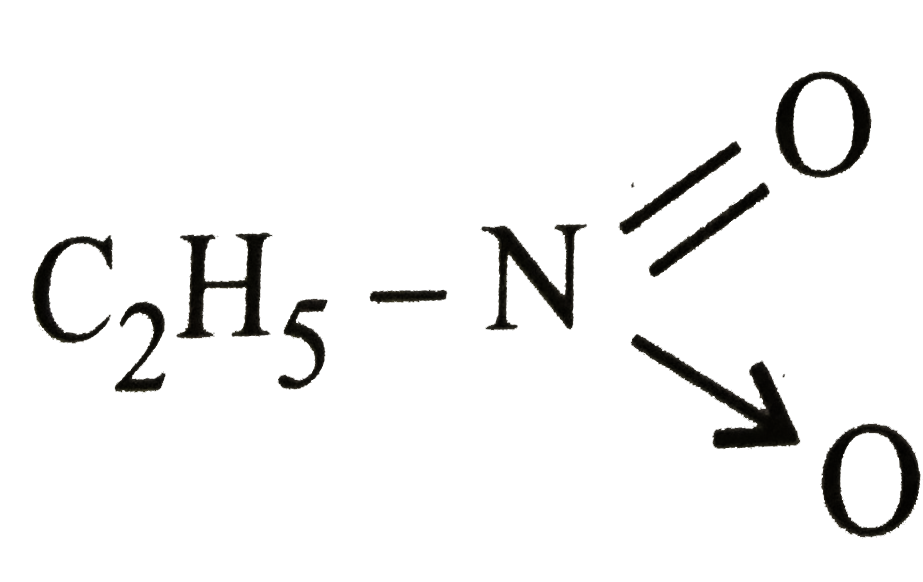 and C2H5−O−N=O are examples of
View SolutionColloidal solution show in H2O :-
View SolutionWhat is the molality of C2H5OH in water solution which will freeze at −10∘C?
View Solution20 " mL of " H2O2 is reacted completely with acidified K2Cr2O7 solution 40 " mL of " K2Cr3O7 solution was required to oxidised the H2O2 completely. Also, 2.0 " mL of " the same K2Cr2O7 solution required 5.0 " mL of " a 1.0 M H2C2O4 solution to reach equivalence point. Which of the following statements is/are correct?
View SolutionFor a non-ideal solution, ΔmixV and ΔmixH are zero.
View SolutionA fresh H2O2 solution is labelled 11.2V. This solution has the same concentration as a solution which is
View SolutionA: CuSO45H2O is a solution of liquid in solid.
R: Solution is a homogeneous mixture.
View SolutionA sample of H2O2 solution labelled as "28 volume" has density of 265 g/L. Mark the correct option(s) representing concentration of same solution in other units :
(a)MH2O2=2.5
(b)%wV=17
(c)Mole fraction of H2O2 = 0.2
(d)mH2O2=13.88
View Solution
