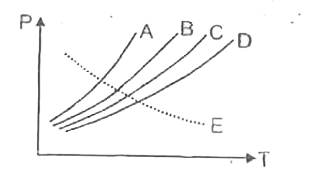
Vapour pressure diagram of some liquids plotted against temperature are shown below

Most volatile liquid
A
B
C
D
The correct Answer is:A
Step by step video & image solution for Vapour pressure diagram of some liquids plotted against temperature are shown below Most volatile liquid by Chemistry experts to help you in doubts & scoring excellent marks in Class 12 exams.
Updated on:21/07/2023Similar Questions
Knowledge Check
Vapour pressure of a liquid decreases with
Adecrease in temperatureBincrease in temperatureCincrease in surface areaDincrease in volume .
Why is the vapour pressure of liquid constant at a constant temperature ?
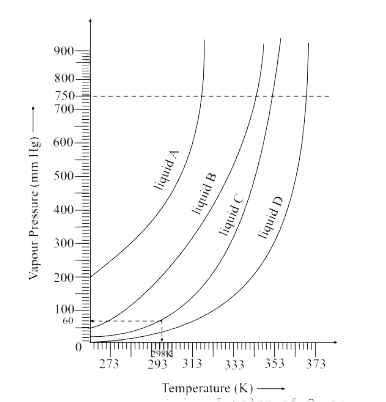
View SolutionThe variation of vapour pressure of different liquids with temperature is shown in figure

If we take liquid C in a closed vessel and heat it continuously. At what temperature will it boil?
View SolutionThe vapour pressure of a given liquid will increase if
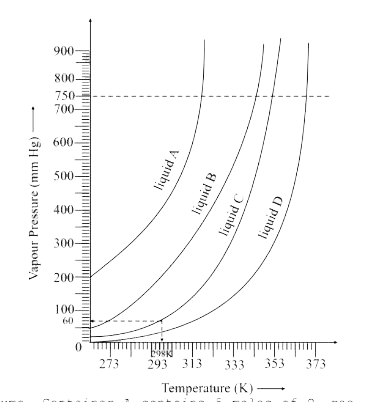
View SolutionThe variation of vapour pressure of different liquids with temperature is shown in figure

Calculate graphically boiling points of liquids A and B.
View SolutionThe vapour pressure of a given liquid will decrease if :
View SolutionThe vapour pressure of a liquid in a closed container depends upon (1) temperature of liquid (2) quantity of liquid (3) surface area of the liquid
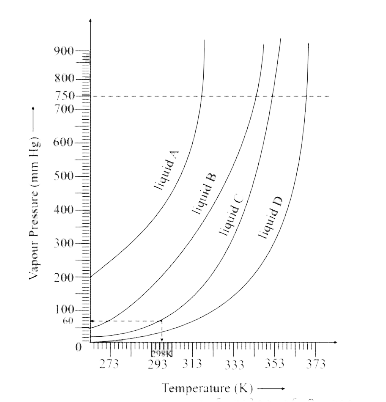
View SolutionThe variation of vapour pressure of different liquids with temperature is shown in figure

At high altitude, atmospheric pressure is low (say 60 mm Hg). At what temperature liquid D boils?
View Solution