Boyle's temperature Tb is equal to
ab
abR
2abR
a2bR
Step by step video & image solution for Boyle's temperature T_(b) is equal to by Chemistry experts to help you in doubts & scoring excellent marks in Class 12 exams.
Updated on:21/07/2023Topper's Solved these Questions
- STATES OF MATTERBOOK - AAKASH INSTITUTE ENGLISHCHAPTER - STATES OF MATTEREXERCISE - ASSIGNMENT (SECTION-B)
34 Videos
- STATES OF MATTERBOOK - AAKASH INSTITUTE ENGLISHCHAPTER - STATES OF MATTEREXERCISE - ASSIGNMENT (SECTION-C)
29 Videos
- STATES OF MATTERBOOK - AAKASH INSTITUTE ENGLISHCHAPTER - STATES OF MATTEREXERCISE - TRY YOURSELF
34 Videos
- SOME BASIC CONCEPTS OF CHEMISTRY BOOK - AAKASH INSTITUTE ENGLISHCHAPTER - SOME BASIC CONCEPTS OF CHEMISTRY EXERCISE - ASSIGNMENT SECTION J (Aakash Challenges Questions)
10 Videos
- STRUCTURE OF ATOMBOOK - AAKASH INSTITUTE ENGLISHCHAPTER - STRUCTURE OF ATOMEXERCISE - ASSIGNMENT (SECTION -D) Assertion-Reason Type Questions
15 Videos
Similar Questions
At Boyle temperature
View SolutionBoyle's temperature (TB) : It is the temperature at which a real gas exhibits ideal behavior in low pressure range. Different gases have different value of TB, which is related to the van der Wall's constant a and ab as follows: TB=aRb
The compressiblity factor for a real gas is given as Z=1+0.35P−168TP. Where P is in bar and T is in Kelvin. What is the Boyle's temperature of the gas?
View SolutionThe van der Waals' constantes for a gas are a=3.6atmL2mol−2,b=0.6Lmol−1 .If R=0.08LatmK−1mol−1 and the Boyle's temperature (K) is TB of this gas, then what is the value of TB15?
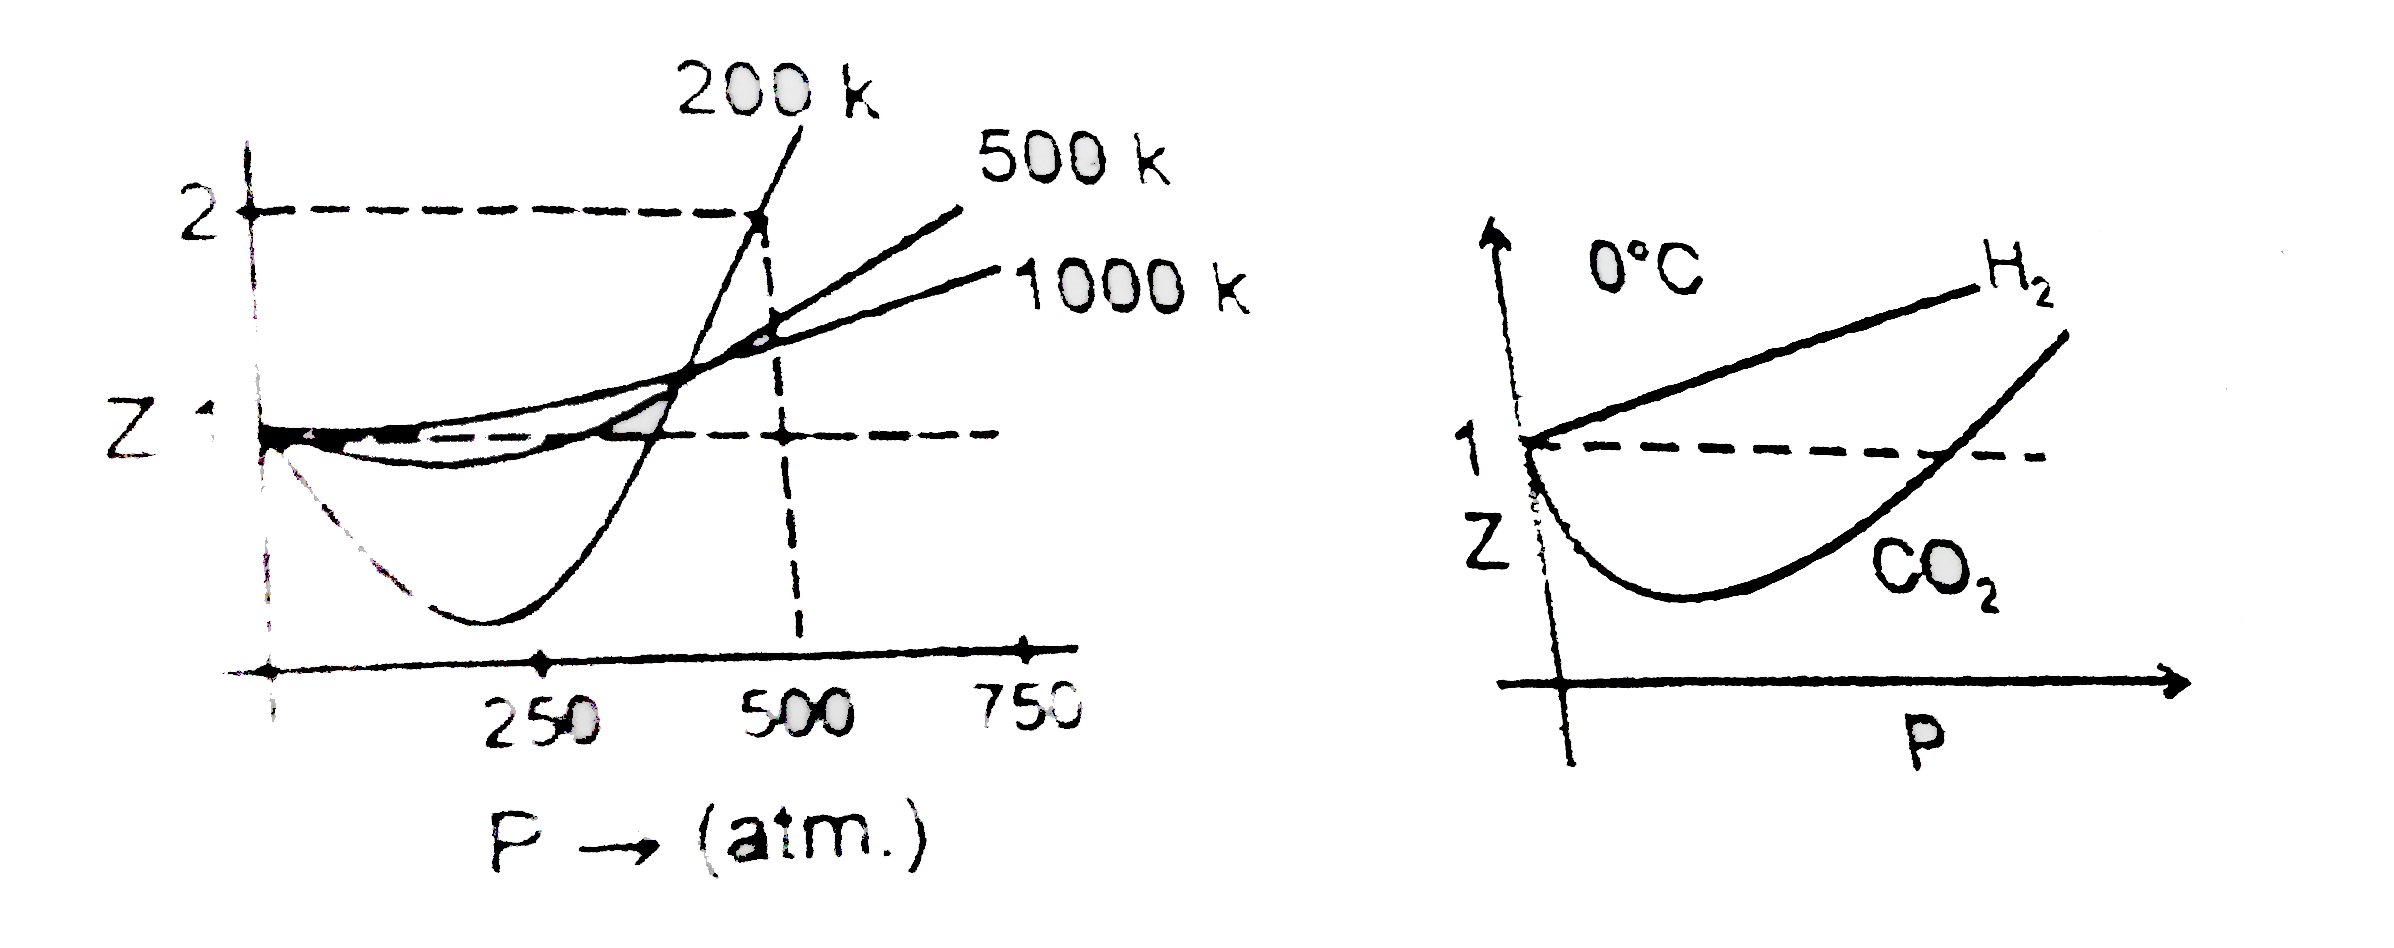
View SolutionSketch shows the plot of Z v/s P for a hypothetical gas for one mole at three distint temperature.

Boyle's temperature is the temperature at which gas shows ideal behaviour over a pressure range in the low pressure region.Boyle's temperature (Tb)=aRb.If a plot is obtained at temperature well below Boyle's temperature then the curve will show negative deviation, in low pressure region and positive deviation in the high pressure region. Near critical temperature the curve is more likely as CO2 and the temperature well above critical temperature curve is more like H2 at 0∘C as shown above.At high pressure suppose all the constant temperature curve varies linearly with pressure according to the following equation : Z=1+PbRT (R=2calmol−1K−1)
Which of the following is correct :
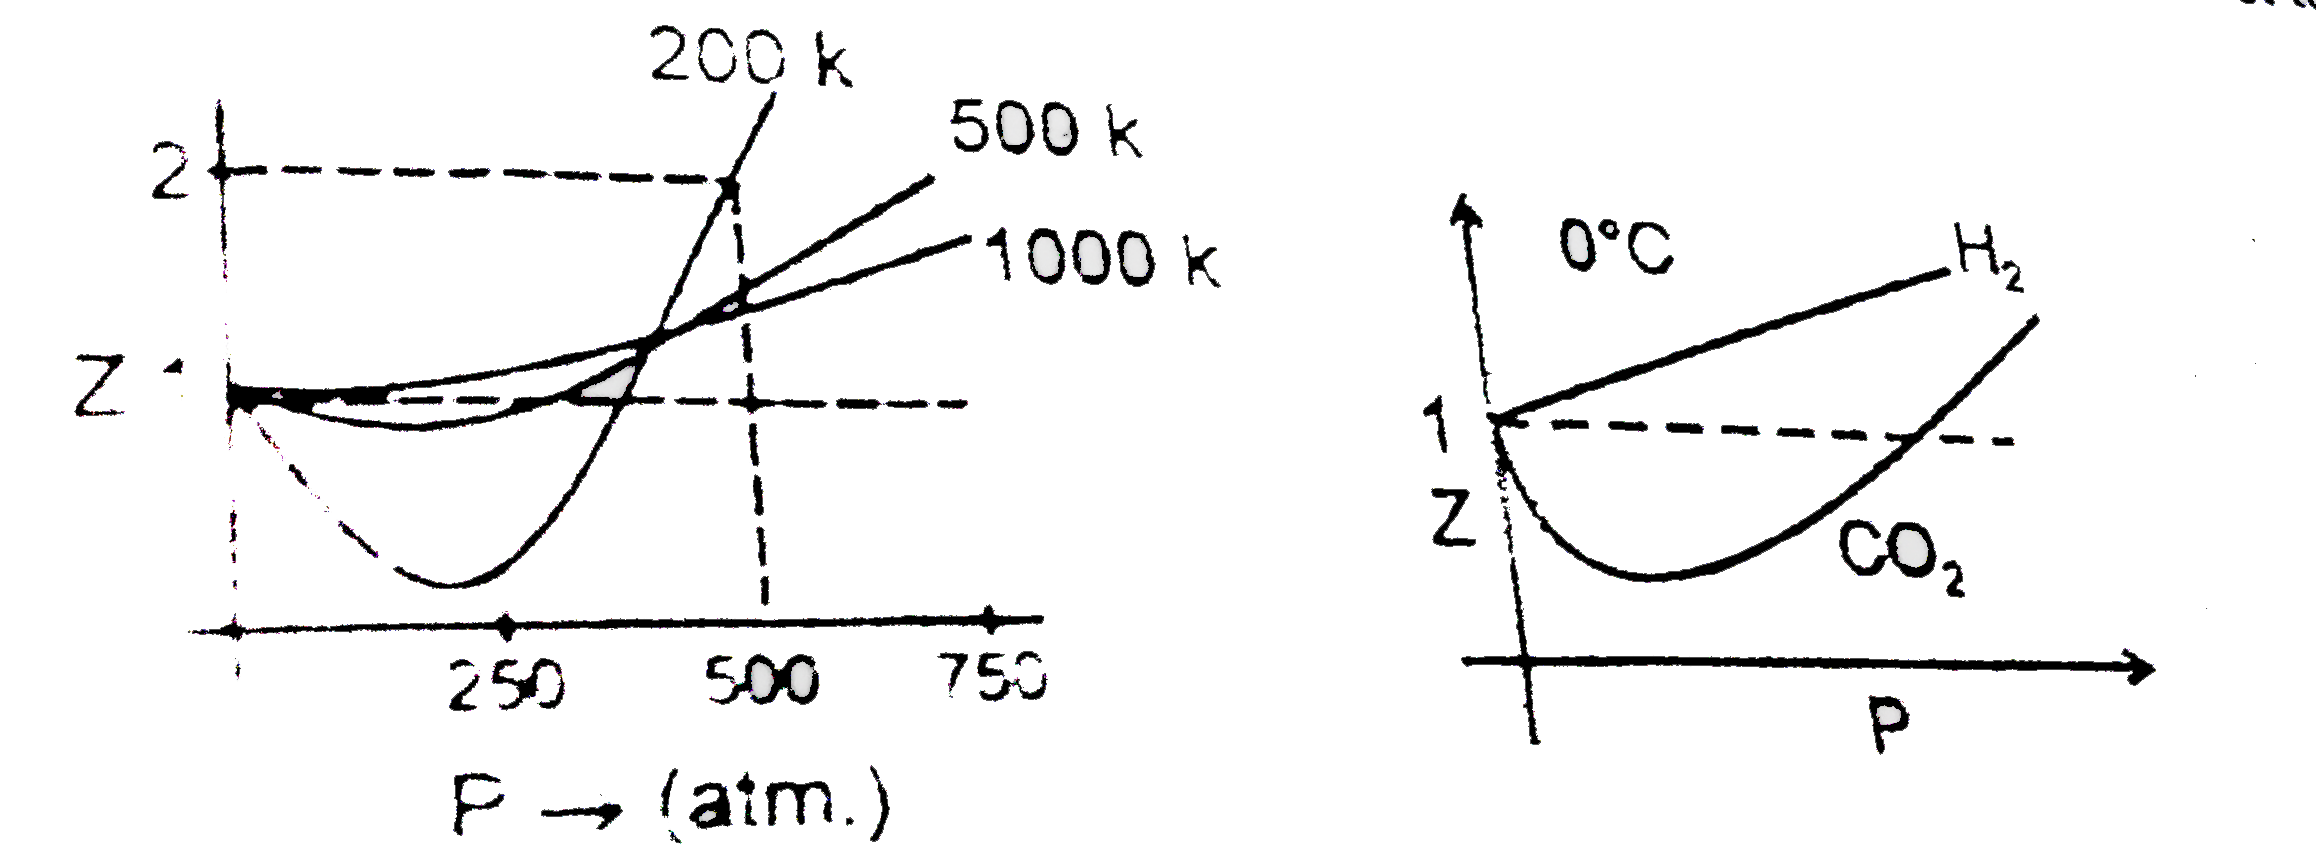
View SolutionSketch shows the plot of Z v/s P for a hypothetical gas for one mole at three distint temperature.

Boyle's temperature is the temperature at which gas shows ideal behaviour over a pressure range in the low pressure region.Boyle's temperature (Tb)=aRb.If a plot is obtained at temperature well below Boyle's temperature then the curve will show negative deviation, in low pressure region and positive deviation in the high pressure region. Near critical temperature the curve is more likely as CO2 and the temperature well above critical temperature curve is more like H2 at 0∘C as shown above.At high pressure suppose all the constant temperature curve varies linearly with pressure according to the following equation : Z=1+PbRT (R=2calmol−1K−1)
For 500 K plot value of Z changes from 2 to 2.2 if pressure is varied from 1000 atm to 1200 atm (high pressure ) then the value of bRT will be
View SolutionInternal energy of n moles of helium at temperature T1K is equal to the internal energy of 2n moles of oxygen gas at temperature T2K then the value of T1T2will be
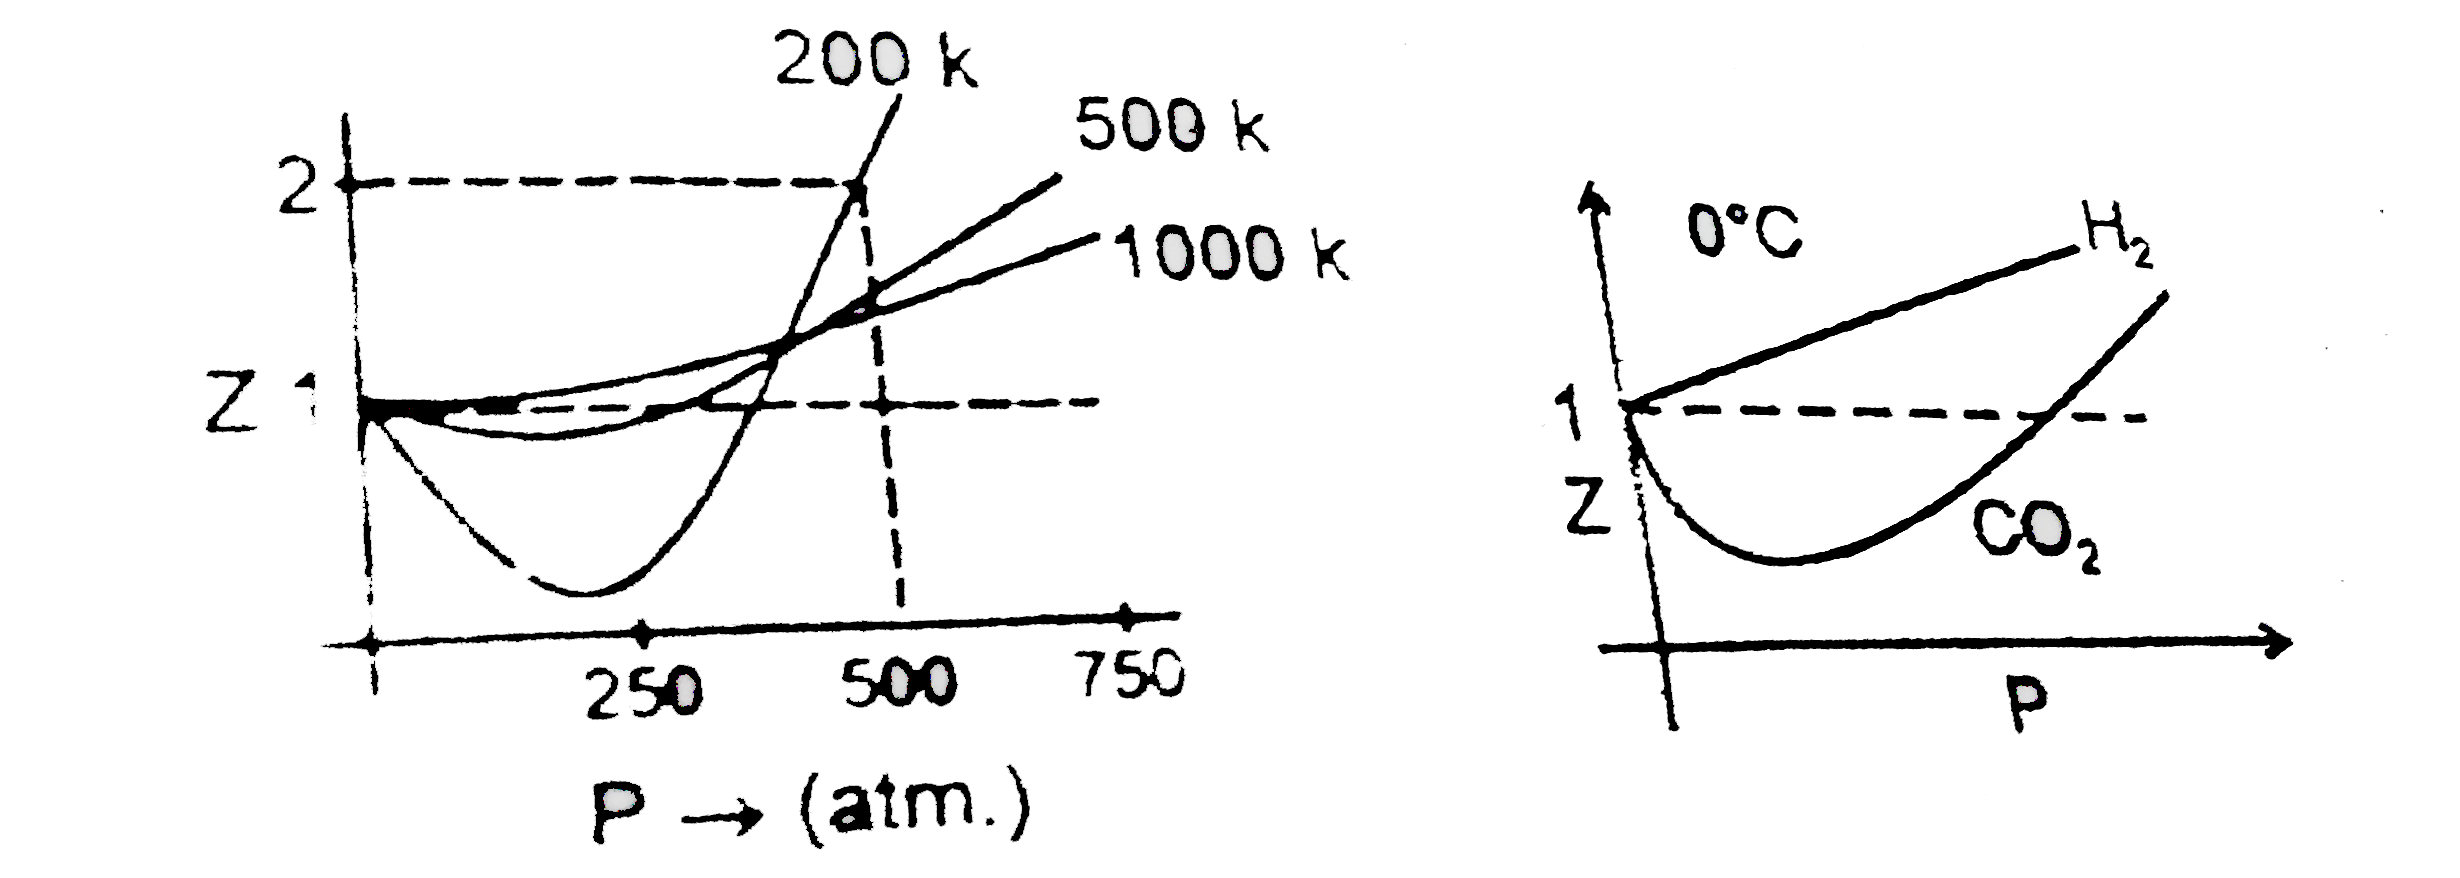
View SolutionSketch shows the plot of Z v/s P for a hypothetical gas for one mole at three distint temperature.

Boyle's temperature is the temperature at which gas shows ideal behaviour over a pressure range in the low pressure region.Boyle's temperature (Tb)=aRb.If a plot is obtained at temperature well below Boyle's temperature then the curve will show negative deviation, in low pressure region and positive deviation in the high pressure region. Near critical temperature the curve is more likely as CO2 and the temperature well above critical temperature curve is more like H2 at 0∘C as shown above.At high pressure suppose all the constant temperature curve varies linearly with pressure according to the following equation : Z=1+PbRT (R=2calmol−1K−1)
In very high pressure region if Z v/s P is plotted at 1200 K for the above gas then it will have greatest slope.
View SolutionThe correct order of temperature of a real gas is :
(I) Boyle's temperature
(II) Critical temperature
(III) Inversion temperature
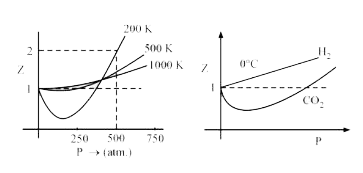
View SolutionSketch shows the plot of Z vs P for 1 mol of a hypothetical gas at three distinct temperature.

Boyle’s temperature is the temperature at which a gas shows ideal behaviour over a pressure range in the low pressure region. Boyle’s temperature (Tb)=aRb. If a plot is obtained at temperatures well below Boyle’s temperature then the curve will show negative deviation, in low pressure region and positive deviation in the high pressure region. Near critical temperature the curve is more like CO2 and the temperature well above critical temperature curve is more like H2 as shown above. At high pressure suppose all the constant temperature curve varies linearly with pressure according to the following equation: Z=1+PbRT(R=2calmol−1K−1)
For 500 K plot the value of Z changes from 2 to 2.2 if pressure is varied from 1000 atm to 1200 atm (high pressure) then the value of bRT will be :
View SolutionWhat is Boyle's temperature?
View Solution
