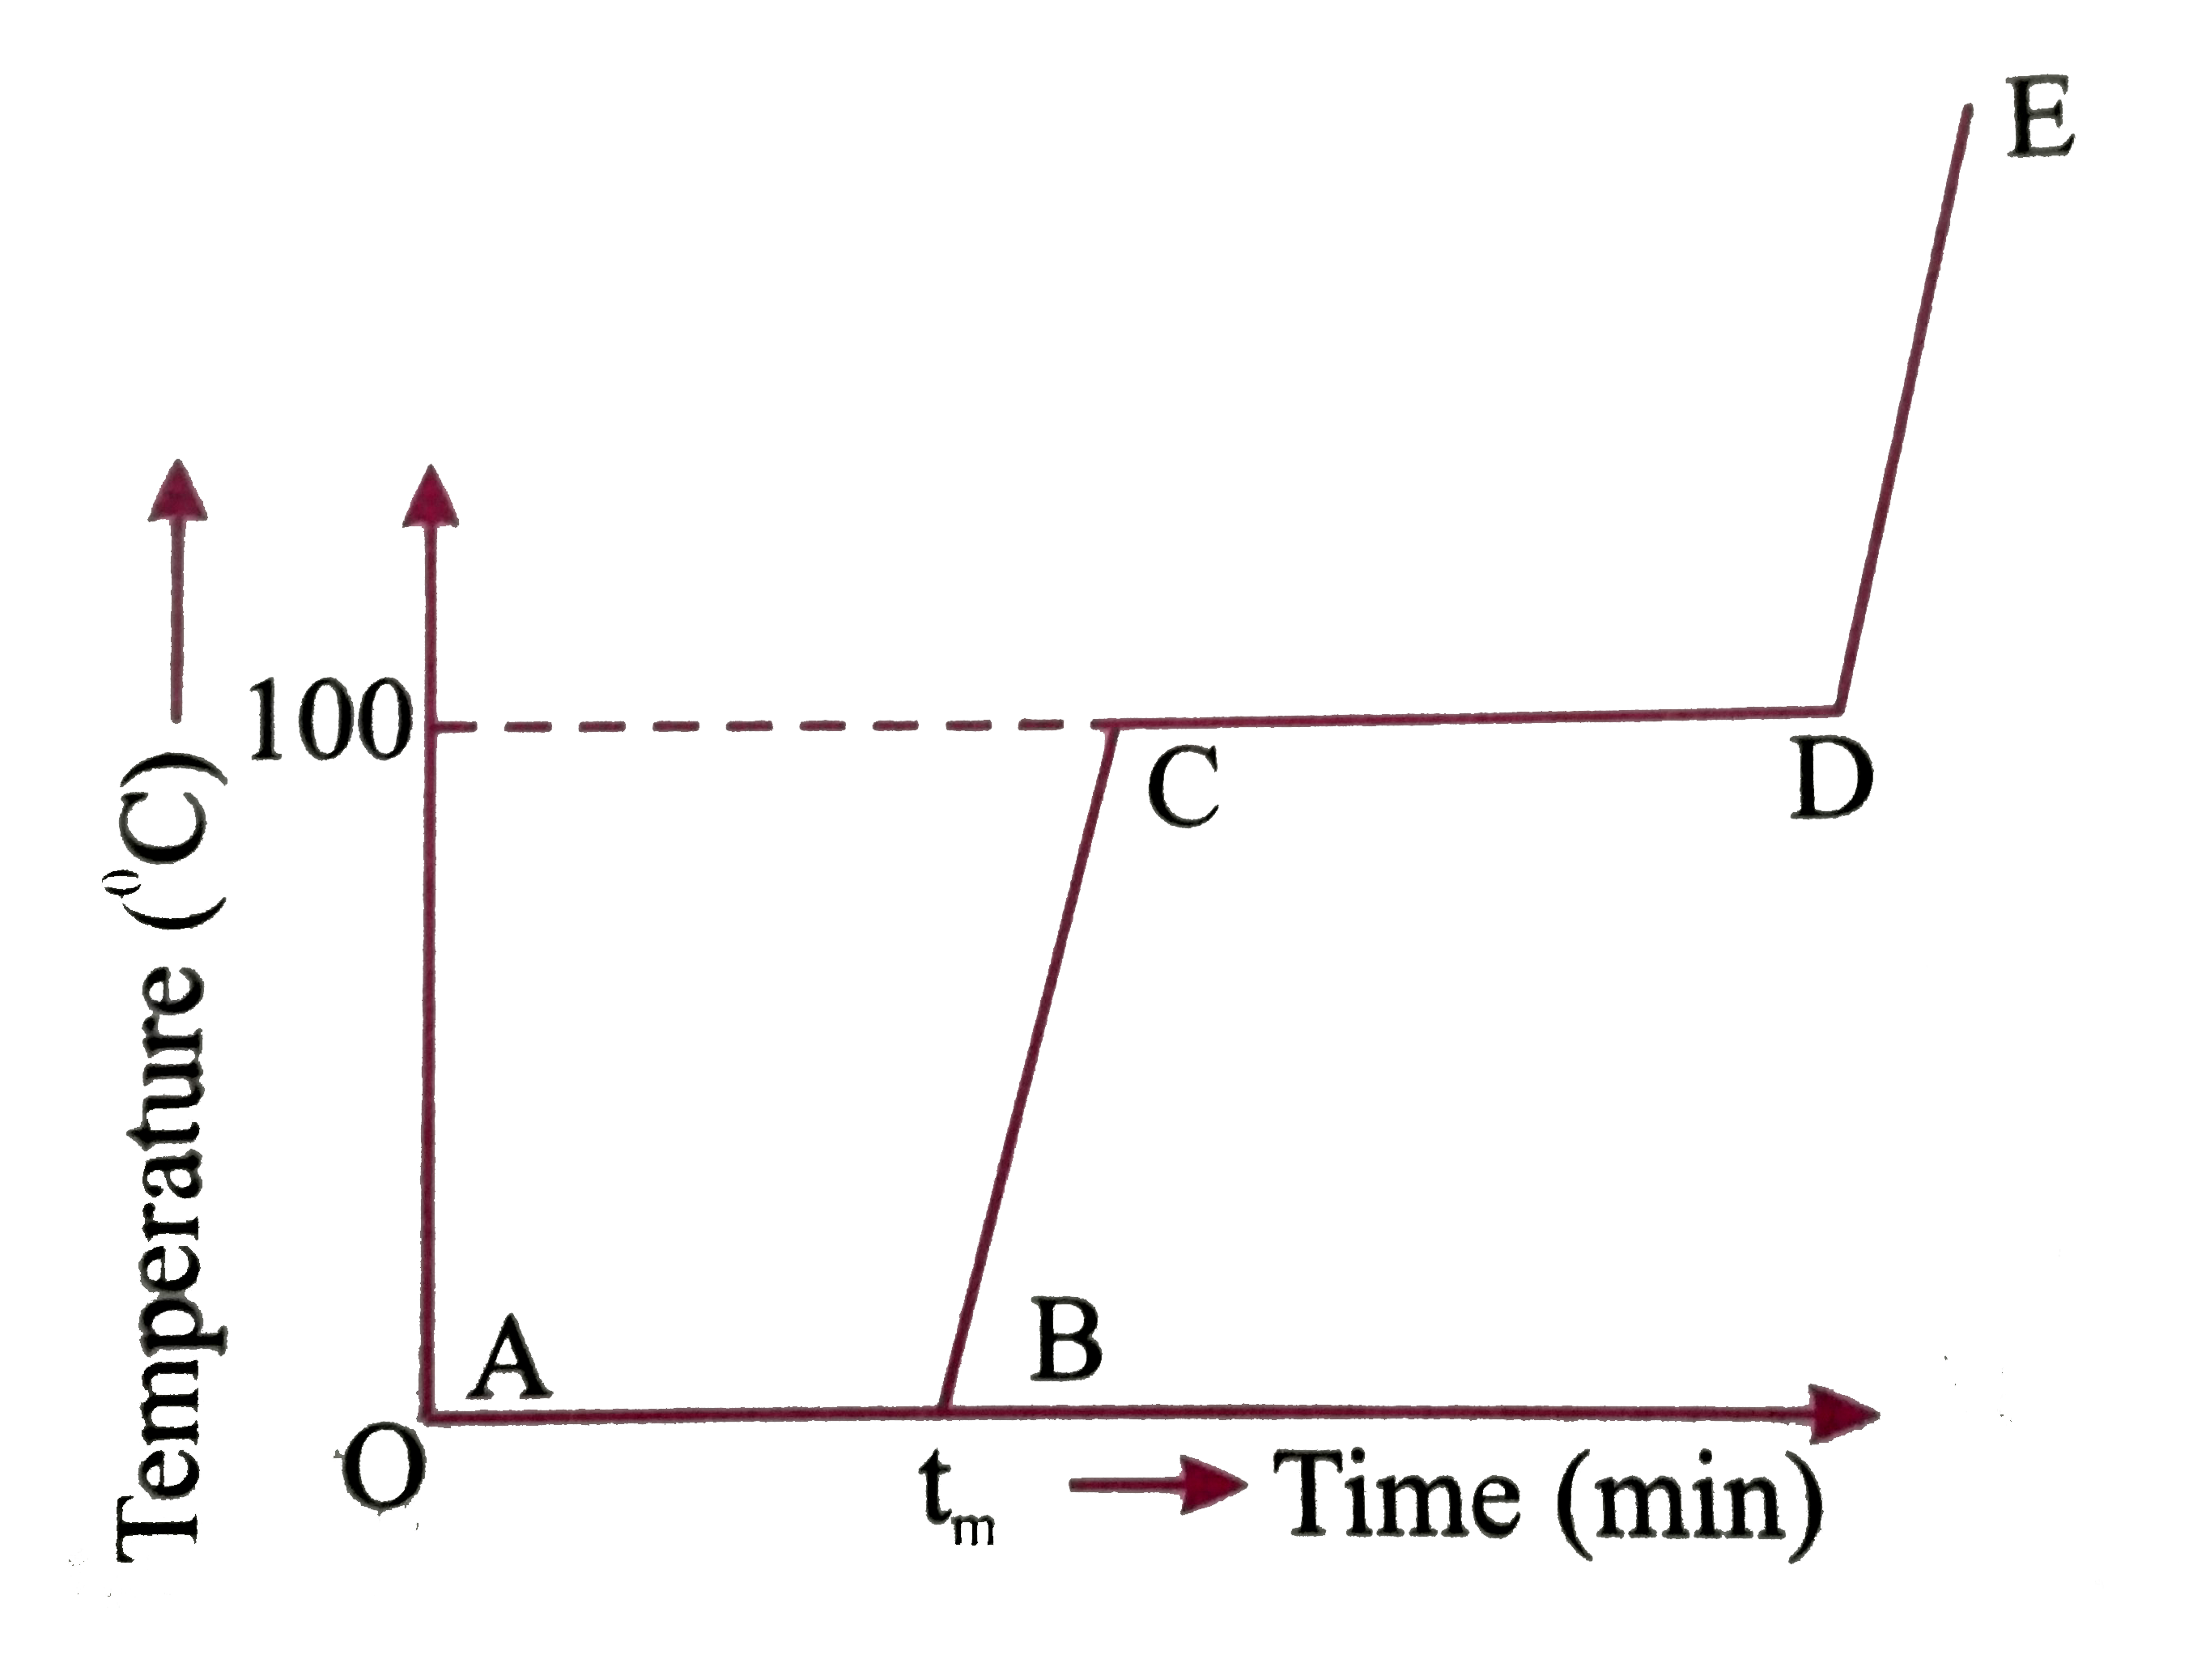
For the following temperature-time graph, in which region the state of material changes 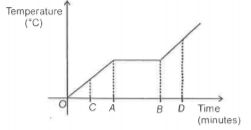
OC
AB
BO
CA
The correct Answer is:B
Step by step video & image solution for For the following temperature-time graph, in which region the state of material changes by Physics experts to help you in doubts & scoring excellent marks in Class 12 exams.
Updated on:21/07/2023Topper's Solved these Questions
Similar Questions
Knowledge Check
Refer to the plot of temperature versus time showing the changes in the state of ice on heating (not to scale).
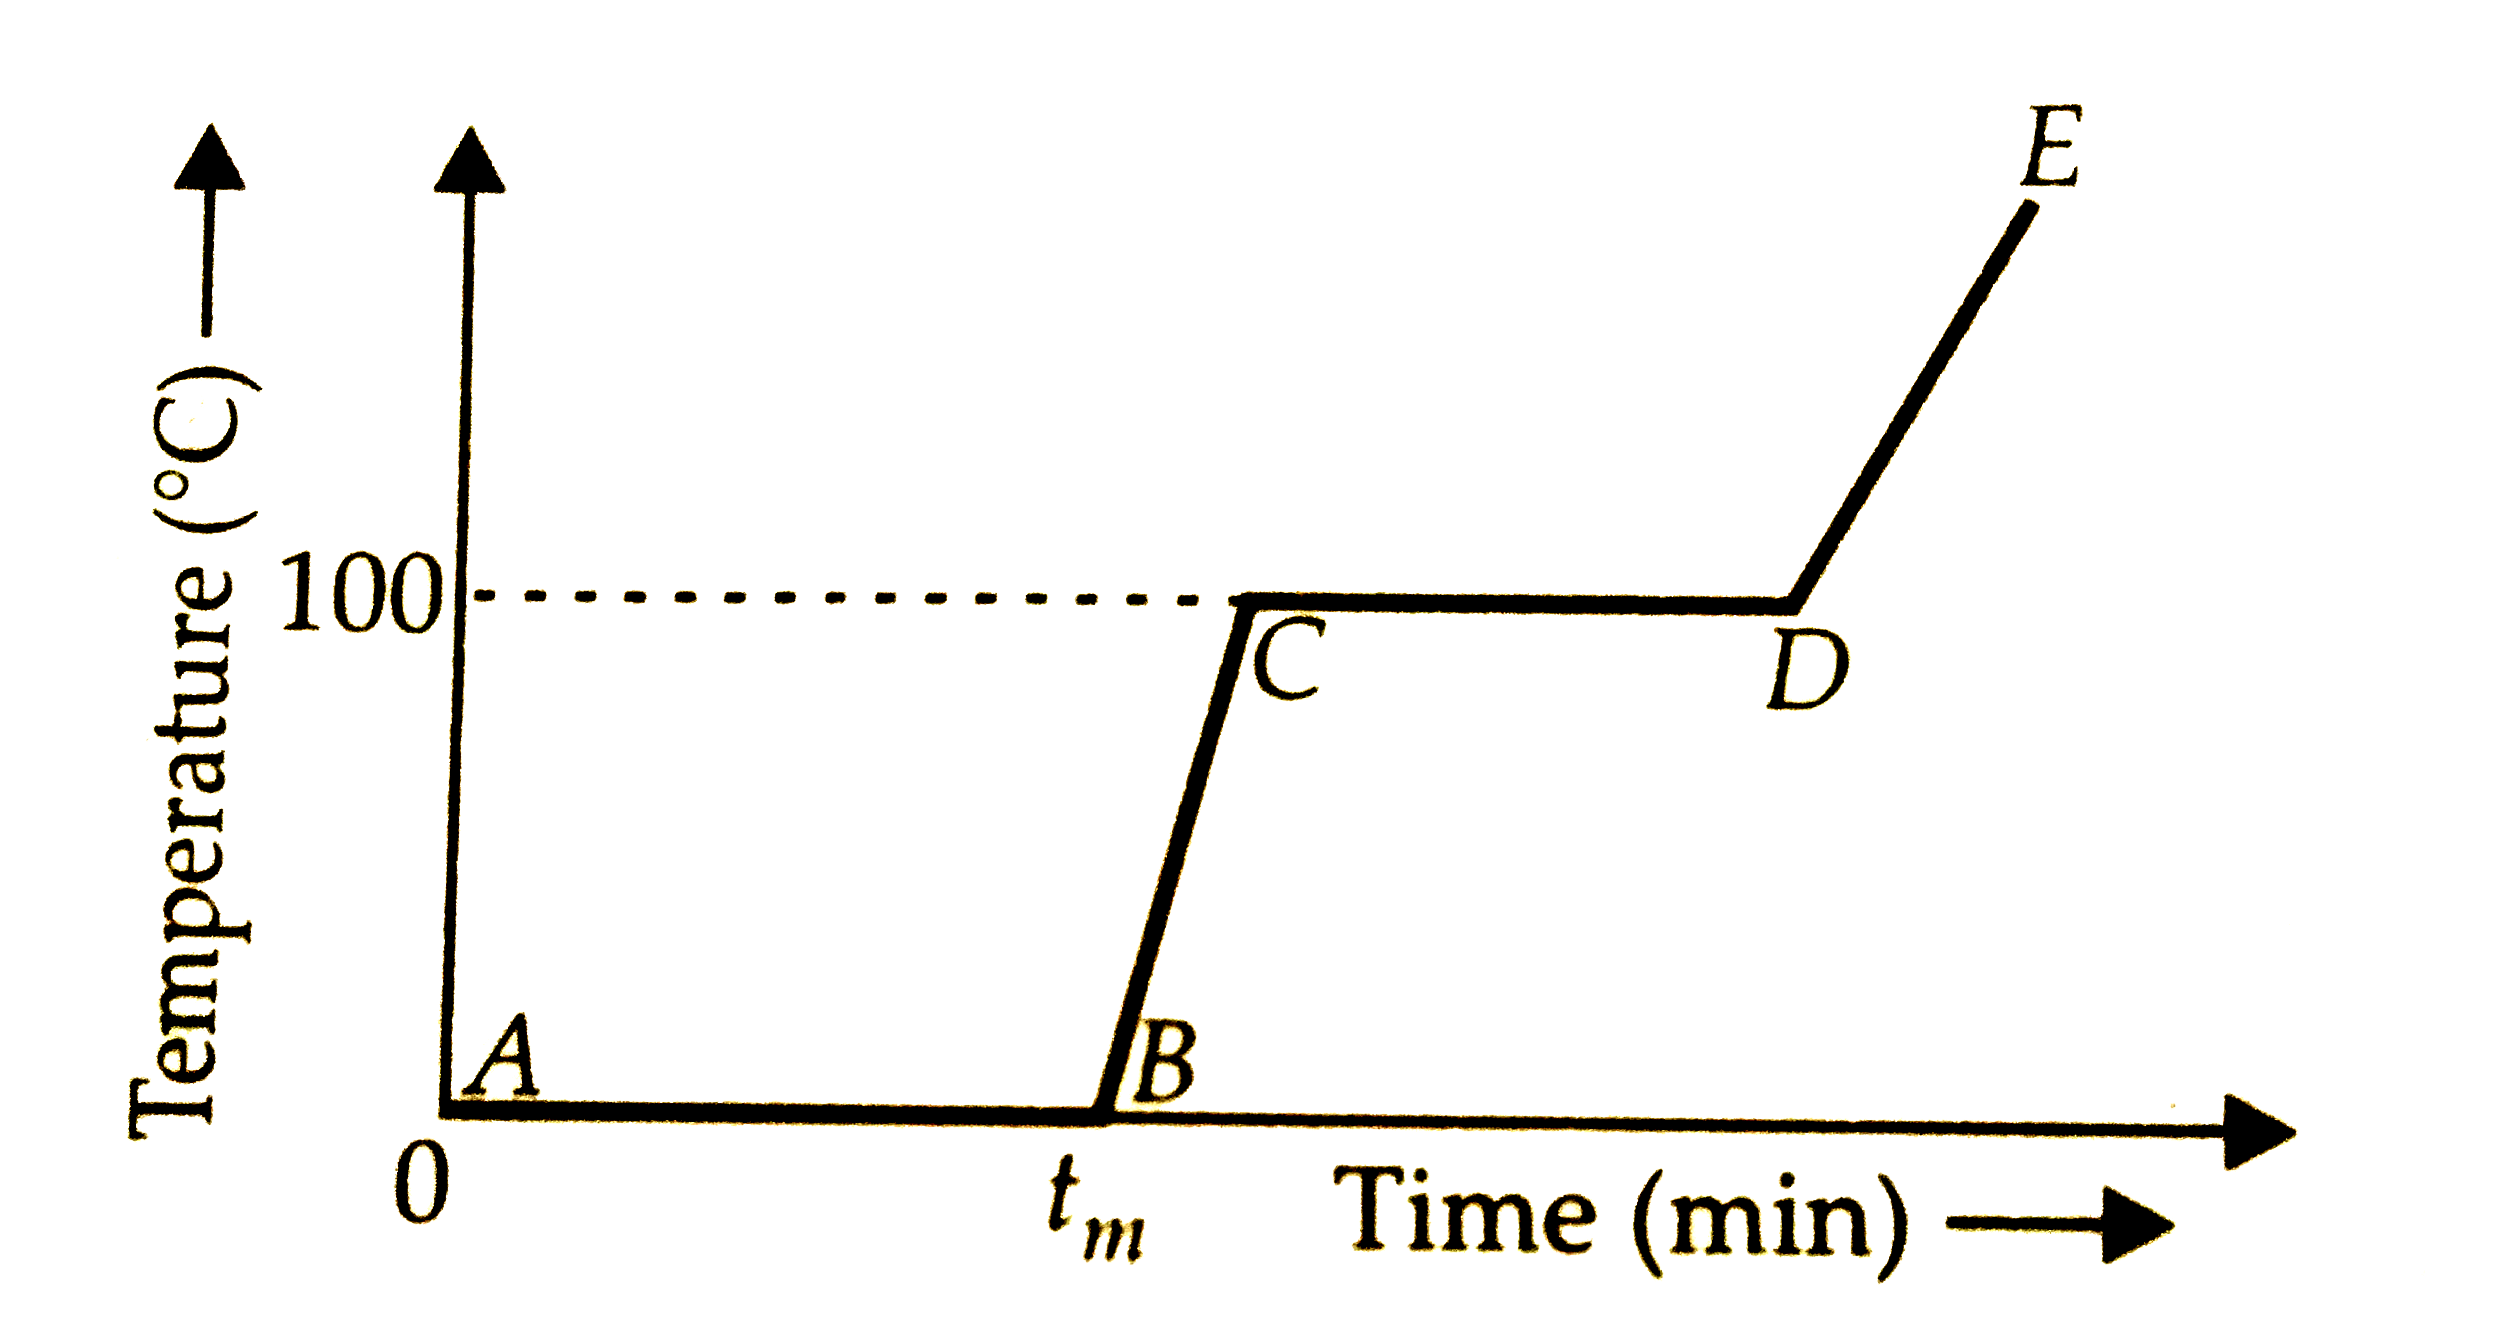
Which of the following is correct ?AAB represents ice and water are not in the thermal equilibriumBAt B water starts boiling.CAt C all the water gets converted into steam.DCD represents water and steam in equilibrium at boiling point.In which of the following region of nephron, does maximum reabsorption of useful materials occurs?
Aloop of HenleBglomerulusCDCTDPCT
The diagram below shows the change of phases of a substance on a temperature vs time graph on heating the substance at a constant rate.
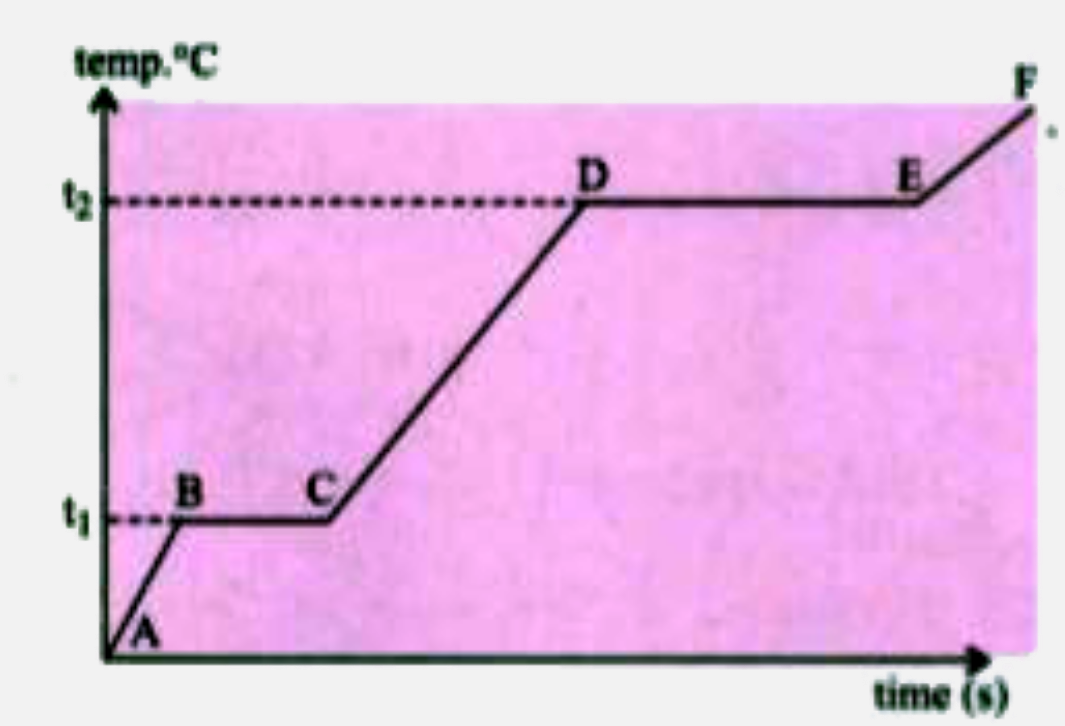
What is the boiling and melting point of the substance ?
View SolutionState which of the following statements are true and which are false :
A diameter of a circle divides the circular region into two parts, each part is called a semicircular region.
View SolutionThe motion of a body is represented by the following displacement-time graph.
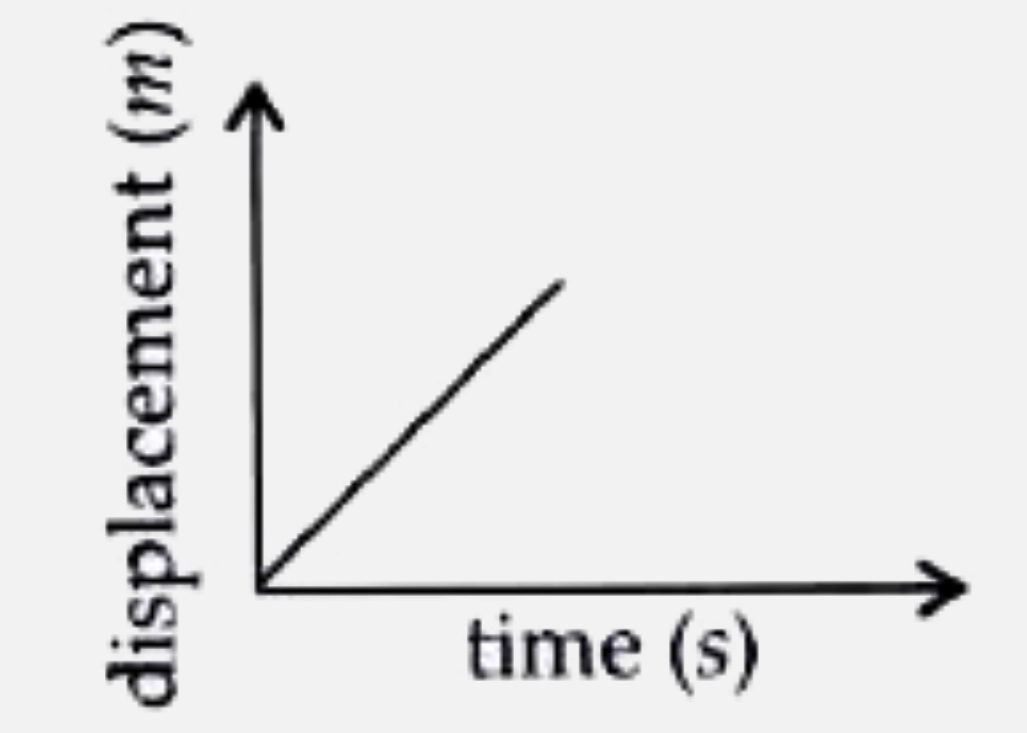
State the type of motion represented in the graph.
View SolutionName the following
The fixed temperature at which a liquid changes into vapour state .
View SolutionWrite true or false for the following statements:
The temperature at which a liquid changes into gaseous state without any rise in temperature is called liqudfaction point. _________
View SolutionWhich of the following displacement (X) time graphs is not possible?
View Solution

 .
.