T wave in electrocardiogram represent
The return of ventricles from excited to normal state
Depolarisation of ventrivles from normal to excited state
Onset of atrial systole
Onset of atrial diastole
Step by step video & image solution for T wave in electrocardiogram represent by Biology experts to help you in doubts & scoring excellent marks in Class 12 exams.
Updated on:21/07/2023Topper's Solved these Questions
Similar Questions
Knowledge Check
Refer to the given electrocardiogram and select the correct statement
 AIt shows electrocardiogram of a healthy personBIt shows partial blockage due to damaged AV nodesCIt shows complete blockage and three is no synchrony between atrial and ventricular activitesDIt shows that muscles of the heart are weak
Which of the following is the diagrammatic representation of standard electrocardiogram (ECG) ?
A B
B C
C D
D
Which of the following wave functions does not represent a travelling wave ?
Ay=tan(x−vt)2By=log(x+vt)Cy=1x+vtDAll of these
T wave in a standard ECG represents
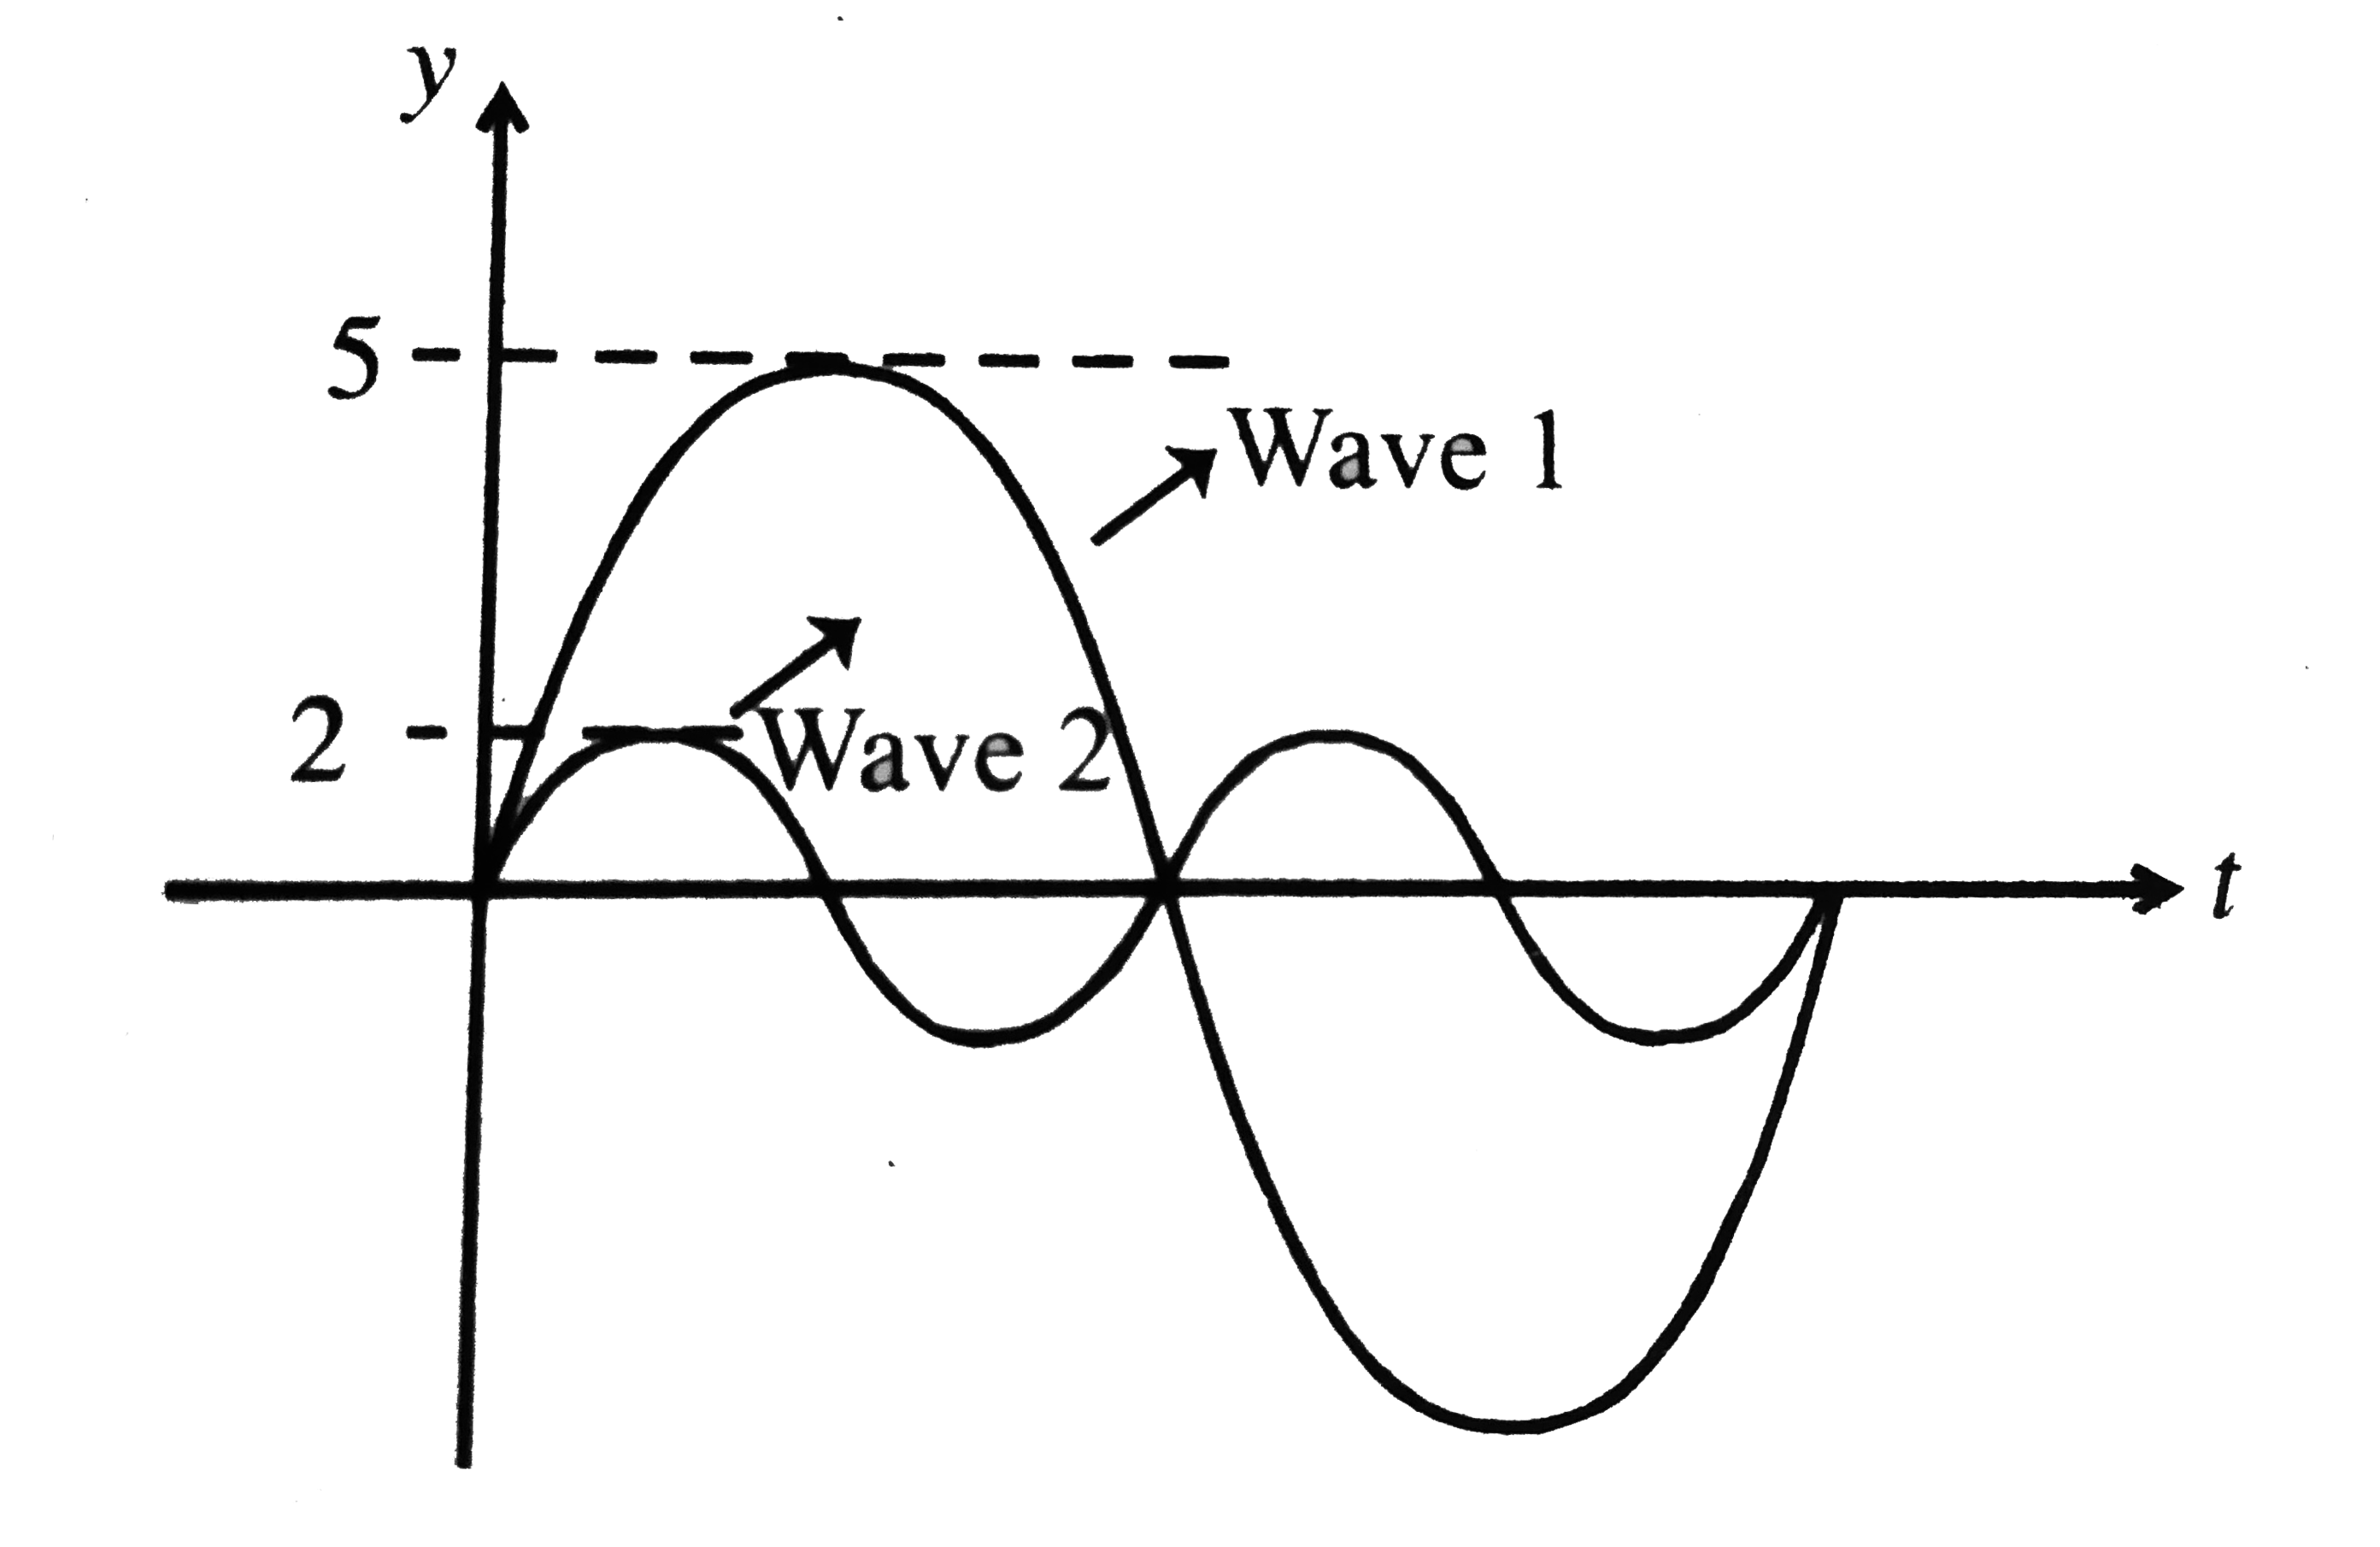
View SolutionTwo waves in the same medium are represented by y-t curves in the
 . Find the ratio of their average intensities?
View SolutionTwo waves in the same medium are represented by y-t curves in the
 . Find the ratio of their average intensities?
View SolutionTwo waves in the same medium are represented by y-t curves in the
 . Find the ratio of their average intensities?
View SolutionA wave equation which gives the displacement along the y-direction is given by y=10−4sin(60t+2x) where xandy are in meters and t is time in seconds. This represents a wave
View Solution
