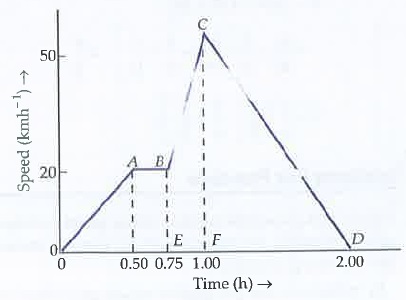
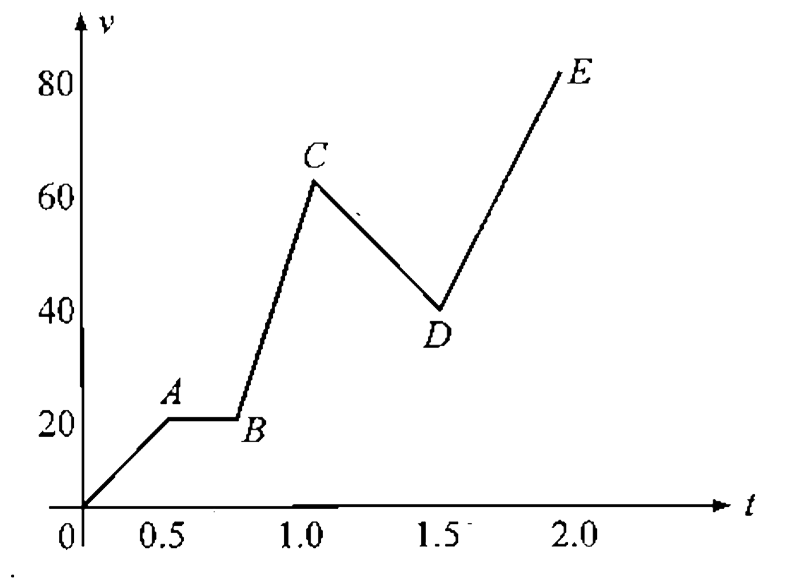
A train moves from one station to another in 2 hours time. Its speed-time graph during this motion is shown in the figure. The maximum acceleration during the journey is
Step by step video & image solution for A train moves from one station to another in 2 hours time. Its speed-time graph during this motion is shown in the figure. The maximum acceleration during the journey is by Physics experts to help you in doubts & scoring excellent marks in Class 12 exams.
Similar Questions
A train moves from one station to another in two hours time. Its speed during the motion is shown in the graph Calculate
(i) Maximum acceleration during the journey.
(ii) Distance covered during the time interval from 0.75 hour to 1 hourView SolutionA train moves from one station to another in two hours' time. Its speed-time graph during the motionis shown in Fig. 3.59 : calculate the distance covered during the time interval from 0.75 hour to 1 hour.
 View Solution
Knowledge Check
- Question 1 - Select One
The distance-time graph of a moving vehicle is as shown in the figure.
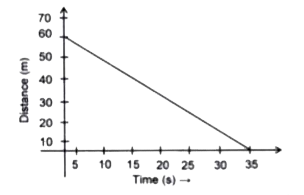 AThe speed of the vehicle is increasing with time.BThe speed of the vehicle is decreasing with time.CThe final speed of the vehicle is zero.DGraph is not possible.
 - Question 2 - Select One
The speed - time graph for a body moving along a straight line is shown in figure. The average acceleration of body may be
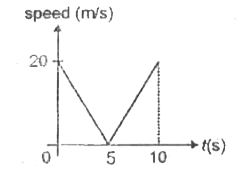 A0B4m/s2C−4m/s2DAll of these
 - Question 3 - Select One
The velocity-time graph of a body is shown in figure. The ratio of magnitude of average acceleration during the intervals OA and AB is
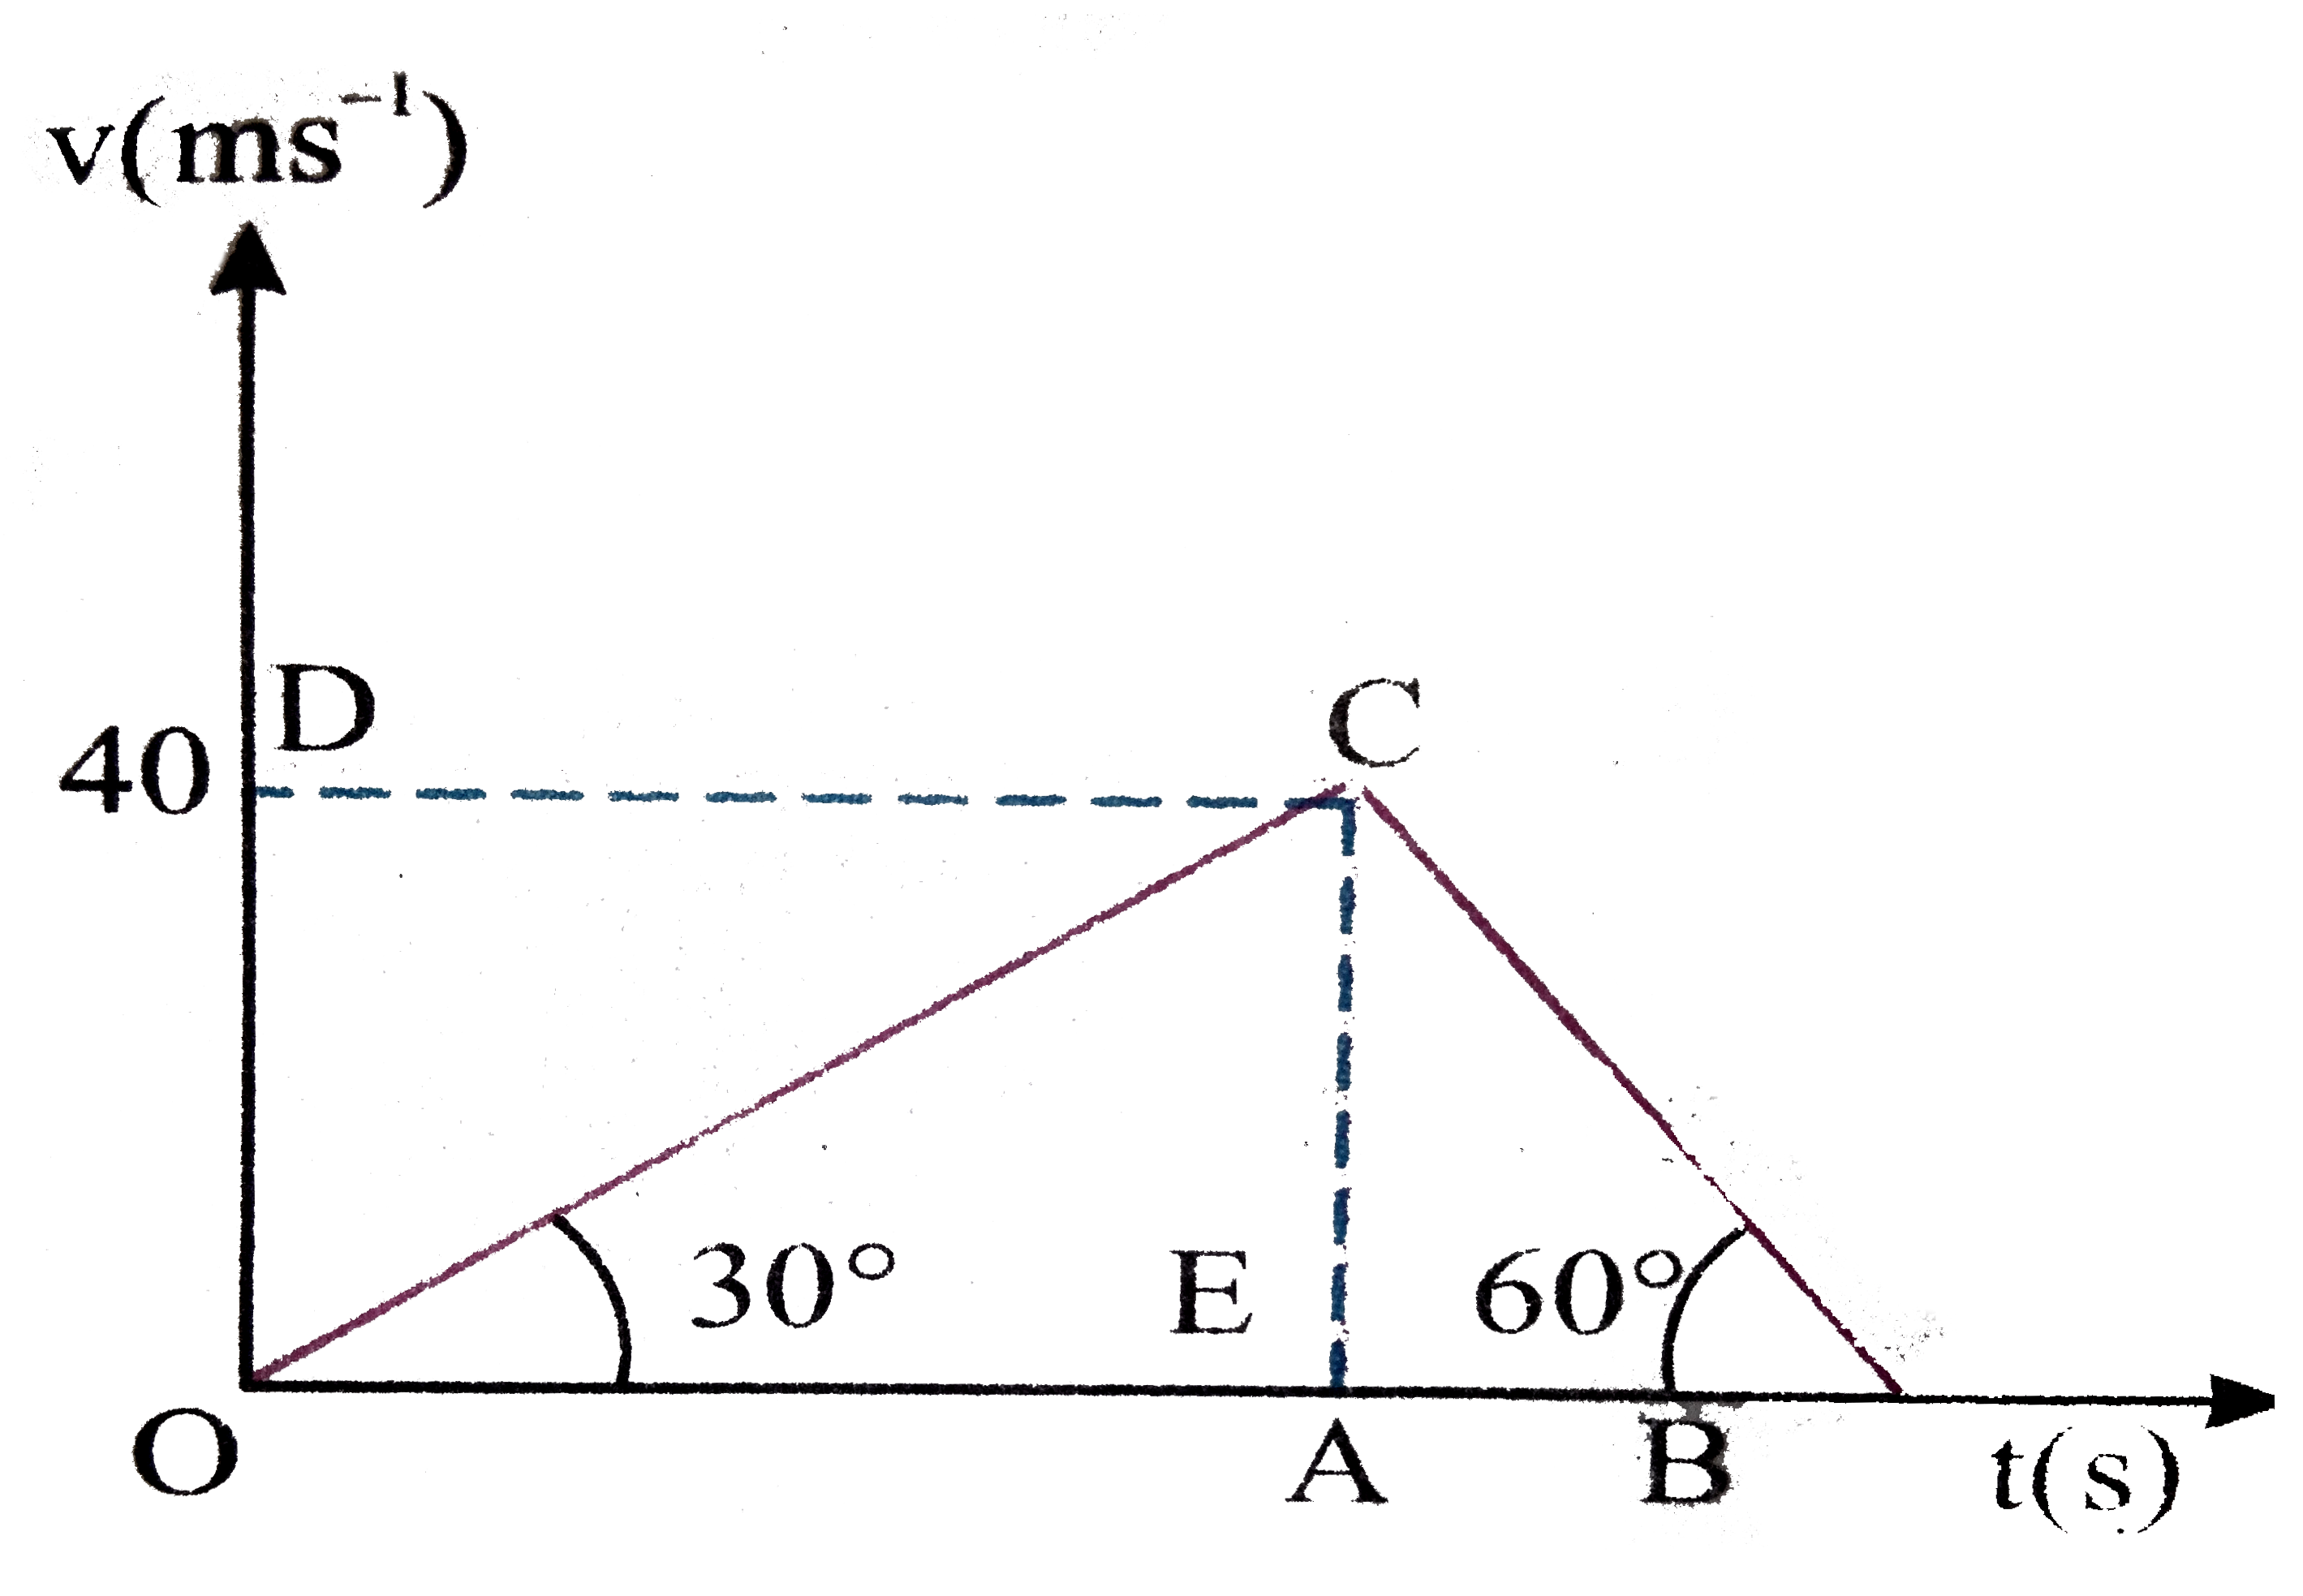 A1B12C13D3
The velocity time graph for a particle is shown in figure. Draw acceleration time graph from it.
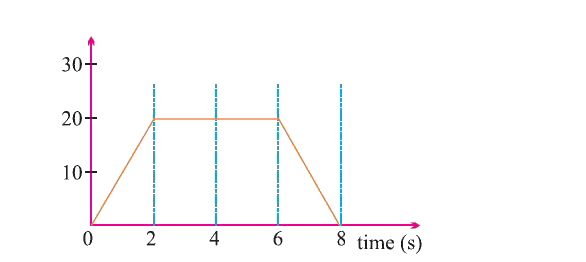 View Solution
The travel from a train from one station to another is and example of translatory motion
View SolutionA body starts from rest at time t=0 , the acceleration time graph is shown in the figure . The maximum velocity attained by the body will be
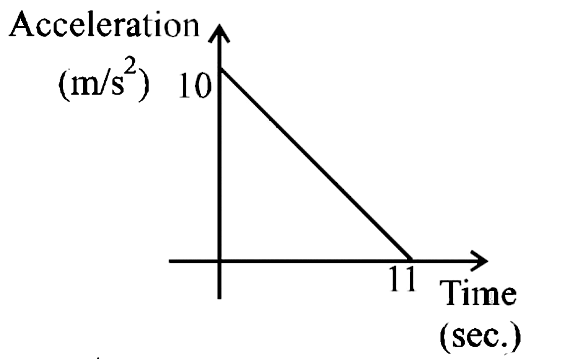 View Solution
A particle starting from rest. Its acceleration (a) versus time (t) is as shown in the figure.
The maximum speed of the particle will be.
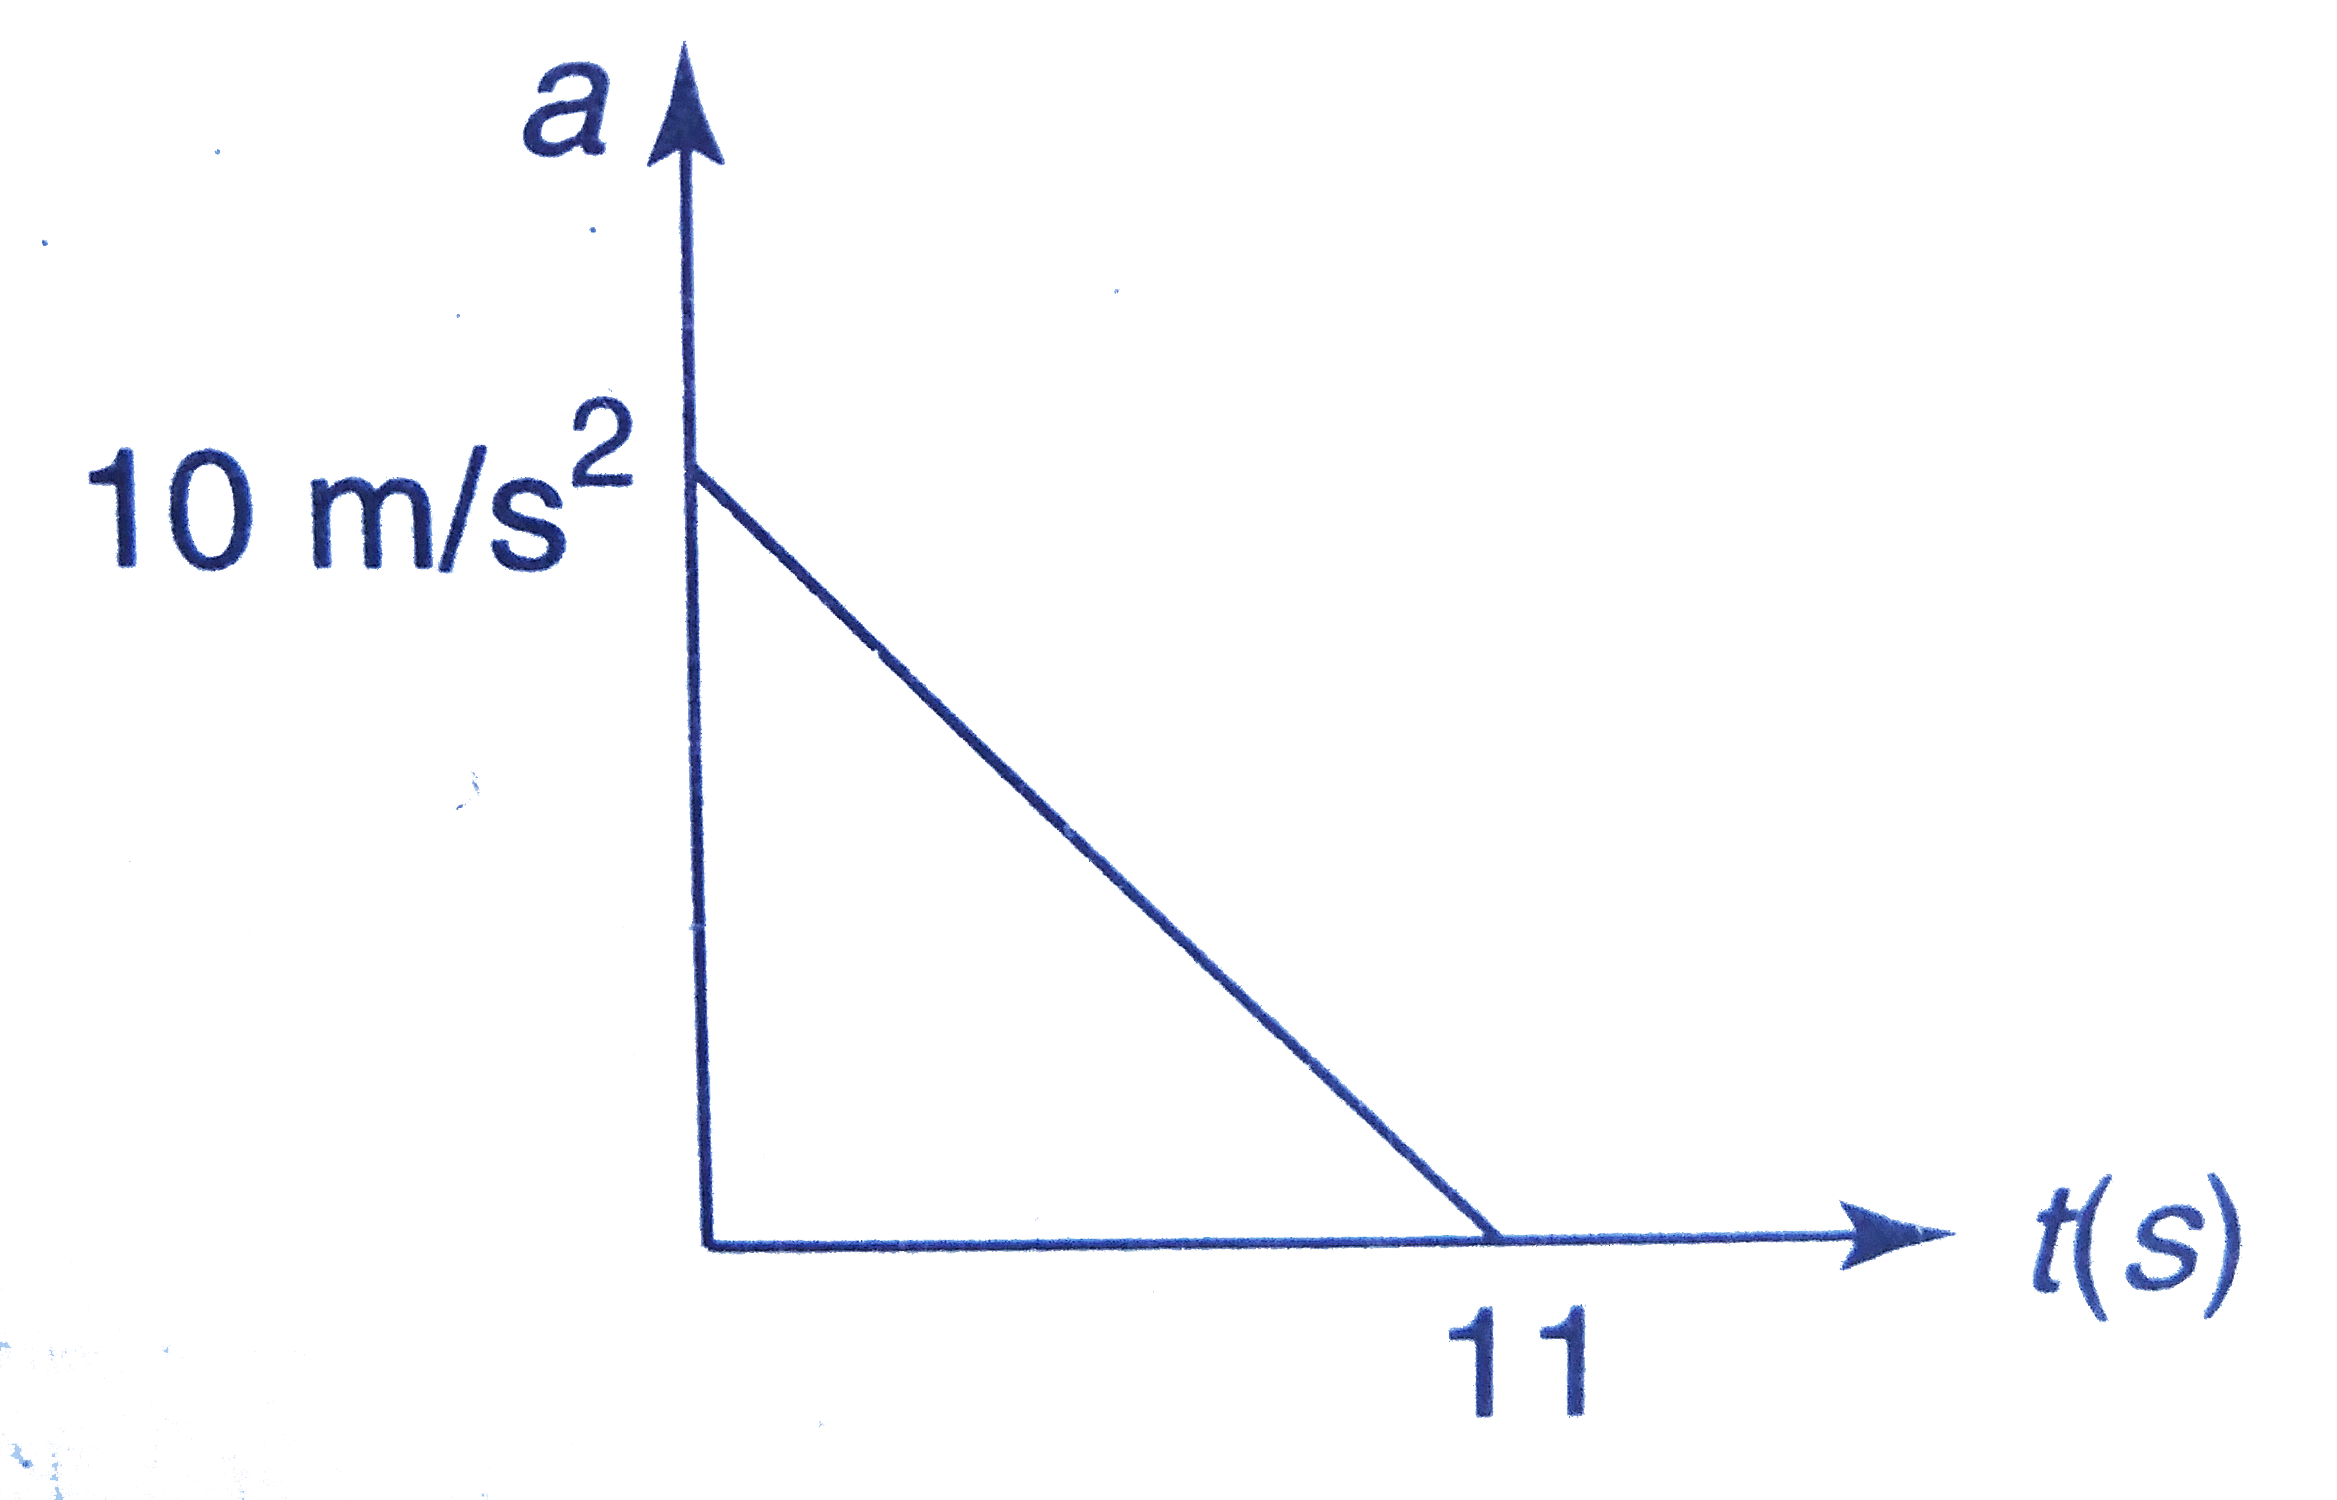 View Solution
The variation in the speed of a car during its two hour journey is shown in the graph of the figure-1.106. The magnitude of the maximum acceleration of the car occupies an interval of:
 View Solution
