The speed-time graph of a particle moving along a fixed direction is shown in Fig. Obtain the distance traversed by the particle between (a) t = 0 s to 10 s, (b) t = 2s to 6s
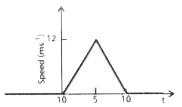
What is the average speed of the particle over the intervals in (a) and (b) ?
a) Distance travelled by the particle between 0 to 10s will be
= Area of ΔOAB, whose base is 10s and height is 12 m/s
=12×10×12=60m
Average speed =6010=6mS−1
b) Let s1ands2 be the distances covered by the particle in the time interval t1=2s to 5s and t2=5s to 6s, then total distance covered in time interval t = 2s to 6s will be s=s1+s2 ..... (i)
To find s1: let us consider u1 is the velocity of particle after 2 seconds and a1 is the acceleration of the particle during the time interval zero to 5 seconds.
Then u1=0,v=12m/s,a=a1andt=5s
We have a1=v−ut=12−05=125
=2.4m/s2
∴u1=υ+a1t=0+2.4×2=4.8m/s−1
Thus for the distance travelled by particle in 3 seconds (i.e, time interval 2s to 5s), we have
u1=4.8m/s,t1=3s,a1=2.4m/s2,s1=?
As s1=u1t1+12a1t12
S1=4.8+3×12×2.4×32=25.2m
To find s2: let a2 be the acceleration of the particle during the motion
t=5s to t=10s
We have a2=0−1210−5=−2.4m/s2
Taking motion of the partice in time interval
t=5s to t=6s
We have
u1=12m/s−1,a2=−2.4m/s2,t2=1s,s2=?
As s2=u2t+12a2t22
s2=12×1+12(−2.4)12=10.8m
∴ Total distance travelled s = 25.2 + 10.8 = 36 m
Average velocity =366−2=364=9m/s
Similar Questions
The speed-time graph of a particle moving along a fixed direction is shown in figure. Obtain the distance traversed by the particle between (a)t=0s to 10s(b)t=2s to 6s
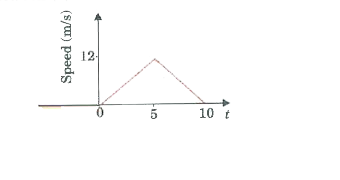
What is the average speed of the particle over the intervals in a and b?
View SolutionThe speed-time graph of a particle moving along a fixed direction is shown in the Fig. The distance traversed by the particle between (a) t=0s→10s .
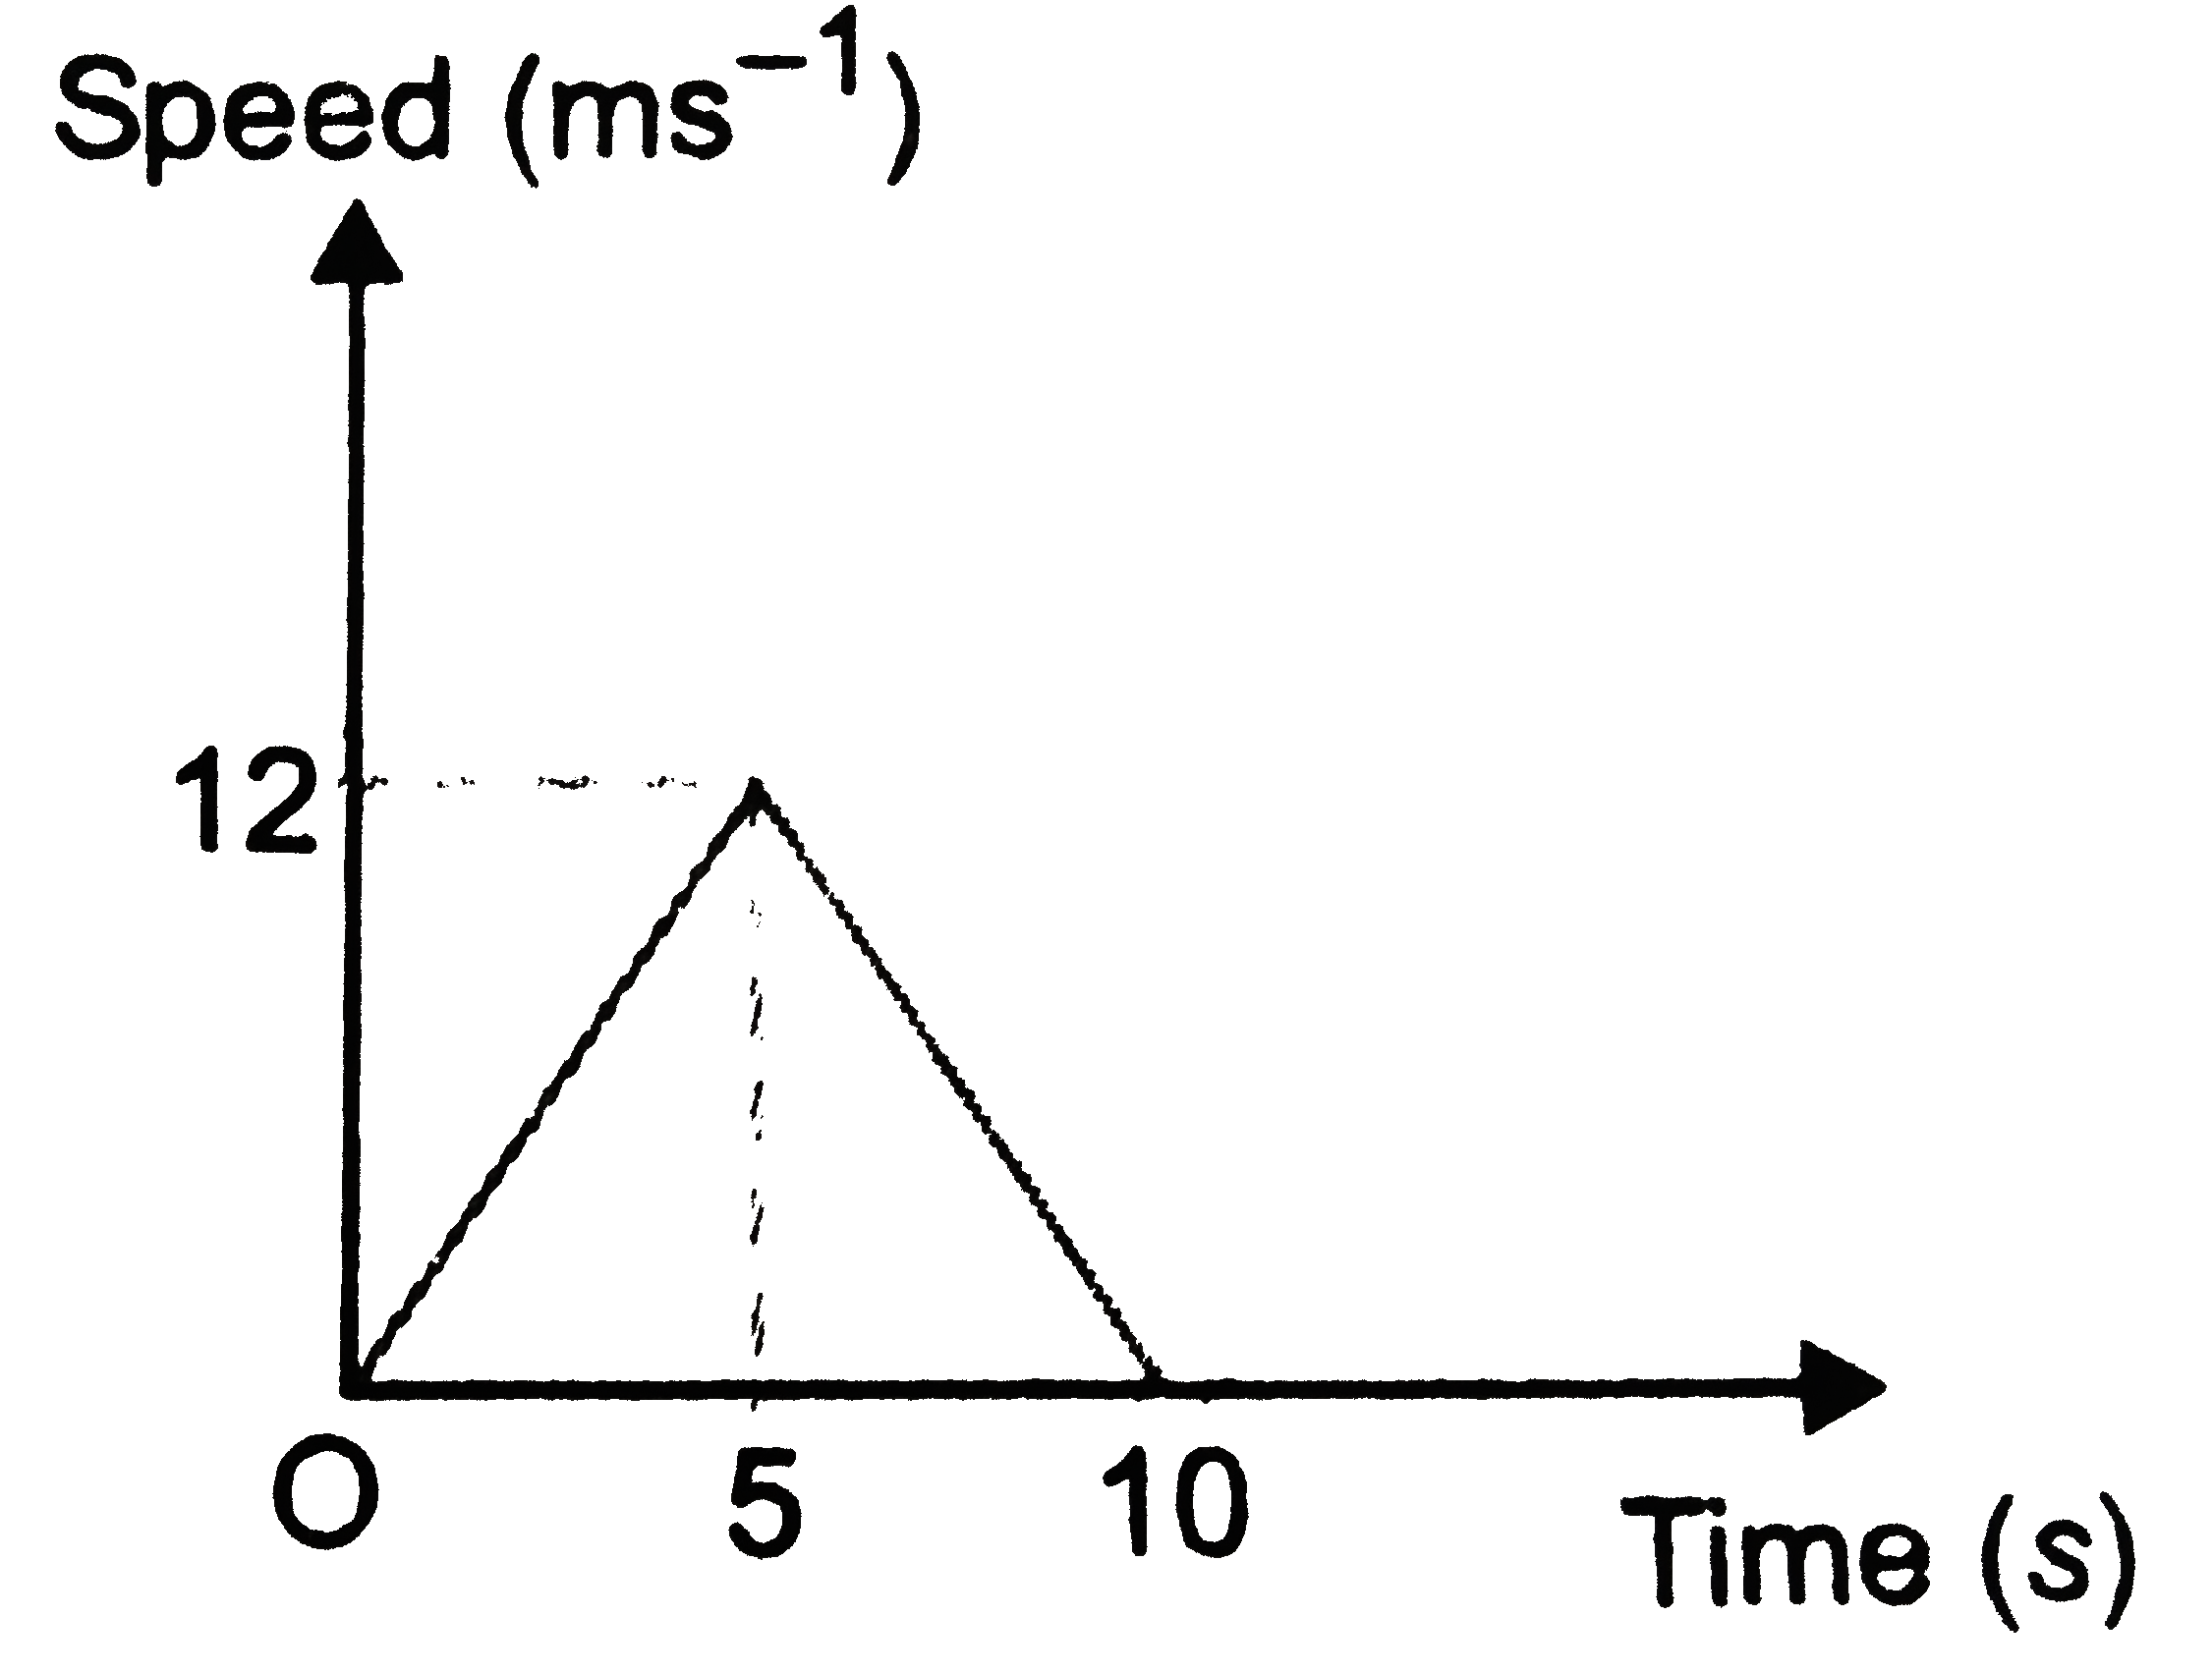 .
what is the average speed of the particle over the intervals?
View Solution
Knowledge Check
The speed-time graph of a particle moving along a fixed direction as shown in the figure. The distance traversed by the particle between t = 0 s to t = 10 s is
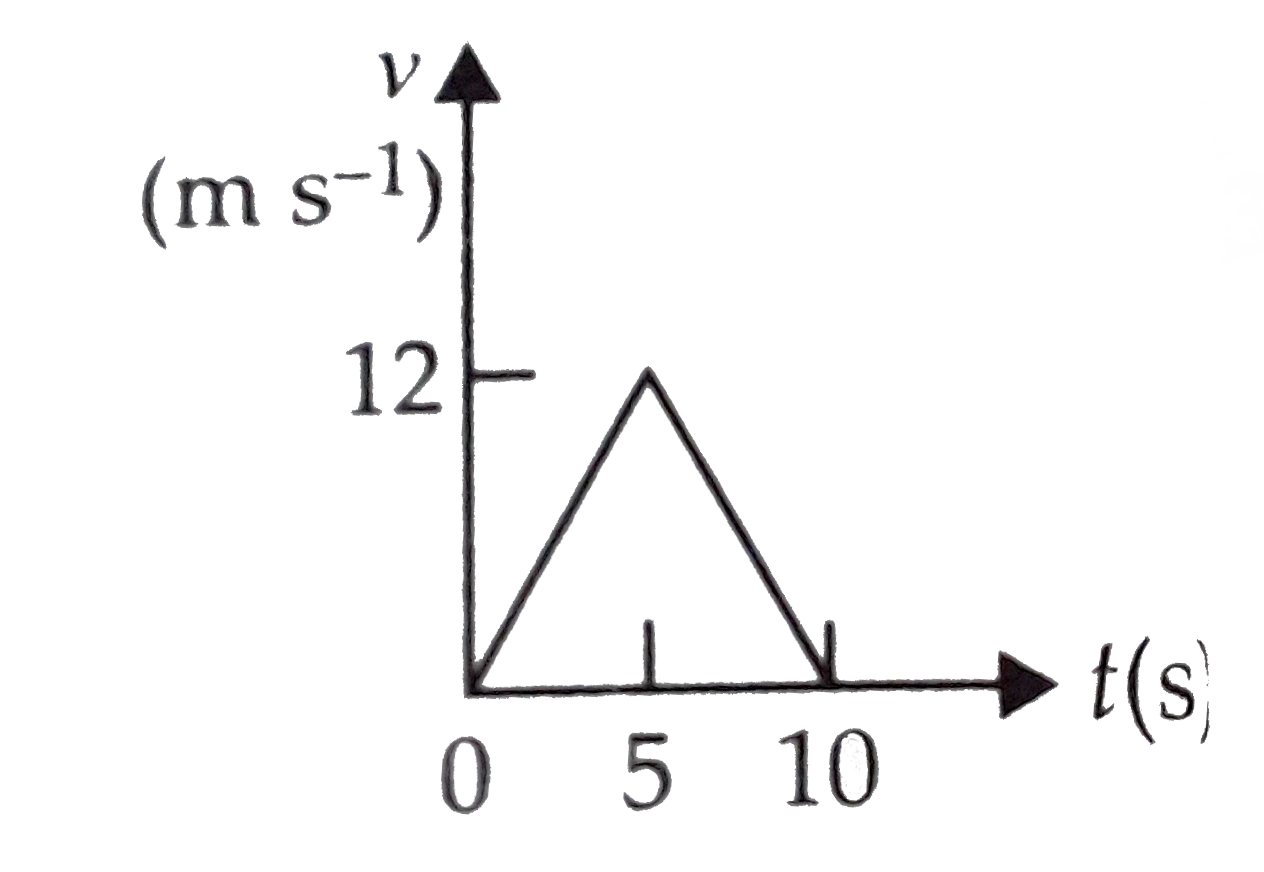 A20 mB40 mC60 mD80 m
The speed-time graph of a particle moving along a fixed direction as shown in the figure. The distance travelled by the particle between t = 0 s to t = 10 s is
 A20 mB40 mC60 mD80 m
The speed-time graph of a particle moving along a fixed direction is shown in the Fig. 2 (CF) . 15. The distance traversed by the particle between t=2s 6s is .
 .A26mB36mC46mD56m
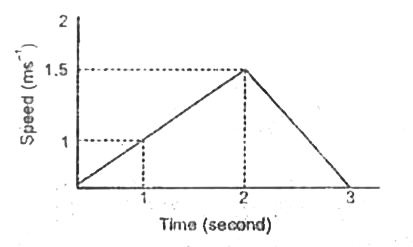
The speed - time graph of a particle moving along a solid curve is shown below. The distance traversed by the particle from t = 0 to t = 3 is
View Solution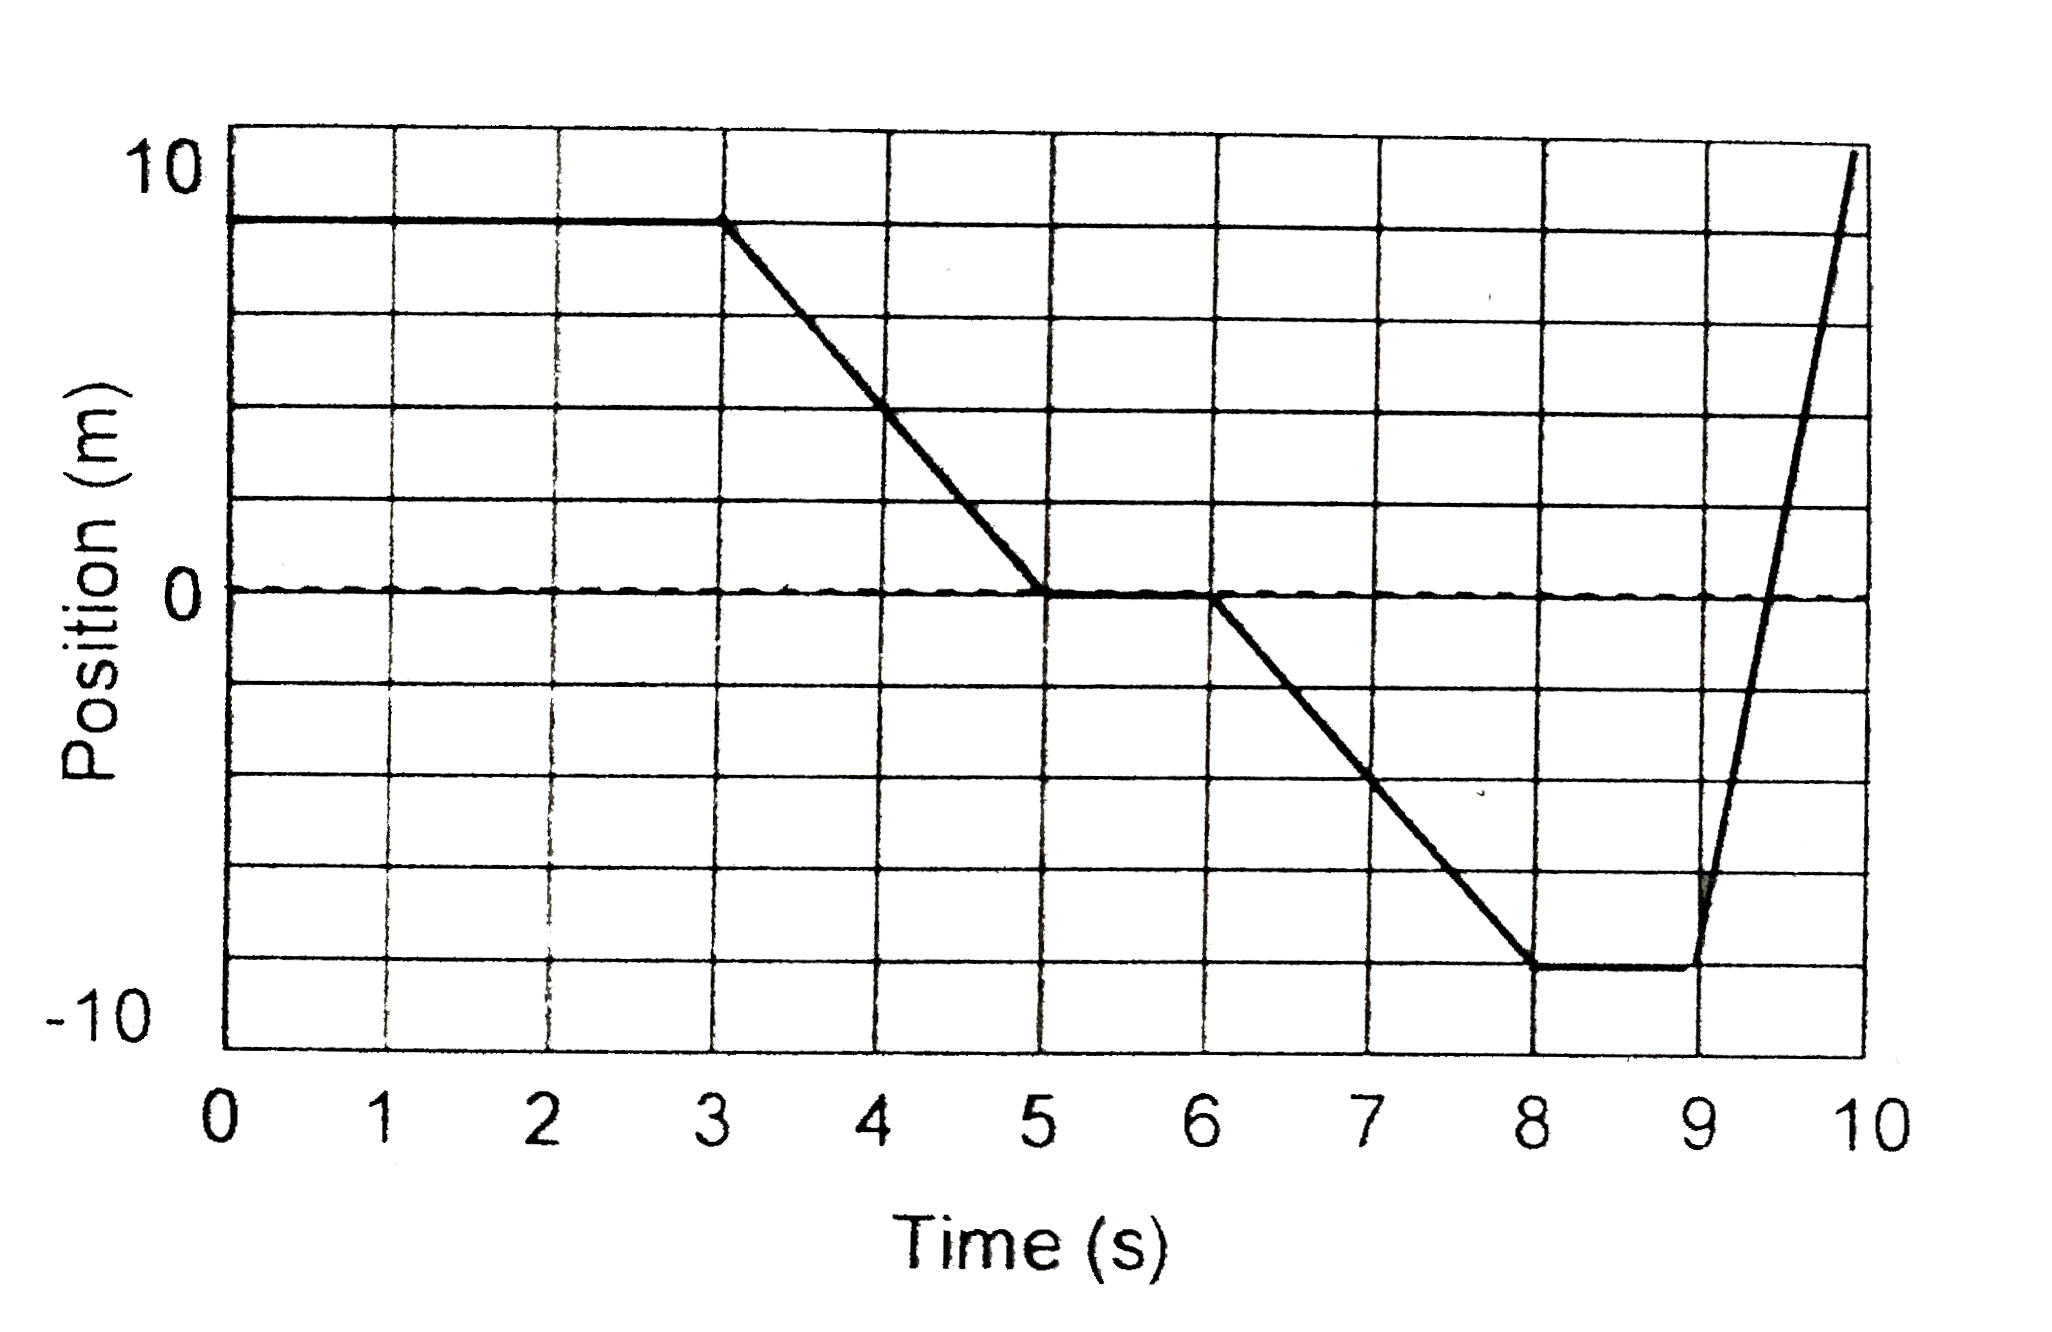
The position versus time graph of a particle moving along a straight line is shown. What is the total distance travelled by the particle from t=0s to t=10s?
View SolutionThe speed-time graph of a particle moving along a fixed direction is shown in the Fig. 2 (CF) . 15. The distance traversed by the particle between t=2s and 6s is .
 .
.
View SolutionThe speed - time graph of a particle moving along a solid curve is shown below. The distance traversed by the particle from t = 0 to t = 3 is

View Solution
The position versus time graph of a particle moving along a straight line is shown. What is the total distance travelled by the particle from t=0s to t=10s?
View Solution
