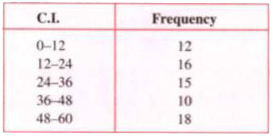
Contruct a cumulative frequency distributions table from the following frequency table:

Step by step video & image solution for Contruct a cumulative frequency distributions table from the following frequency table: by Maths experts to help you in doubts & scoring excellent marks in Class 9 exams.
Updated on:21/07/2023Topper's Solved these Questions
- CHAPTER REVISION (STAGE 2) BOOK - ICSECHAPTER - CHAPTER REVISION (STAGE 2) EXERCISE - MEAN AND MEDIAN
4 Videos
- CHAPTER REVISION (STAGE 2) BOOK - ICSECHAPTER - CHAPTER REVISION (STAGE 2) EXERCISE - AREA AND PERIMETER OF PLANE FIGURES
8 Videos
- CHAPTER REVISION (STAGE 2) BOOK - ICSECHAPTER - CHAPTER REVISION (STAGE 2) EXERCISE - CONSTRUCTIONS OF POLYGONS
19 Videos
- AREA THEOREMSBOOK - ICSECHAPTER - AREA THEOREMSEXERCISE - Exercies 16(C )
22 Videos
- CHAPTERWISE REVISION (STAGE 1) BOOK - ICSECHAPTER - CHAPTERWISE REVISION (STAGE 1) EXERCISE - Graphical solution
10 Videos
Similar Questions
Construct a cumulative frequency distribution table from the following frequency table :
C.IFrequency 11−201521−302131−402641−501851−601361−7015
View SolutionFrom the frequency distribution table from the following data

View SolutionConstruct a cumulative, frequency distribution table from the frequency table given below :
Calss IntervalFrequency0−898−161316−241224−32732−4015
View SolutionConstruct a cumulative frequency distribution table from the frequency table given below :
Calss IntervalFrequency1−101211−201821−302331−401541−5010
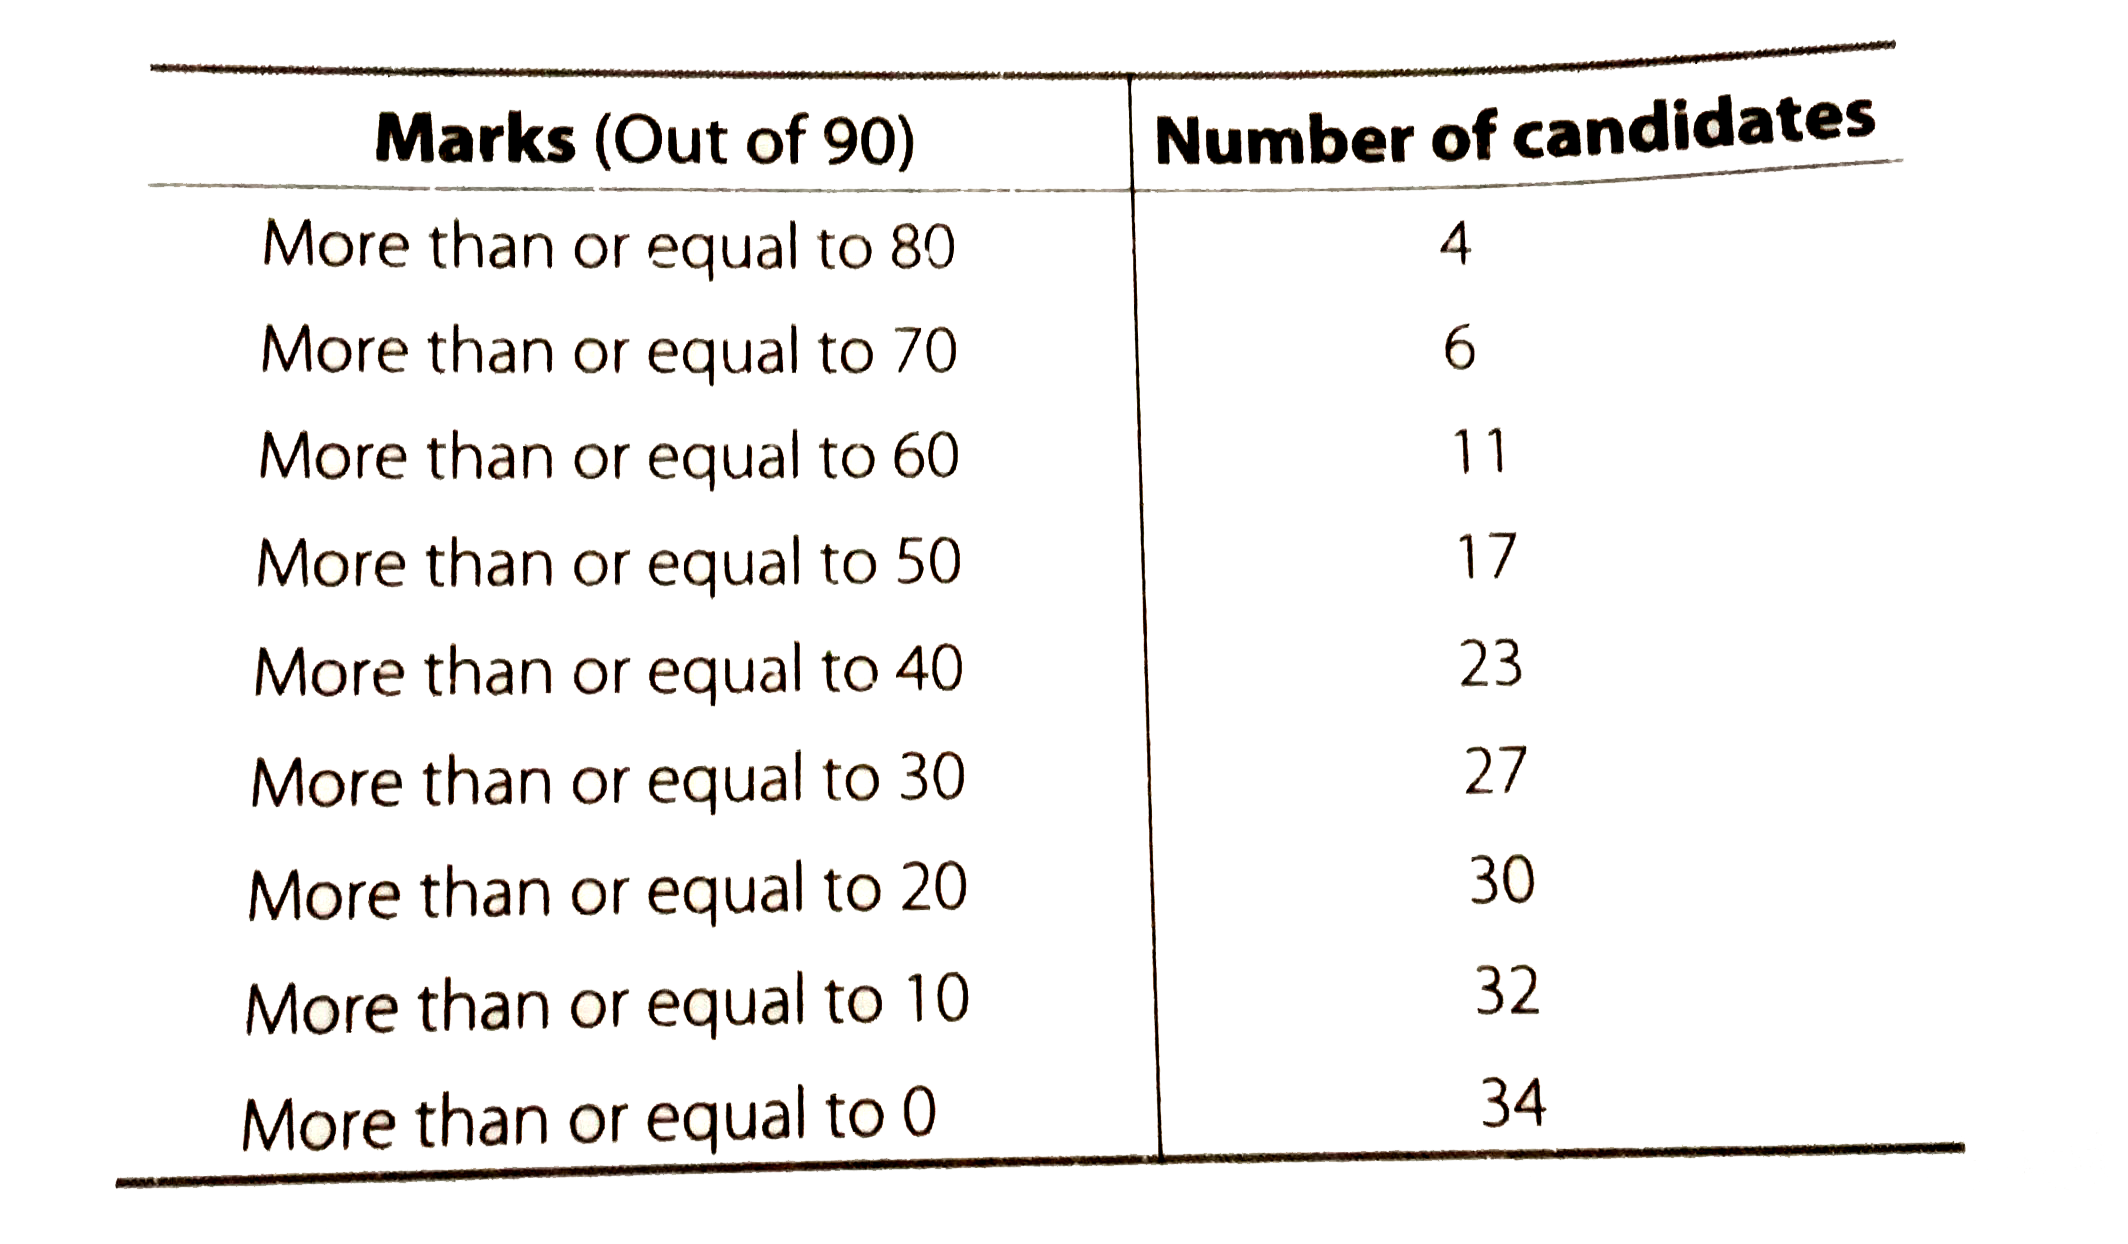
View SolutionConstruct the frequency distribution table from the following cumulative frequency table :

State the number of students in the age group 10 - 13.
View SolutionConstruct the frequency distribution table from the following cumulative frequency table :

State the age - group which has the least number of students .
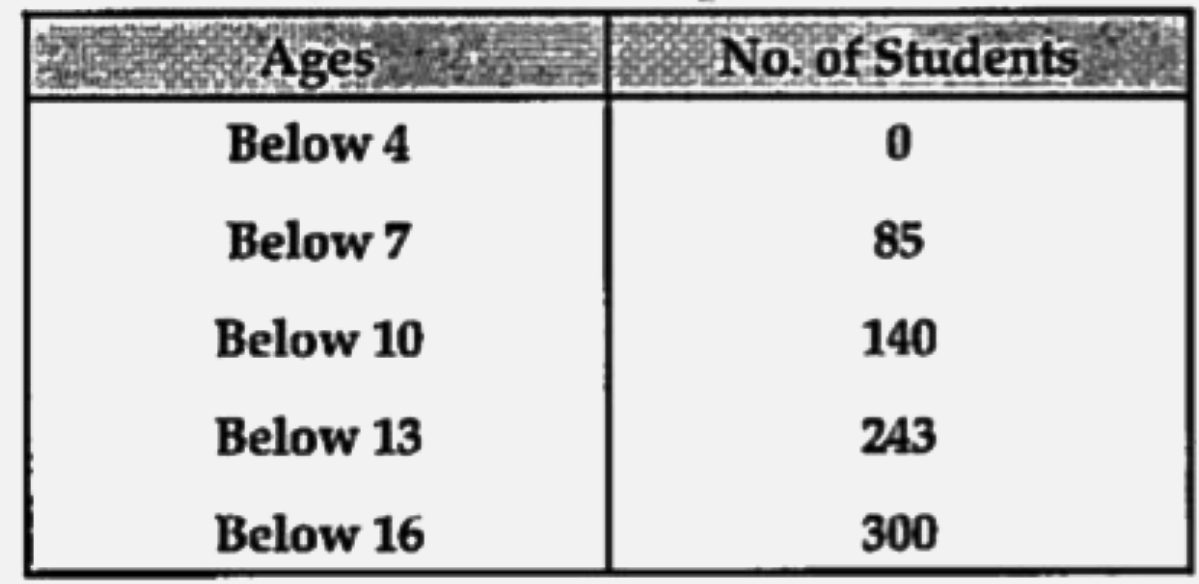
View SolutionConstruct the frequency distribution table from the following cumulative frequency table:
AgesNo of StudentsBelow40Below785Below10140Below13243Below16300
State the number of students in the age group 10-13
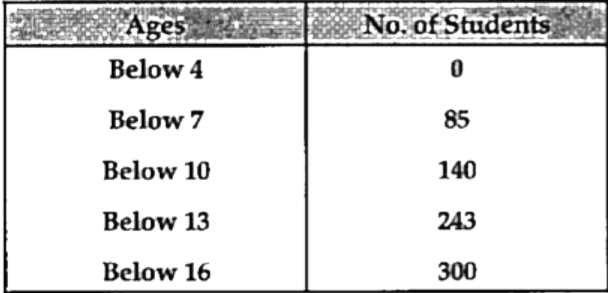
View SolutionConstruct the frequency distribution table from the following cumulative frequency table:
AgesNo of studentsBelow40Below785Below10140Below13243Below16300
State the age group which has the least number of students
View SolutionConstruct a frequency distributions table from the following cumulatvive frequency table.
Class interval Cumulative Frequency 0−91510−192320−293830−395640−496850−5990
View SolutionConstruct a frequency distribution table from the following cumulative frequency distribution :
Calss IntervalCumulative Frequency10−19820−291930−392340−4930
View Solution
