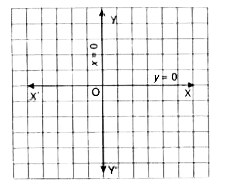
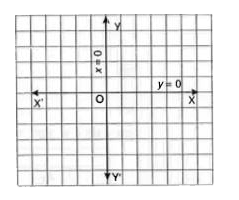
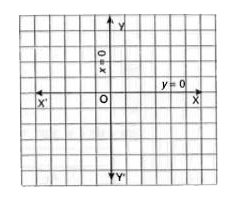
Draw the graph of following equations : x = -2.Solution in Telugu
Step by step video & image solution for Draw the graph of following equations : x = -2. by Maths experts to help you in doubts & scoring excellent marks in Class 9 exams.
Updated on:21/07/2023Topper's Solved these Questions
Similar Questions
Construct ΔABC in which BC=7 cm, ∠B=75∘ and AB+AC= 12 cm .
View SolutionGive the graphical representation of the following equation.
(a) On the number line and (b)On the Cartesian plane
(i) x = 3 (ii) y + 3 = 0 (iii) y = 4 (iv) 2x – 9 = 0
(v) 3x + 5 = 0
View Solutionनिम्नलिखित समीकरण के लेखचित्र खींचे |
x=−4
View Solutionनिम्नलिखित समीकरण के लेखचित्र खींचे |
y−x=0
View Solutionनिम्नलिखित समीकरण के लेखचित्र खींचे |
x+y=7
View Solutionनिम्नलिखित समीकरण के लेखचित्र खींचे |
x+y=0
View Solutionनिम्नांकित समीकरण के लेखचित्र खीचें |
x+2y=6
View Solutionनिम्नांकित समीकरण के लेखचित्र खीचें |
x−2y=4
View SolutionDraw the graphs of the following equations : (i) x=5
View SolutionDraw the graphs of the following equations : (ii) x=−5
View SolutionDraw the graphs of the following equations : (iii) y=12x
View Solutionसमीकरण y−x=2 का आलेख खीचिए।
View SolutionDraw the graph of the equation y−x=2
View Solutionनिम्नलिखित समीकरणों के आलेख खींचिए |
x = 0

View Solutionनिम्नलिखित समीकरणों के आलेख खींचिए |
x = 1

View Solutionनिम्नलिखित समीकरणों के आलेख खींचिए |
x + 3 = 0

View Solution
