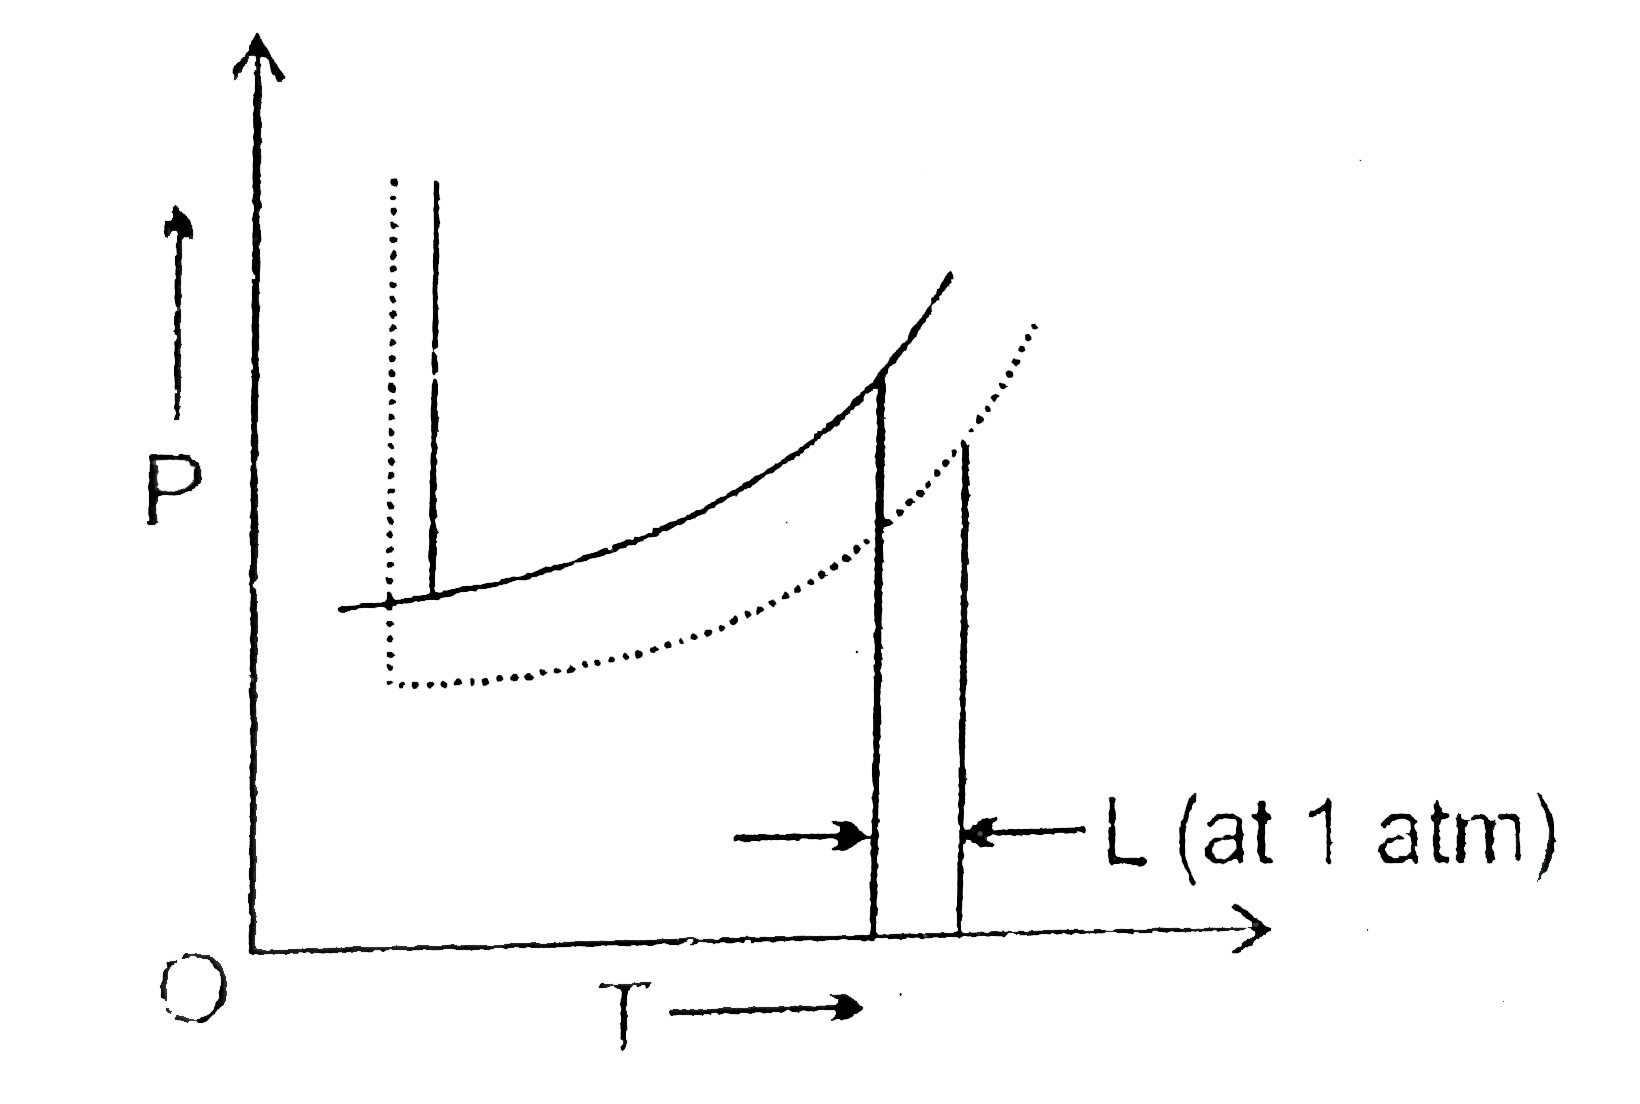
The phase diagrams for the pure solvent (solid lines) and the solution (non-volatile solute, dashed line) are recorded below:

The quantity indicated by L in the figue is :
ΔP
ΔTf
Kbm
Kfm
The correct Answer is:C
L indicates elevation in boiling pt.i.e.,Kbm.
Topper's Solved these Questions
- SOLUTIONSBOOK - RESONANCE ENGLISHCHAPTER - SOLUTIONSEXERCISE - Advabced Level Problems (PART-2)
35 Videos
- SOLUTIONSBOOK - RESONANCE ENGLISHCHAPTER - SOLUTIONSEXERCISE - EXERCISE-3(PART-3)
30 Videos
- SOLUTION AND COLLIGATIVE PROPERTIESBOOK - RESONANCE ENGLISHCHAPTER - SOLUTION AND COLLIGATIVE PROPERTIESEXERCISE - PHYSICAL CHEMITRY (SOLUTION & COLLIGATIVE PROPERTIES)
52 Videos
- STEREOISOMERISMBOOK - RESONANCE ENGLISHCHAPTER - STEREOISOMERISMEXERCISE - EXERCISE (PART III : PRACTICE TEST-2 (IIT-JEE (ADVANCED PATTERN))
23 Videos
Similar Questions
Knowledge Check
At equilibrium, the rate of dissolution of a solid solute in a volatile liquid solvent is
Aless than the rate of crystallizationBgreater than the rate of crystallizationCequal to the rate of crystallizationDzero
The mole fraction of the solvent in the solution of a non-volatile solute is 0.980. The relative lowering of vapour pressure is :
View SolutionHow is the vapour pressure of a solvent affected when a non volatile solute is dissolved in it?
View SolutionWhy is freezing point depressed when a non-volatile solute is added to a solvent ?
View SolutionThe vapour pressure (VP) of a dilute solution of non-volatile solute is P and the VP of a pure solvent is P∘. The lowering of the VP is
View SolutionThere are two beakers (I) having pure volatile solvent and (II) having volatile solvent and non-volatile solute. If both beakers are placed together in a closed container then:
View SolutionThere are two beakers (I) having pure volatile solvent and (II) having volatile solvent and non-volatile solute. If both beakers are placed together in a closed container then:
View SolutionShow graphically how the vapour pressures of a solvent and a solution in it of non-volatile solute change with temperature. Show on this graph the boiling points of the solvent and the solution. Which is higher and why?
View Solution
