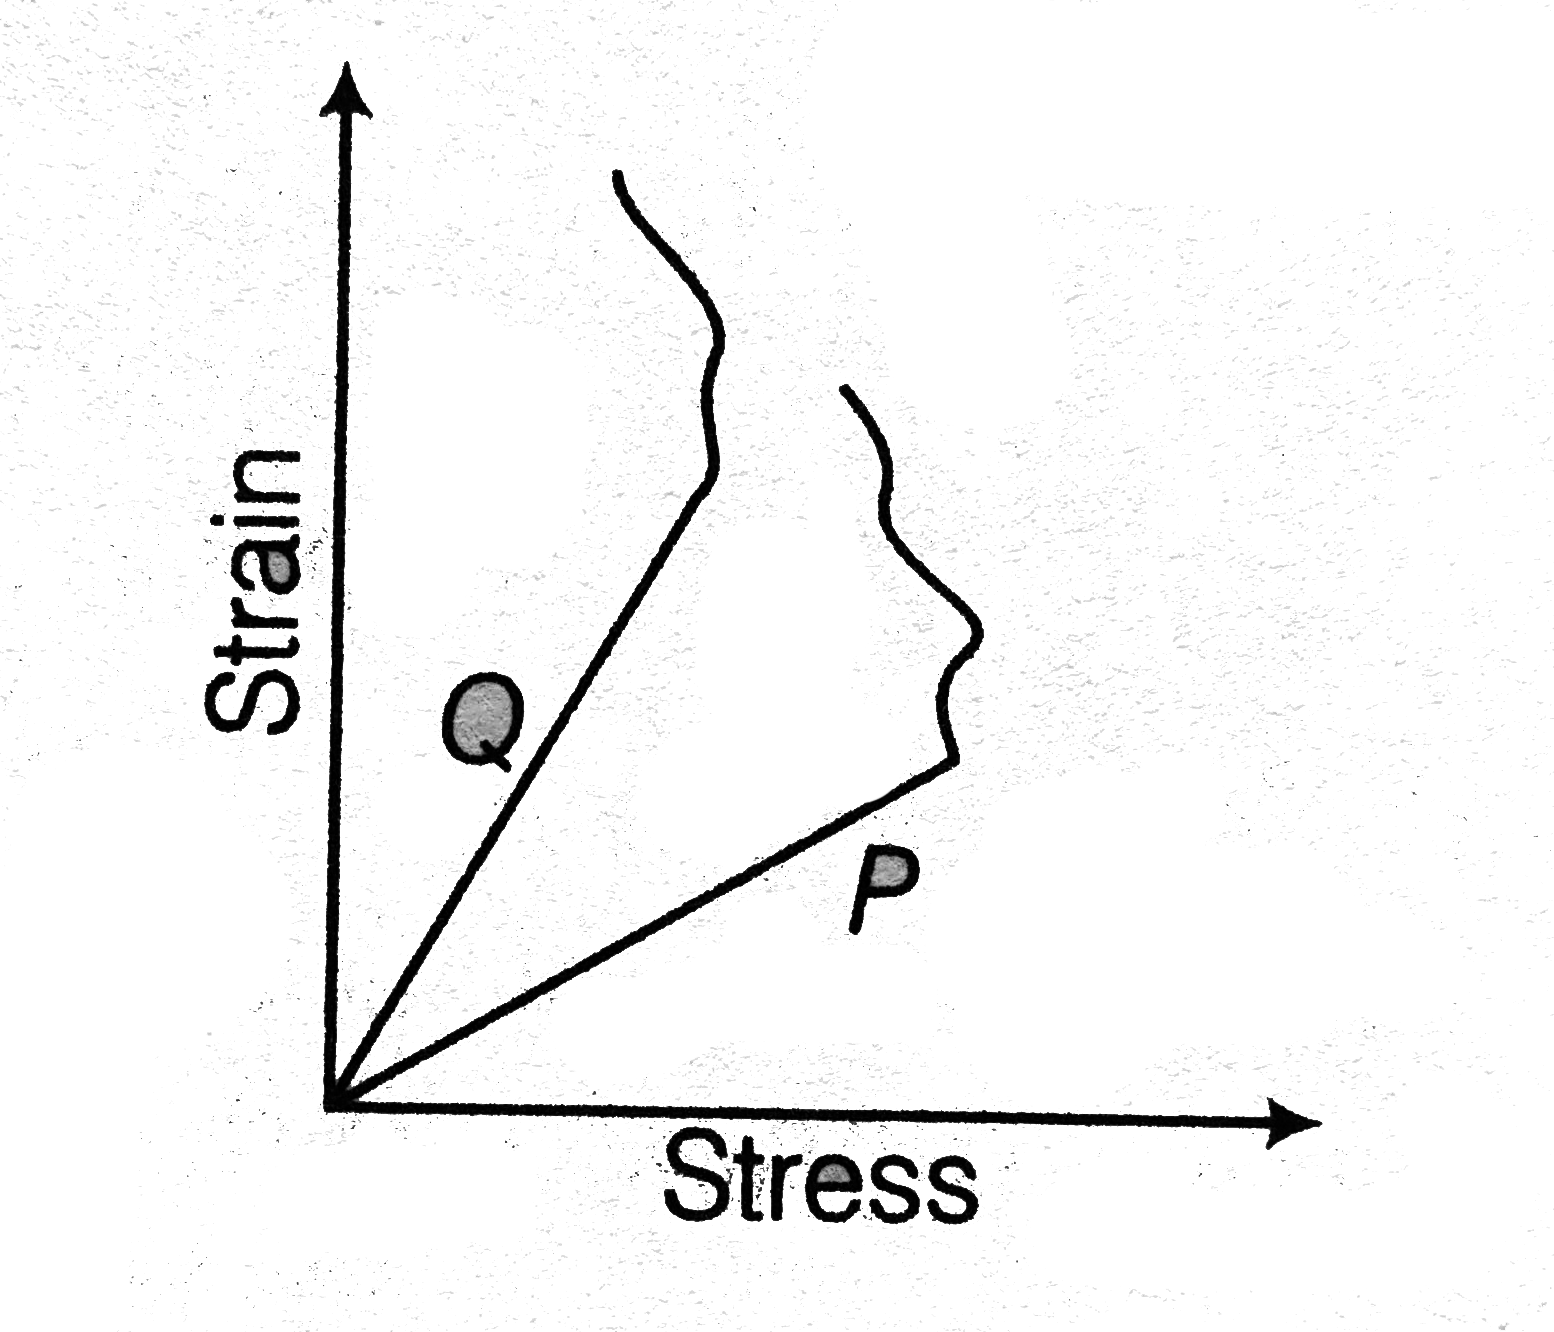
In plotting stress versus strain curves for two materials P and Q, a student by mistake puts strain on the Y-axis and stress on the X- axis as shown in the figure. Then the correct statements is/are :

has more tensile strength than
is more ductile than
is more brittle than
The Young's modulus of is more than that of .
The correct Answer is:A, B
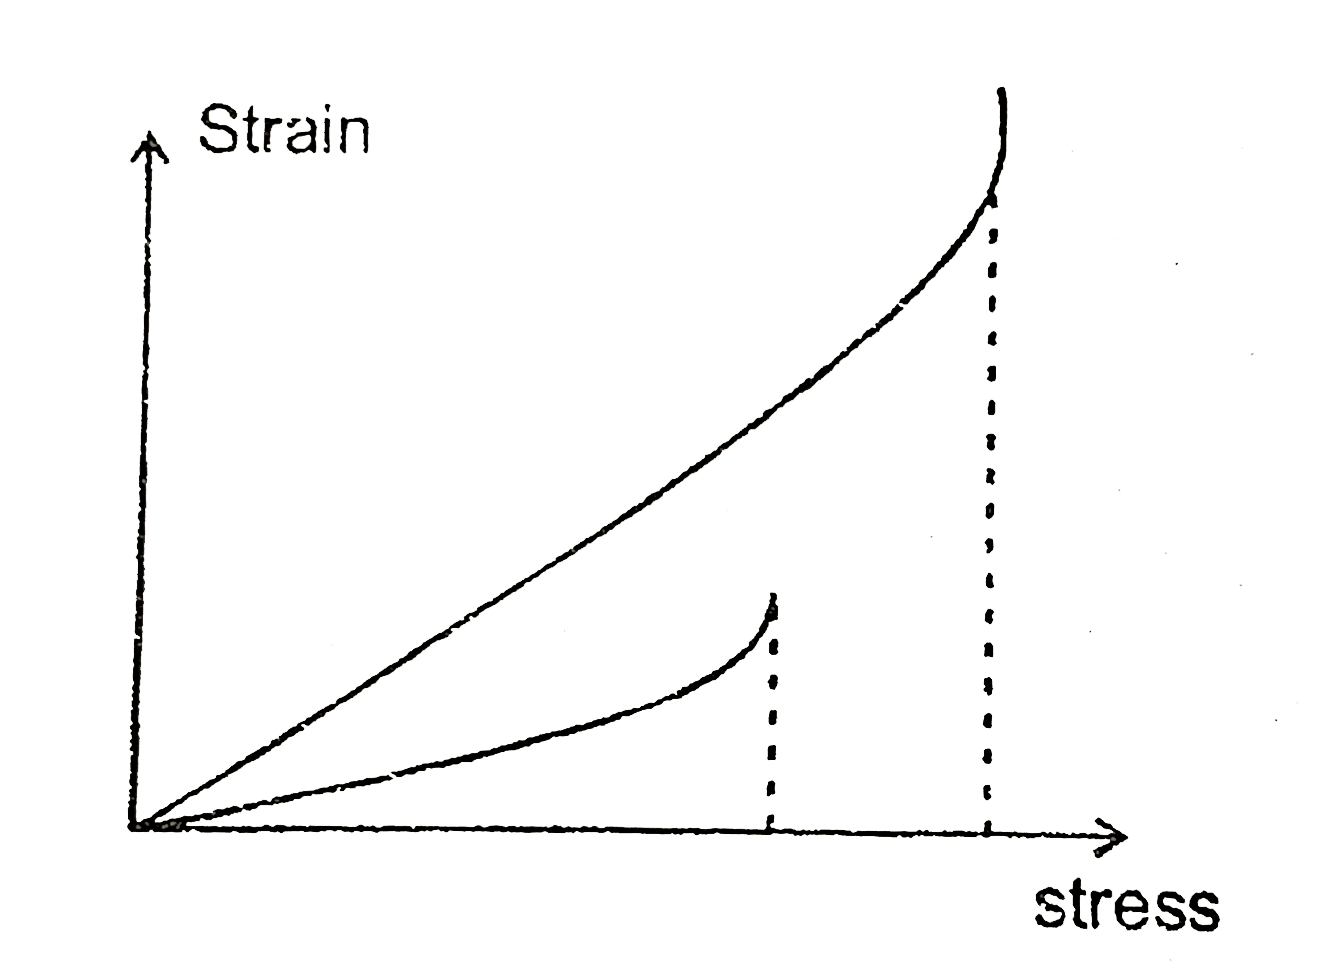
Breaking stress of is more than so is more ductile
strain stress
Topper's Solved these Questions
- BOOK - RESONANCE ENGLISHCHAPTER - ELASTICITY AND VISCOCITYEXERCISE - Exercise- 3 PART - IV9videos
ELASTICITY AND VISCOCITY
- BOOK - RESONANCE ENGLISHCHAPTER - ELASTICITY AND VISCOCITYEXERCISE - Advanced Level Problems9videos
ELASTICITY AND VISCOCITY
- BOOK - RESONANCE ENGLISHCHAPTER - ELASTICITY AND VISCOCITYEXERCISE - Exercise- 2 PART - III8videos
ELASTICITY AND VISCOCITY
- BOOK - RESONANCE ENGLISHCHAPTER - DAILY PRACTICE PROBLEMSEXERCISE - dpp 92 illustration2videos
DAILY PRACTICE PROBLEMS
- BOOK - RESONANCE ENGLISHCHAPTER - ELECTROMAGNETIC INDUCTIONEXERCISE - Exercise43videos
ELECTROMAGNETIC INDUCTION
Similar Questions
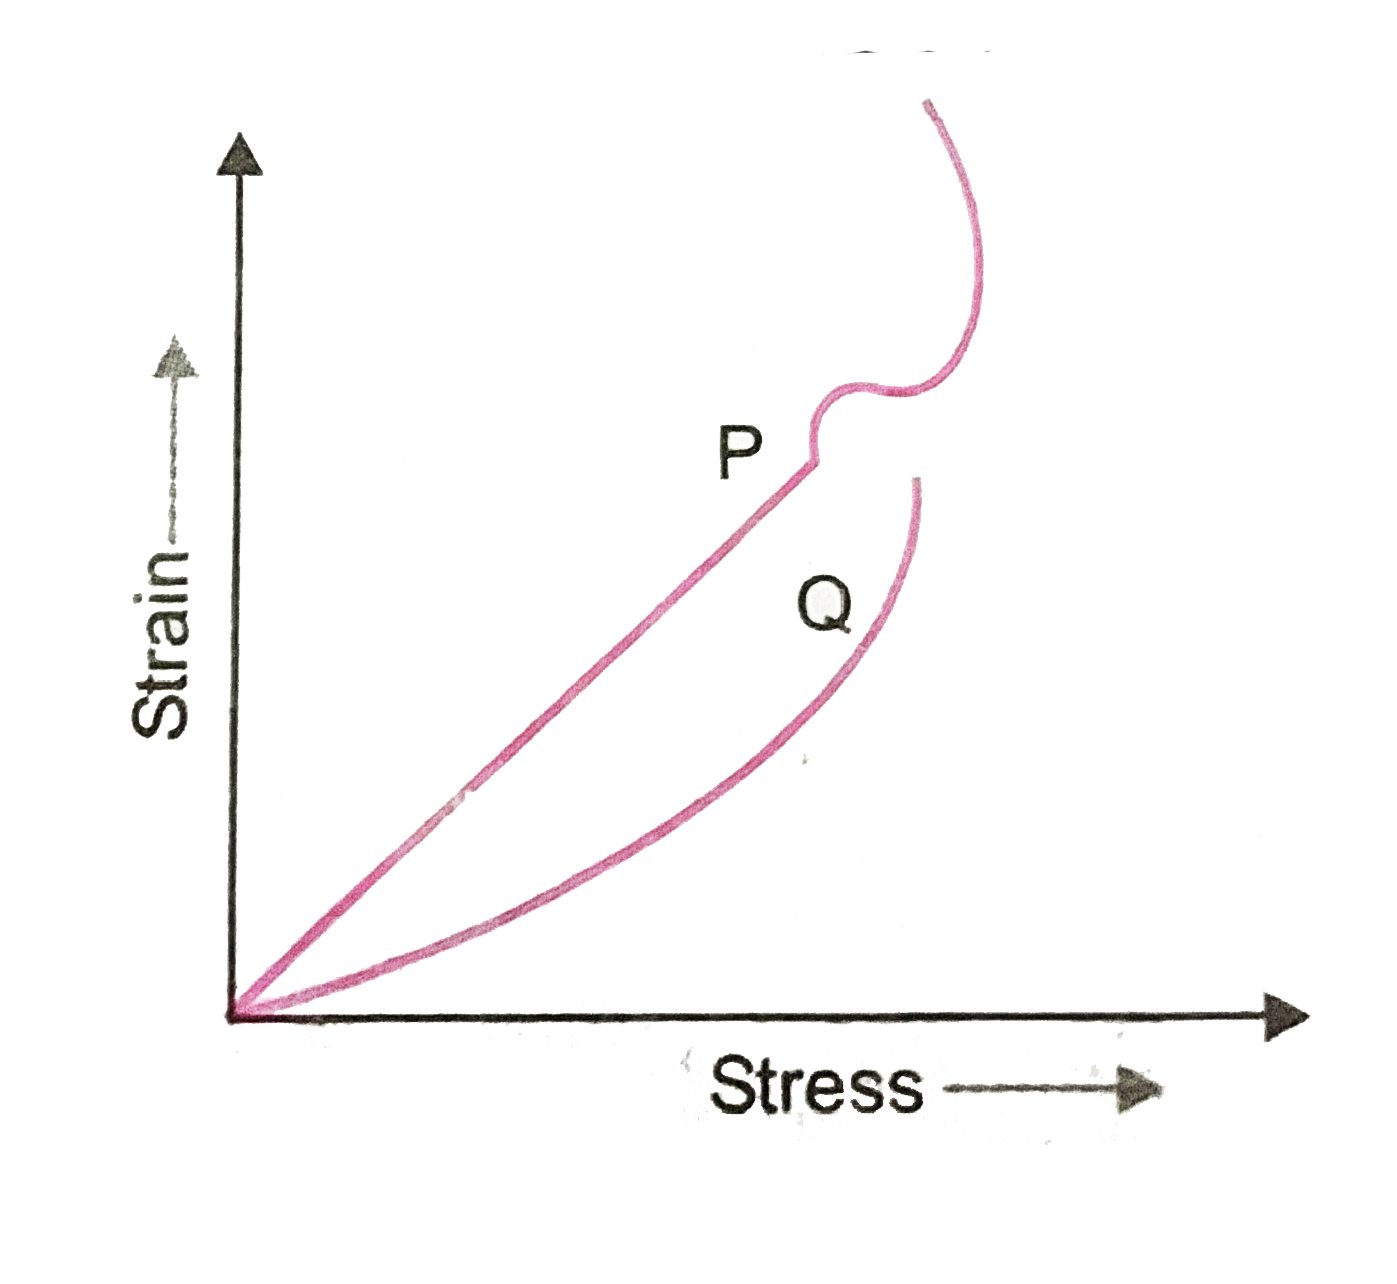
In plotting stress versus strain curves for two material P and Q, a student by mistake puts strain on the y-axis stress on ther x-axis as shown in the figure. Then the correct statement is/are
 View Solution
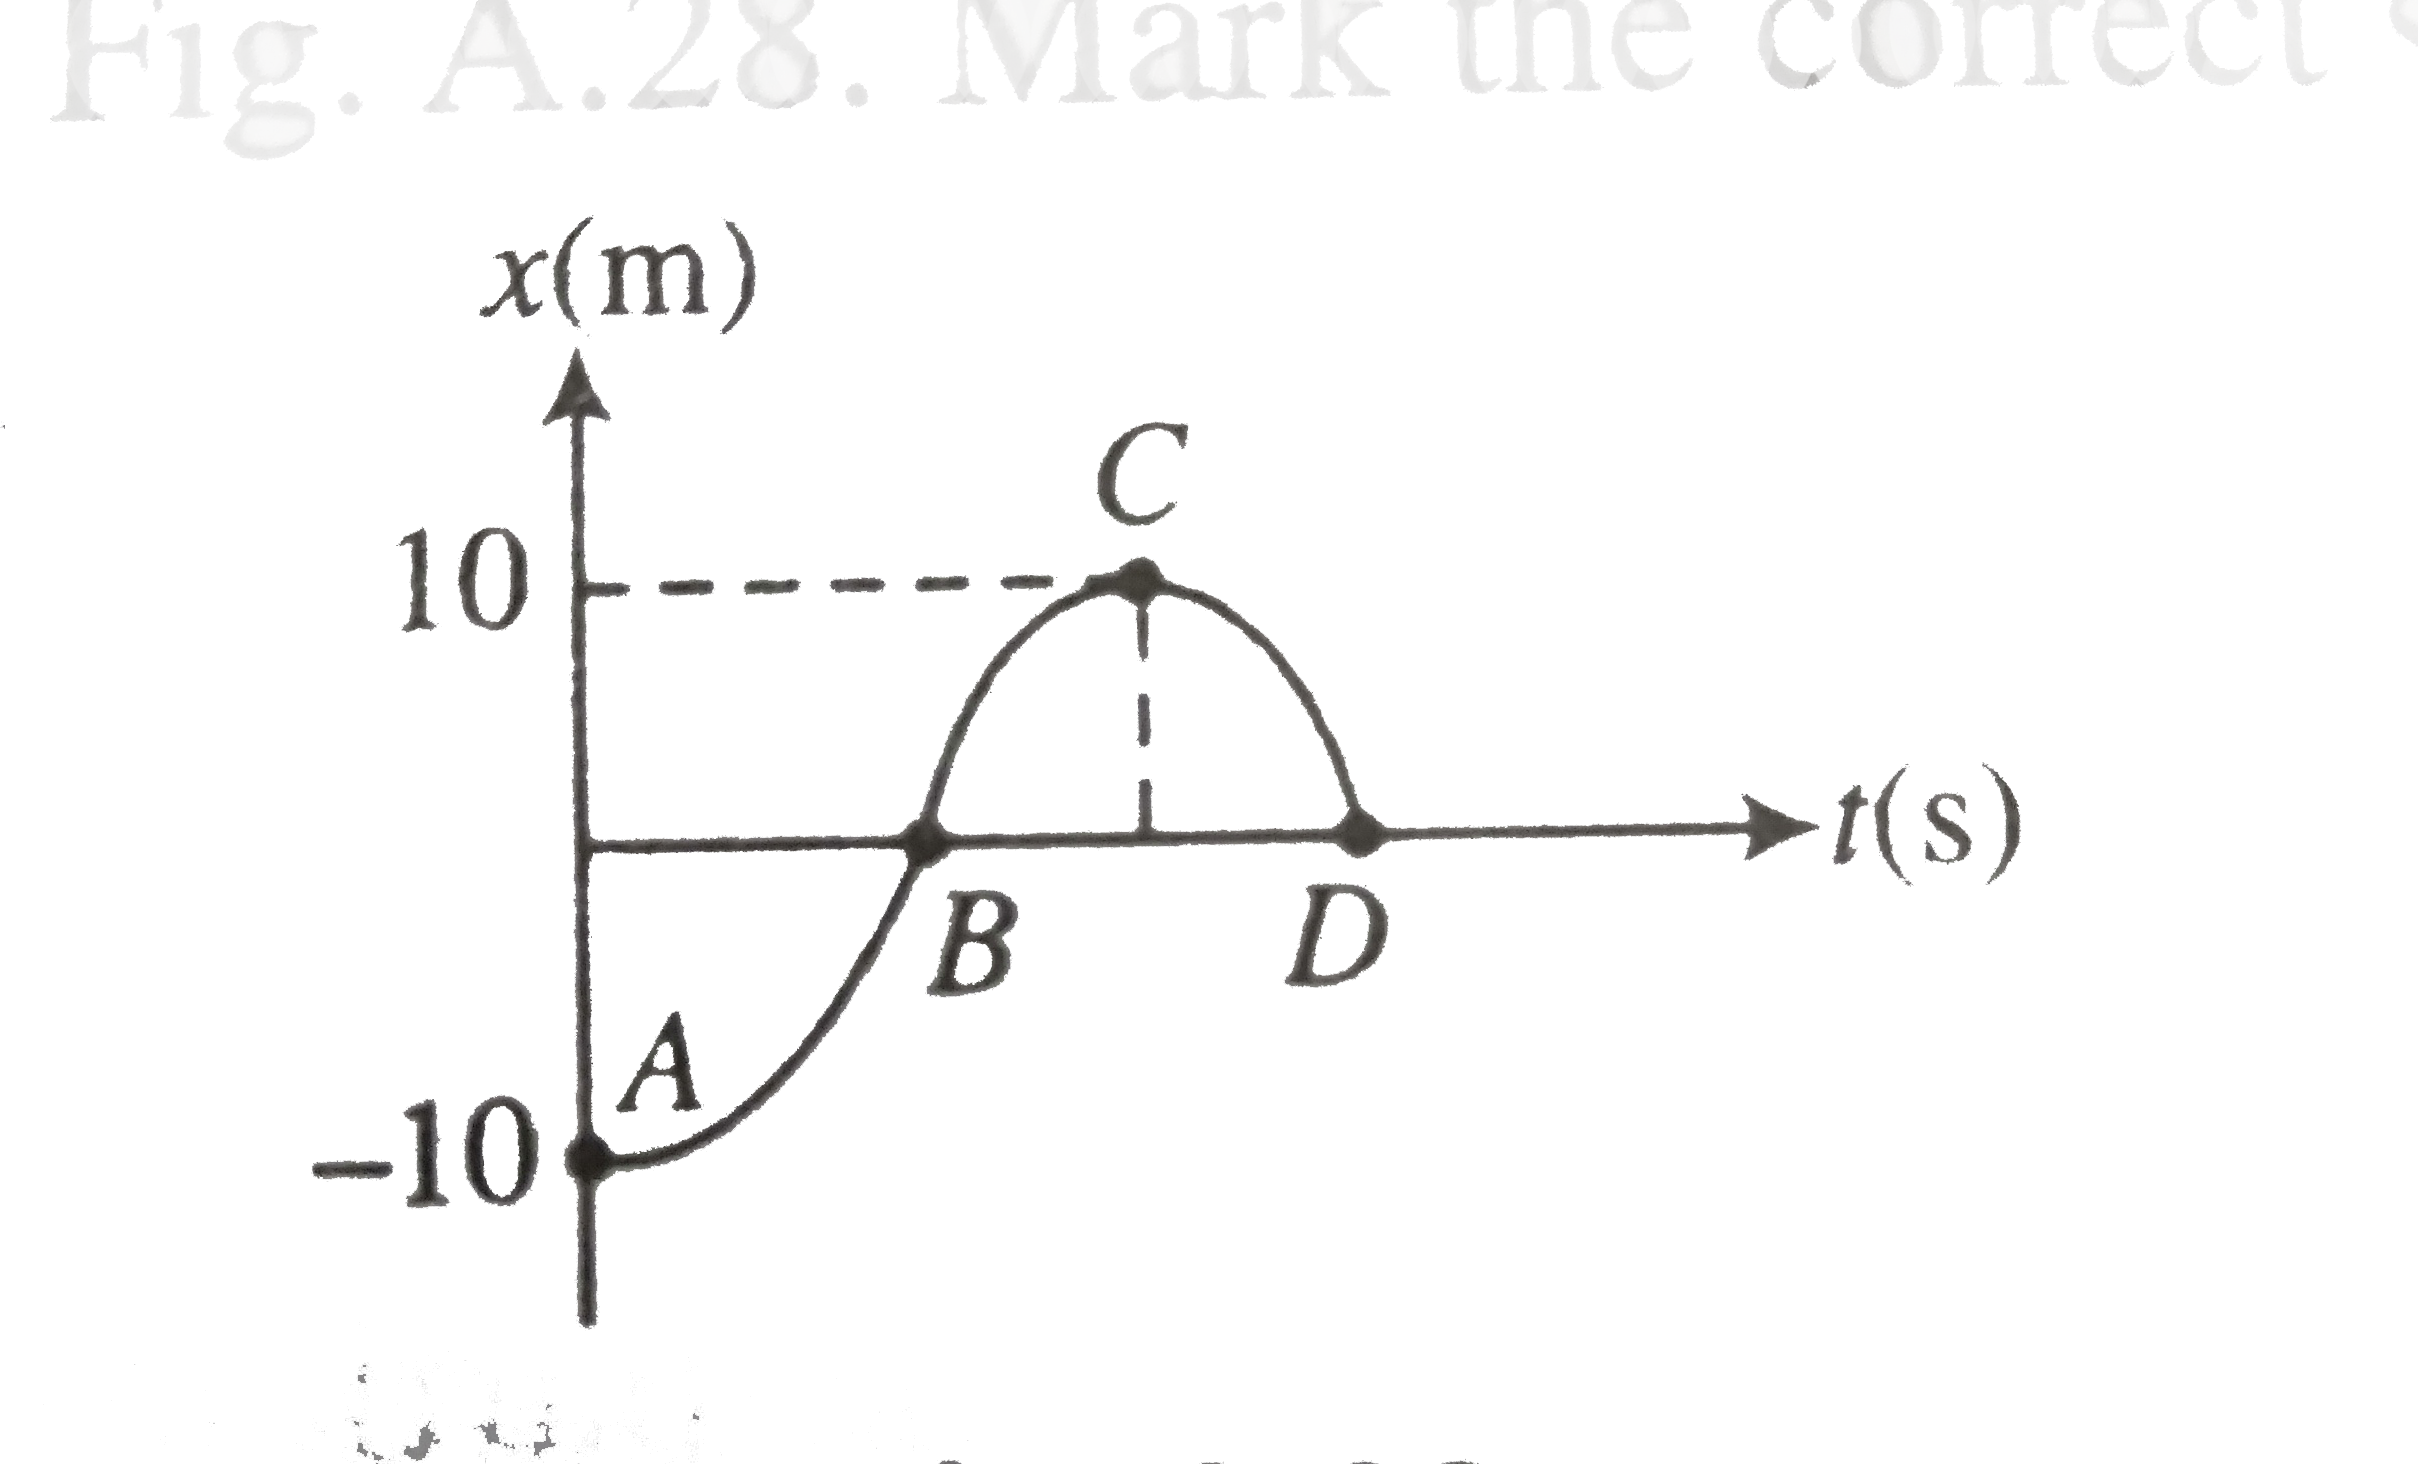
For a particle moving along x-axis, a scaled x-6 graph is shown in figure. Mark the correct statement (s).
 View Solution
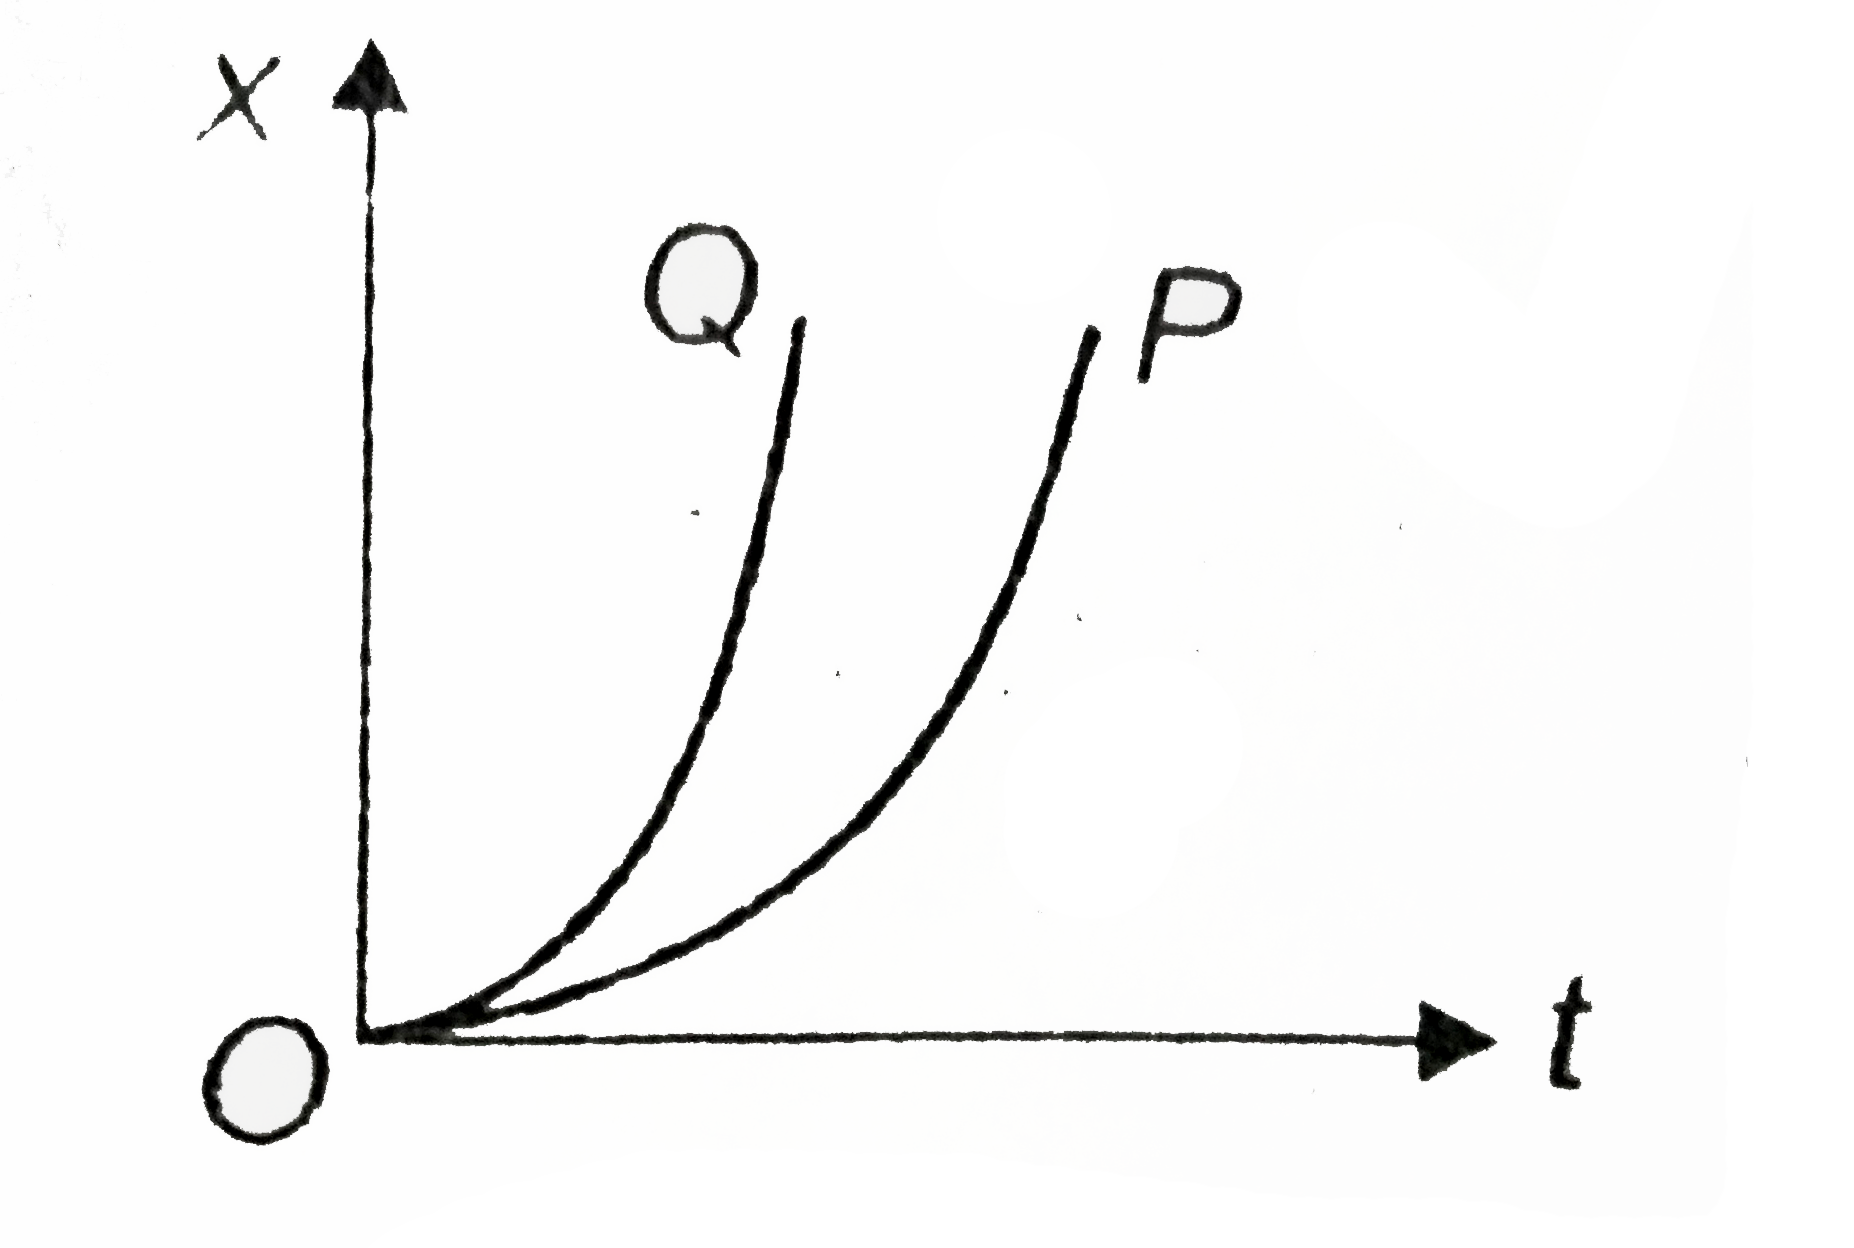
The position-time graph for two particles P and Q moving on x-axis is shown in the figure. Then
 View Solution
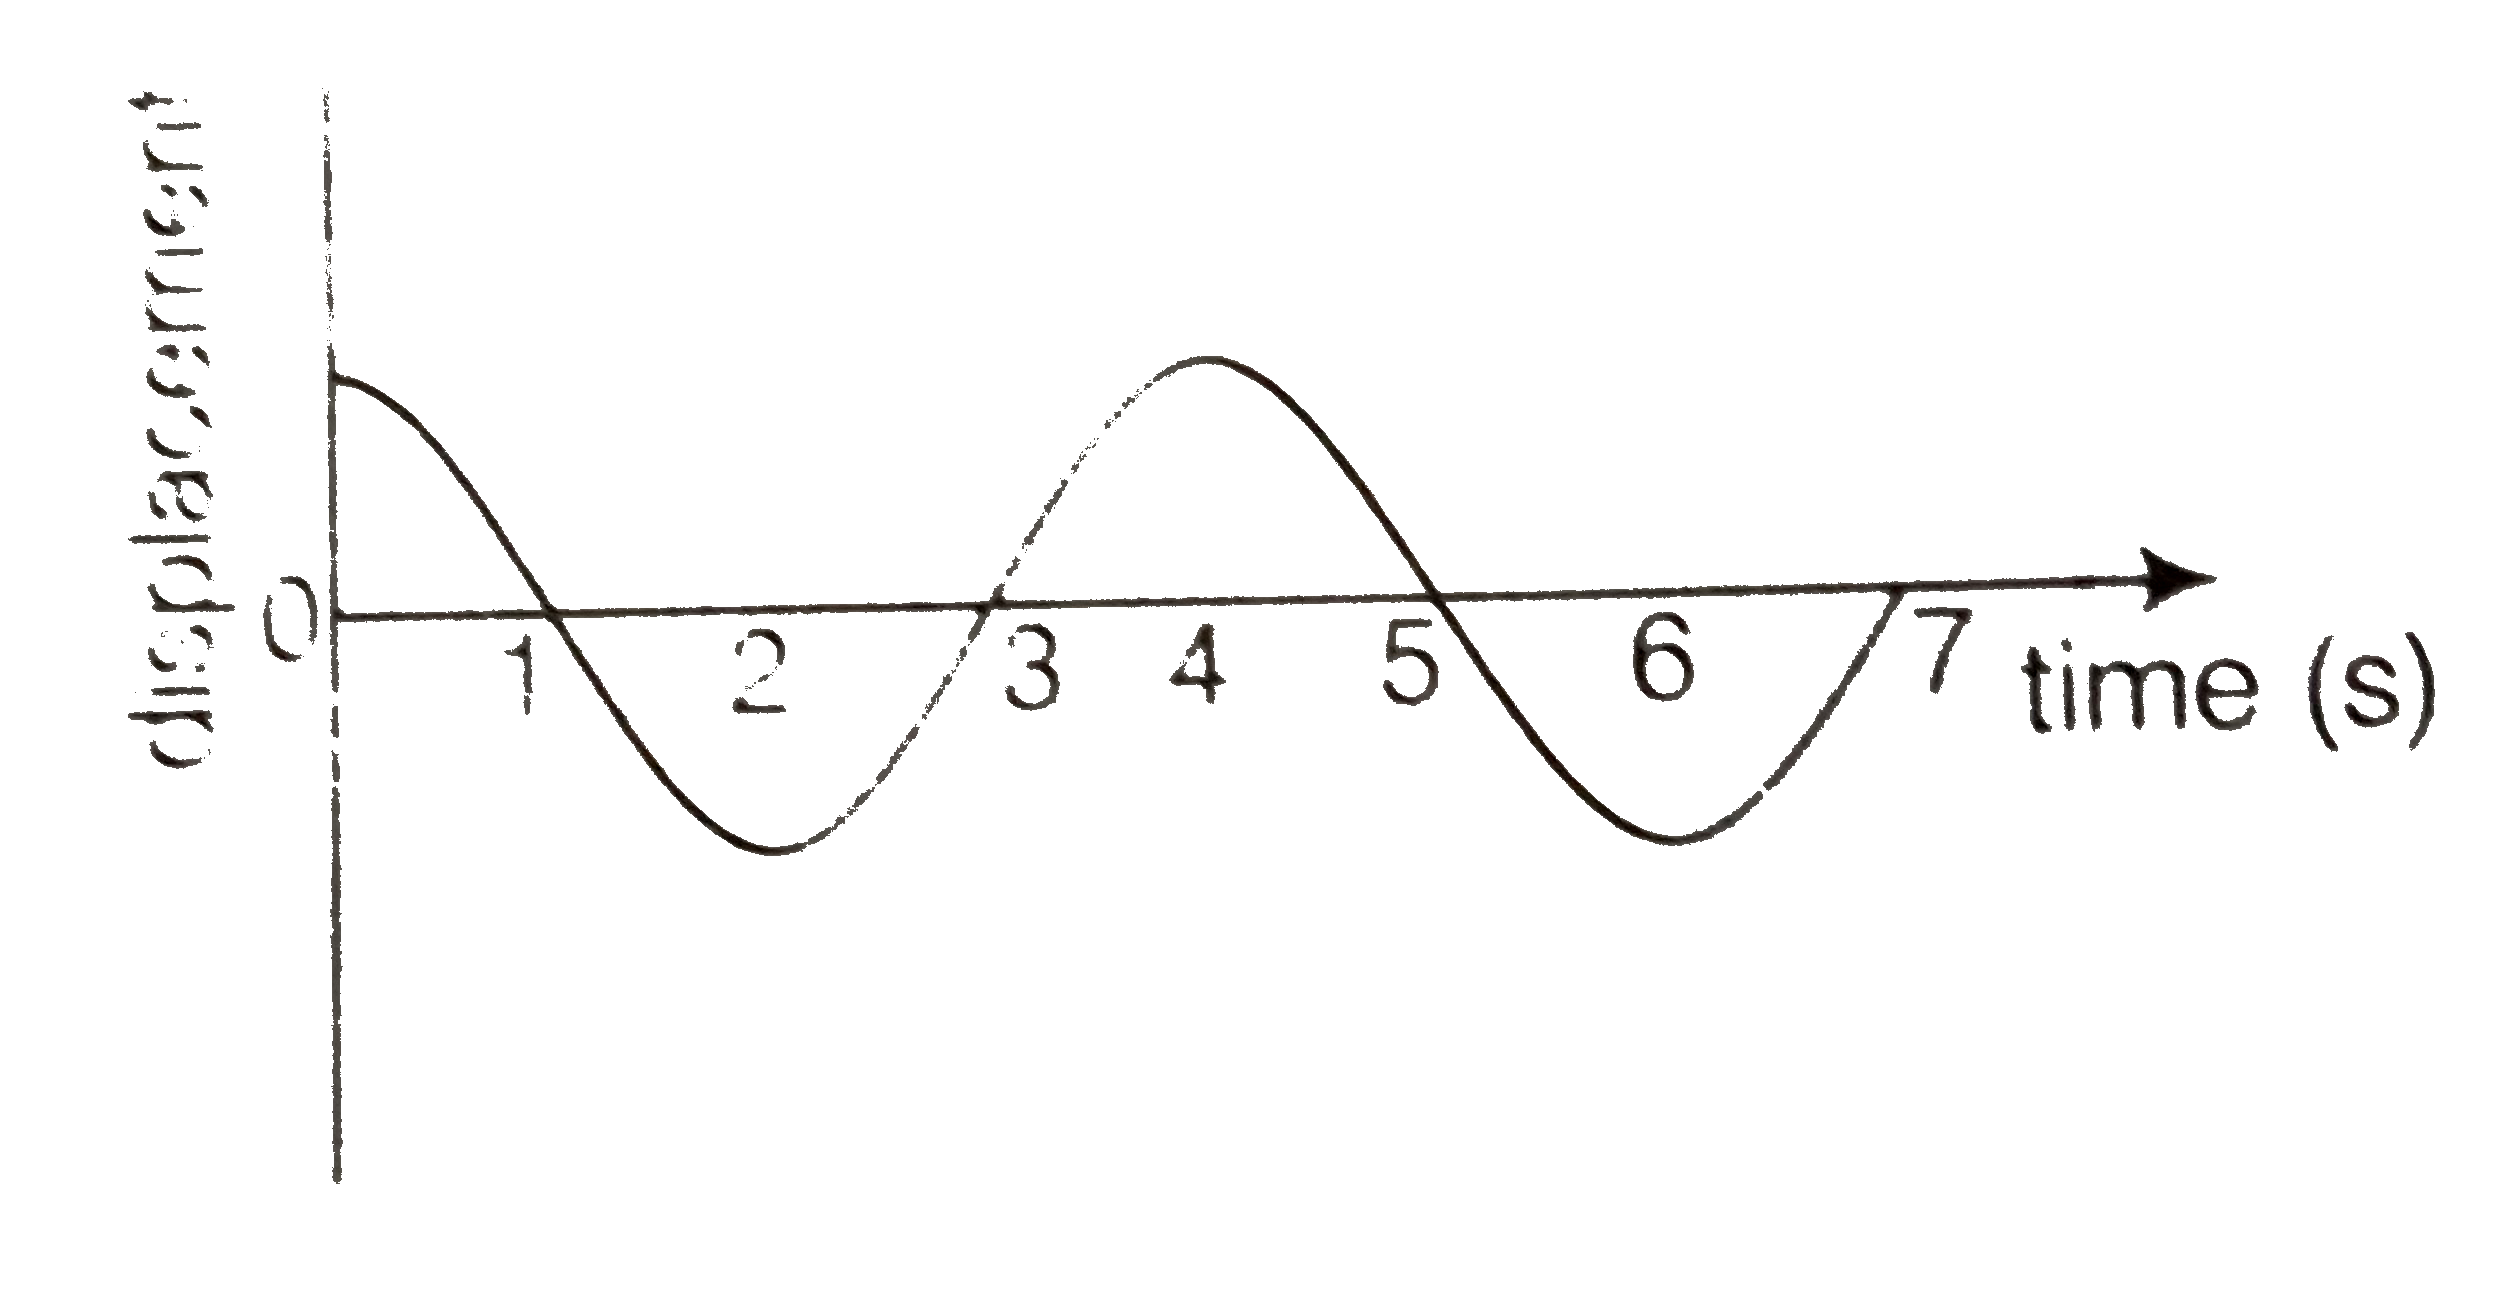
Displacement versus time curve for a particle executing SHM is shown in figure. Choose the correct statements.
 View Solution
Displacement versus time curve for a particle executing SHM is shown in figure. Choose the correct statements.
 View Solution
Figure shows the stress-strain curve of two metals P and Q . From the graph, it can be concluded that
 View Solution
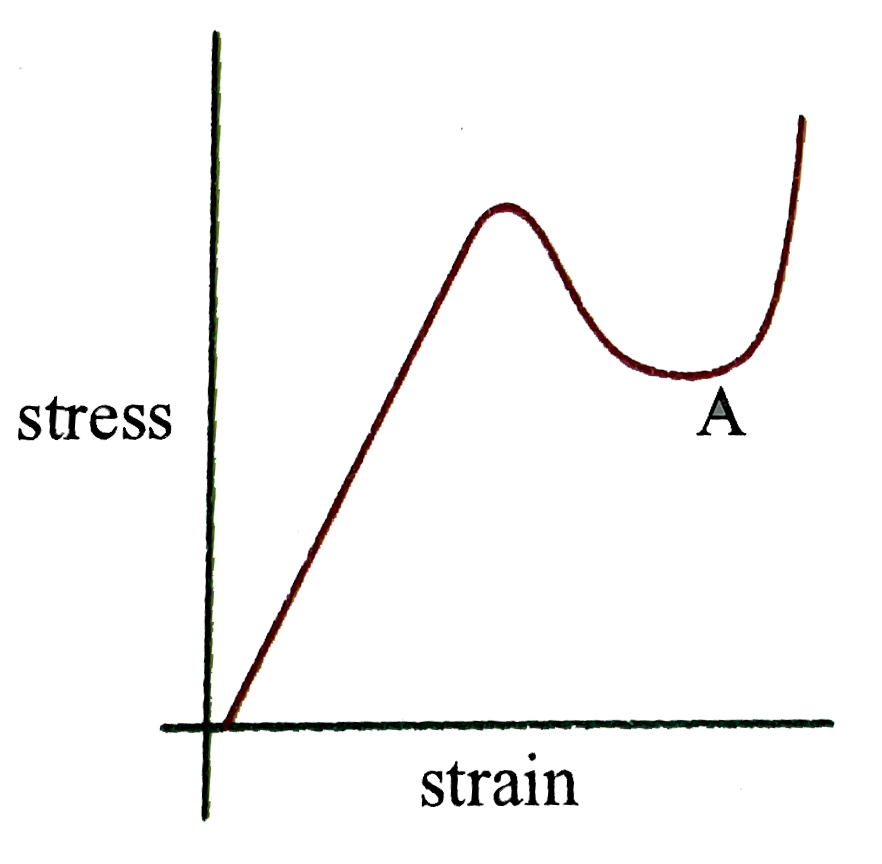
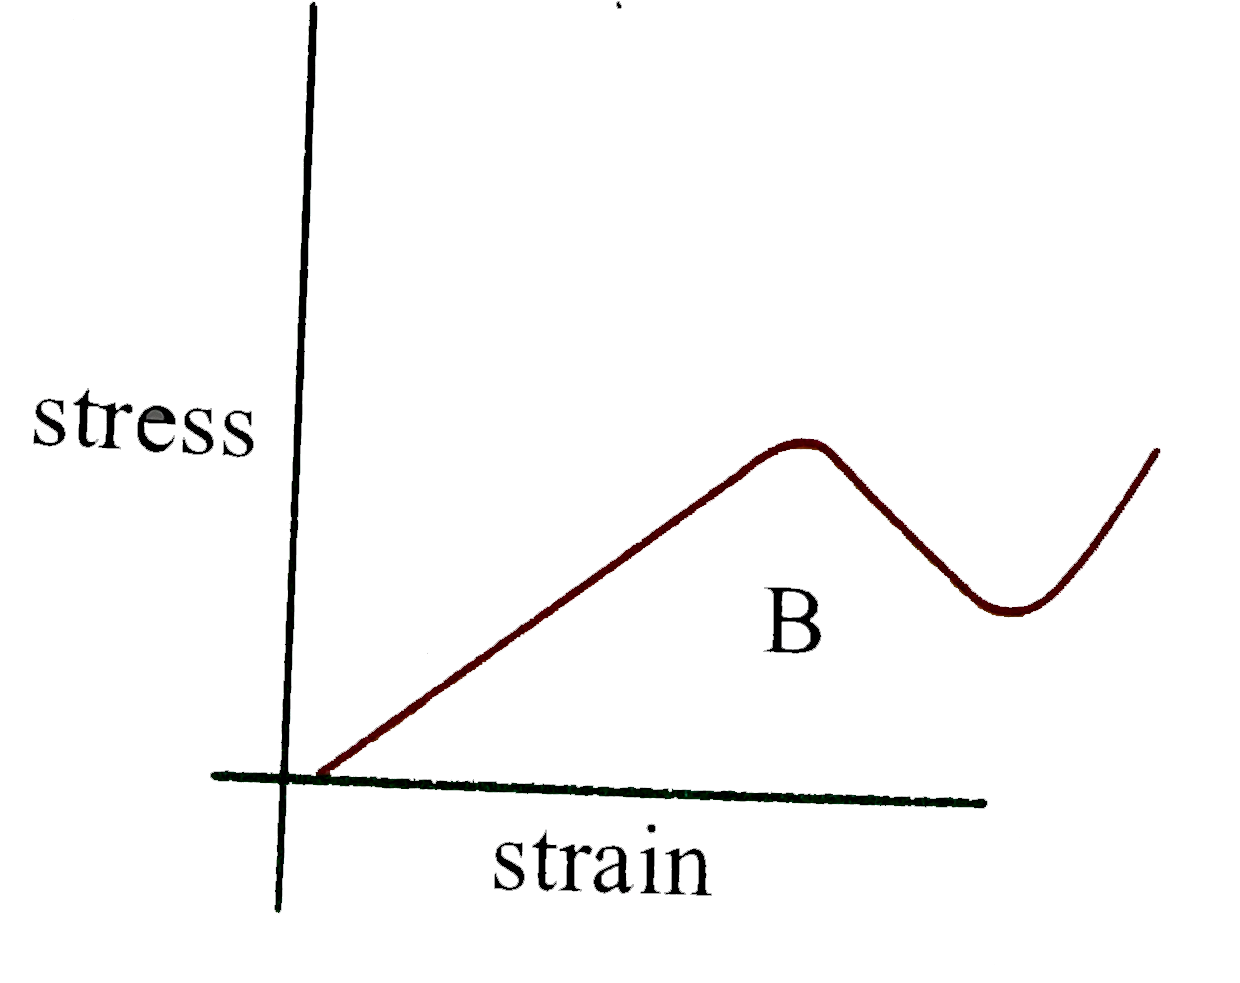
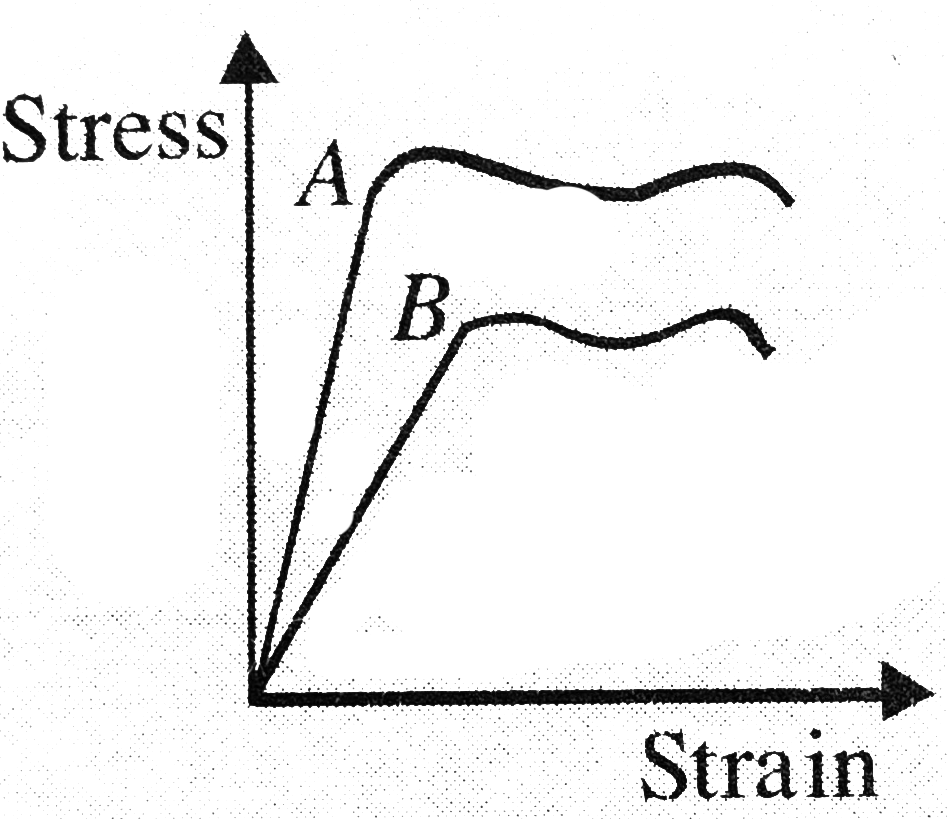
The stress- strain graphs for materials A and B are as shown. Choose the correct alternative
 View Solution
The stress and strain graphs for two materials, A and B are shown here. Answer the following :give reasons
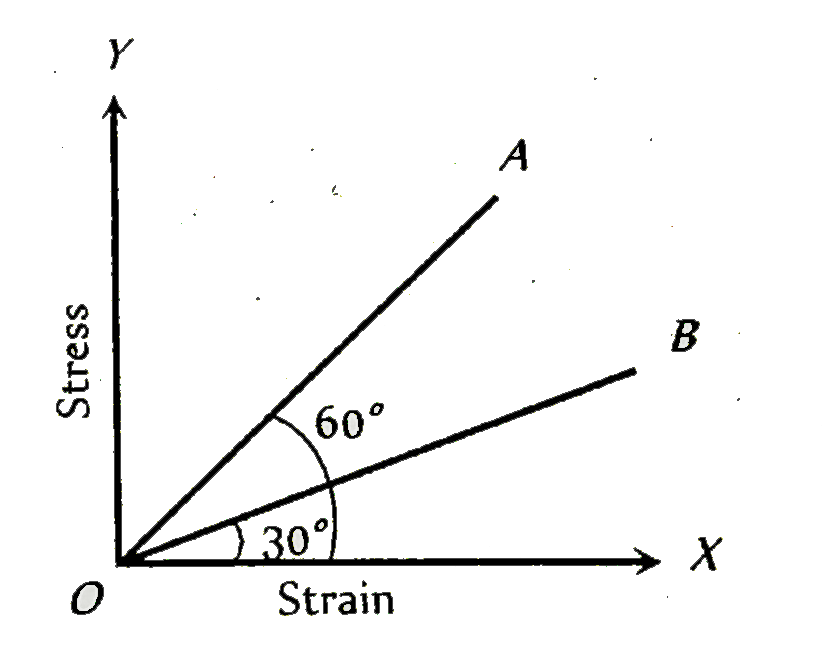
View SolutionThe stress versus strain graphs for wires of two materials A and B are as shown in the figure. If YAandYB are the younng's moduli of the materials, then
 View Solution
The stress versus strain graphs for wires of two materials A and B are as shown in the figure. If YAandYB are the younng's moduli of the materials, then
 View Solution

