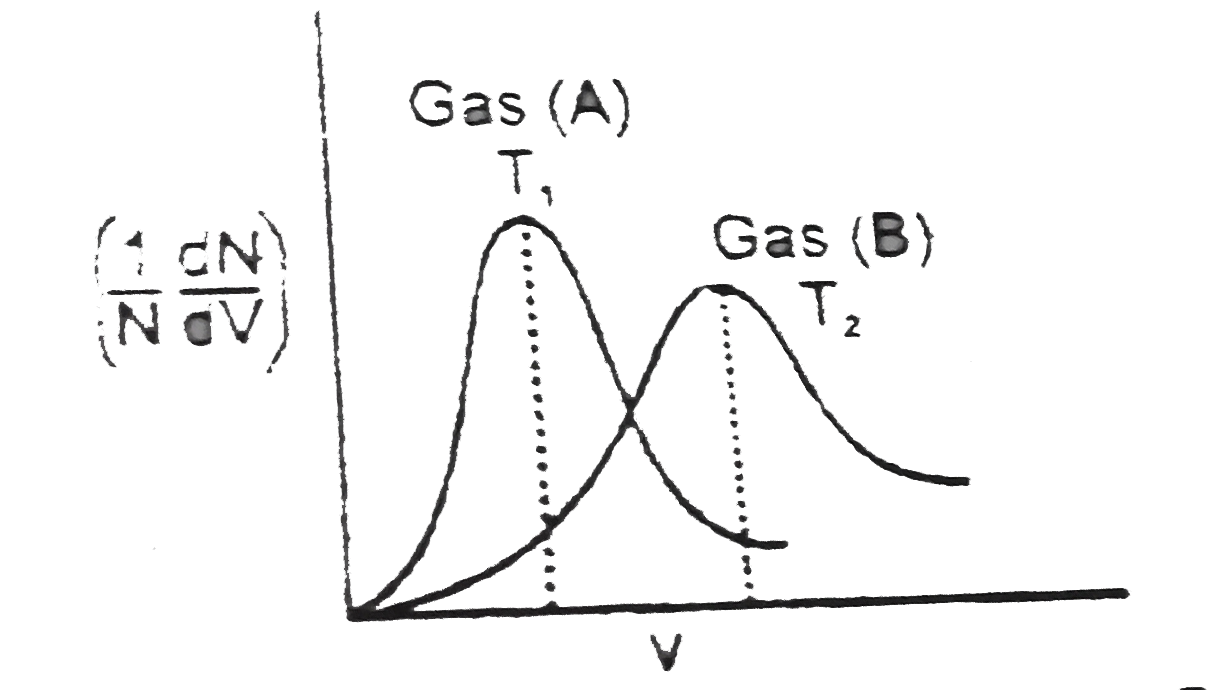
According to Maxwell's distribution of molecular speeds, the following graph has been drawn for two different samples of gases A and B at temperature respectively.Then, give the correct set of INCORRECT statements : Report your answer as sum of the numbers of incorrect statements.
For examples, if statements (1) and (2) are incorrect, then report answer as (1+2)=3

The correct Answer is:6
At constant temperature , decreases in molecular mass causes flatterning of the graph.For same molecular mass of gas, increase in temperature causes flattening of the graph.
From the above graph,
But, may be less than or greater than 1.
Statements(1),(2)&(3) are wrong. Reported answer=1+2+3=6
Topper's Solved these Questions
Similar Questions
Two perfect gases at absolute temperature T1andT2 are mixed. There is no loss of energy. The masses of the molecules are m1andm2. The number of molecules in the gases are n1andn2. The temperature of the mixture is
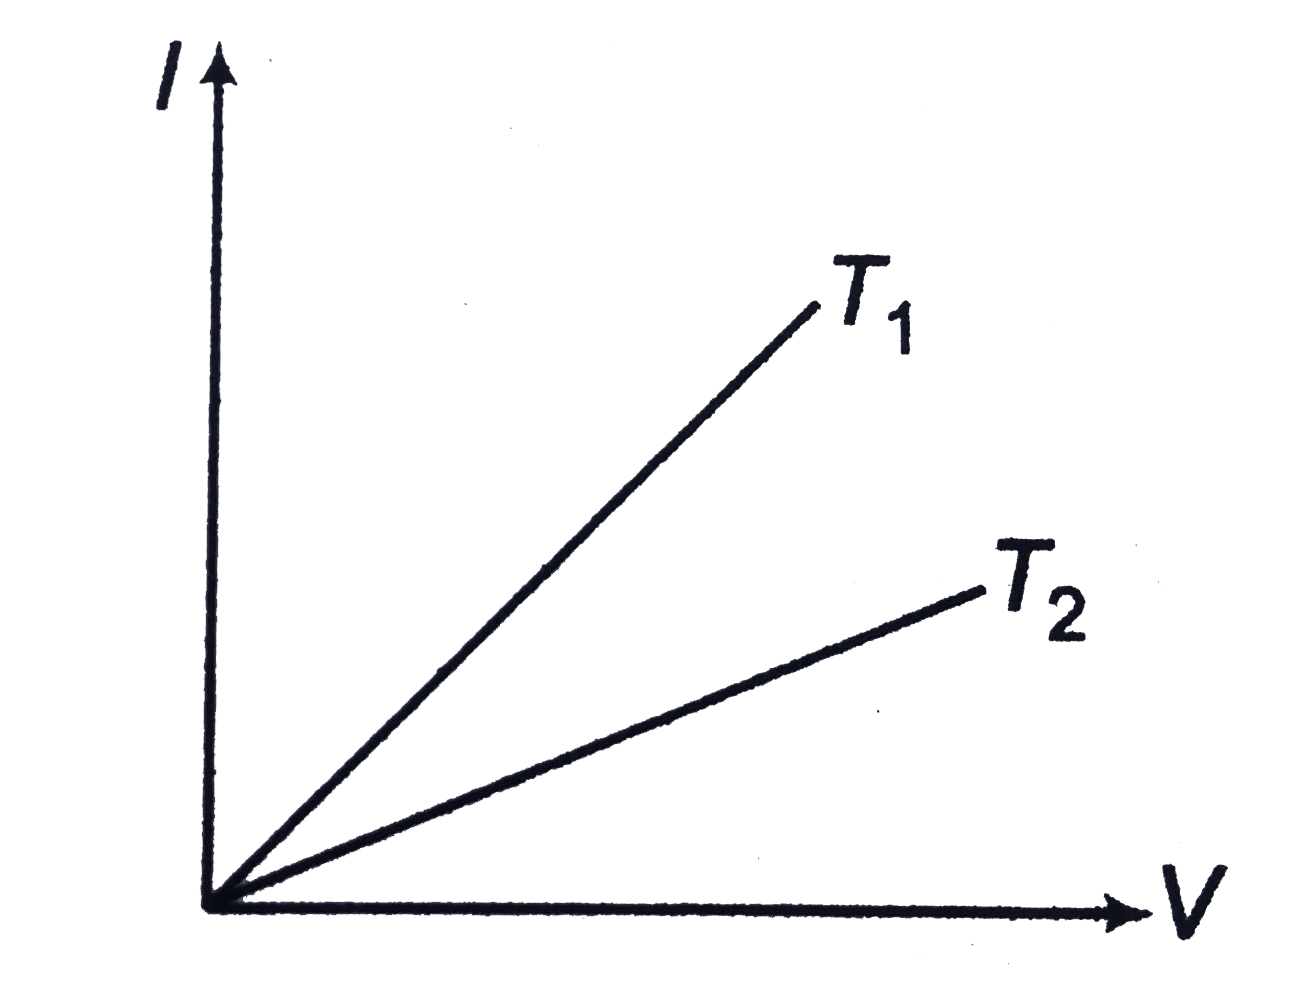
View SolutionThe current voltage graphs for a given metalic wire two different temperature T1 and T2 are shown in figure The temperature T2 is greater than T1. Is this statement true or false?
 View Solution
The current voltage graphs for a given metalic wire two different temperature T1 and T2 are shown in figure The temperature T2 is greater than T1. Is this statement true or false?
 View Solution
The stress-strain graph for a metallic wire is shown at two different temperature, T1 and T2 which temperature is high T1 or T2 ?
View Solutionthe incorrect statement with respect to SN1 and SN2 mechanisms for alkyl halide is :
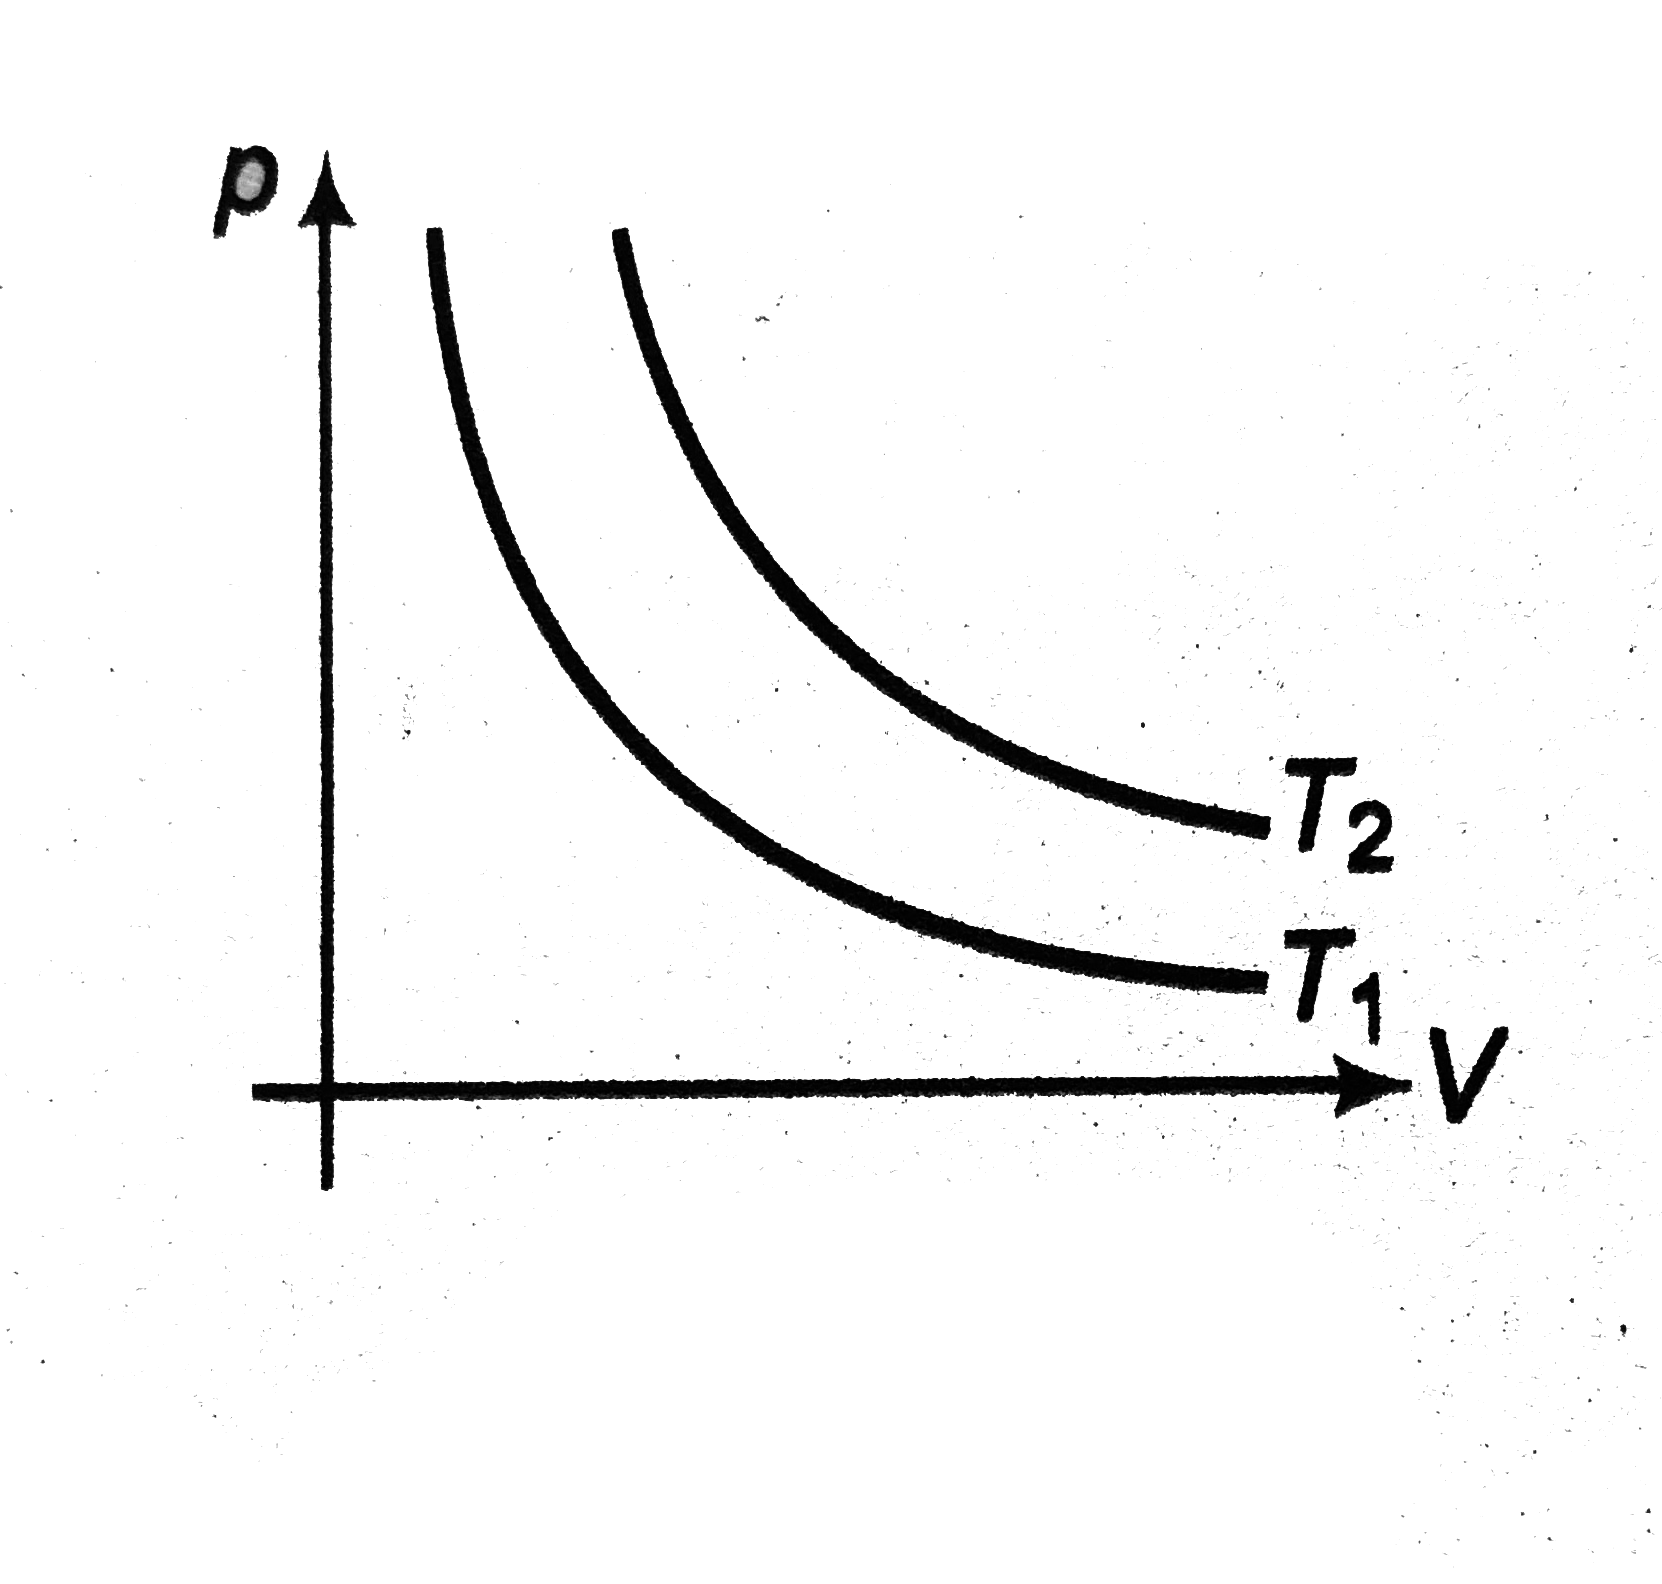
View Solutionp−V diagram of same mass of a gas are drawn at two different temperatures (T1) and (T2). Explain whether T1>T2orT2>T1.
 .View Solution
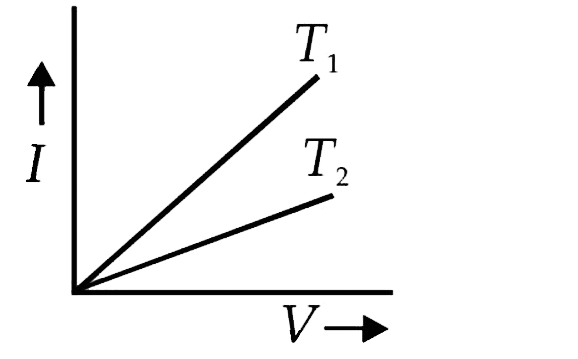
The current - voltage graphs for a given metallic wire at two different temperatures T1andT2 are shown in the figure.

The temperature T2 is greater than T1.View SolutionThe current - voltage graphs for a given metallic wire at two different temperatures T1andT2 are shown in the figure.

The temperature T2 is greater than T1.View SolutionThe molecular velocities of two gases at same temperature are u1 and u2, their masses are m1 and m2 respectively, which of the following expression is correct ?
View SolutionThe molecular velocities of two gases at same temperature are u1 and u2, their masses are m1 and m2 respectively, which of the following expression is correct ?
View Solution

