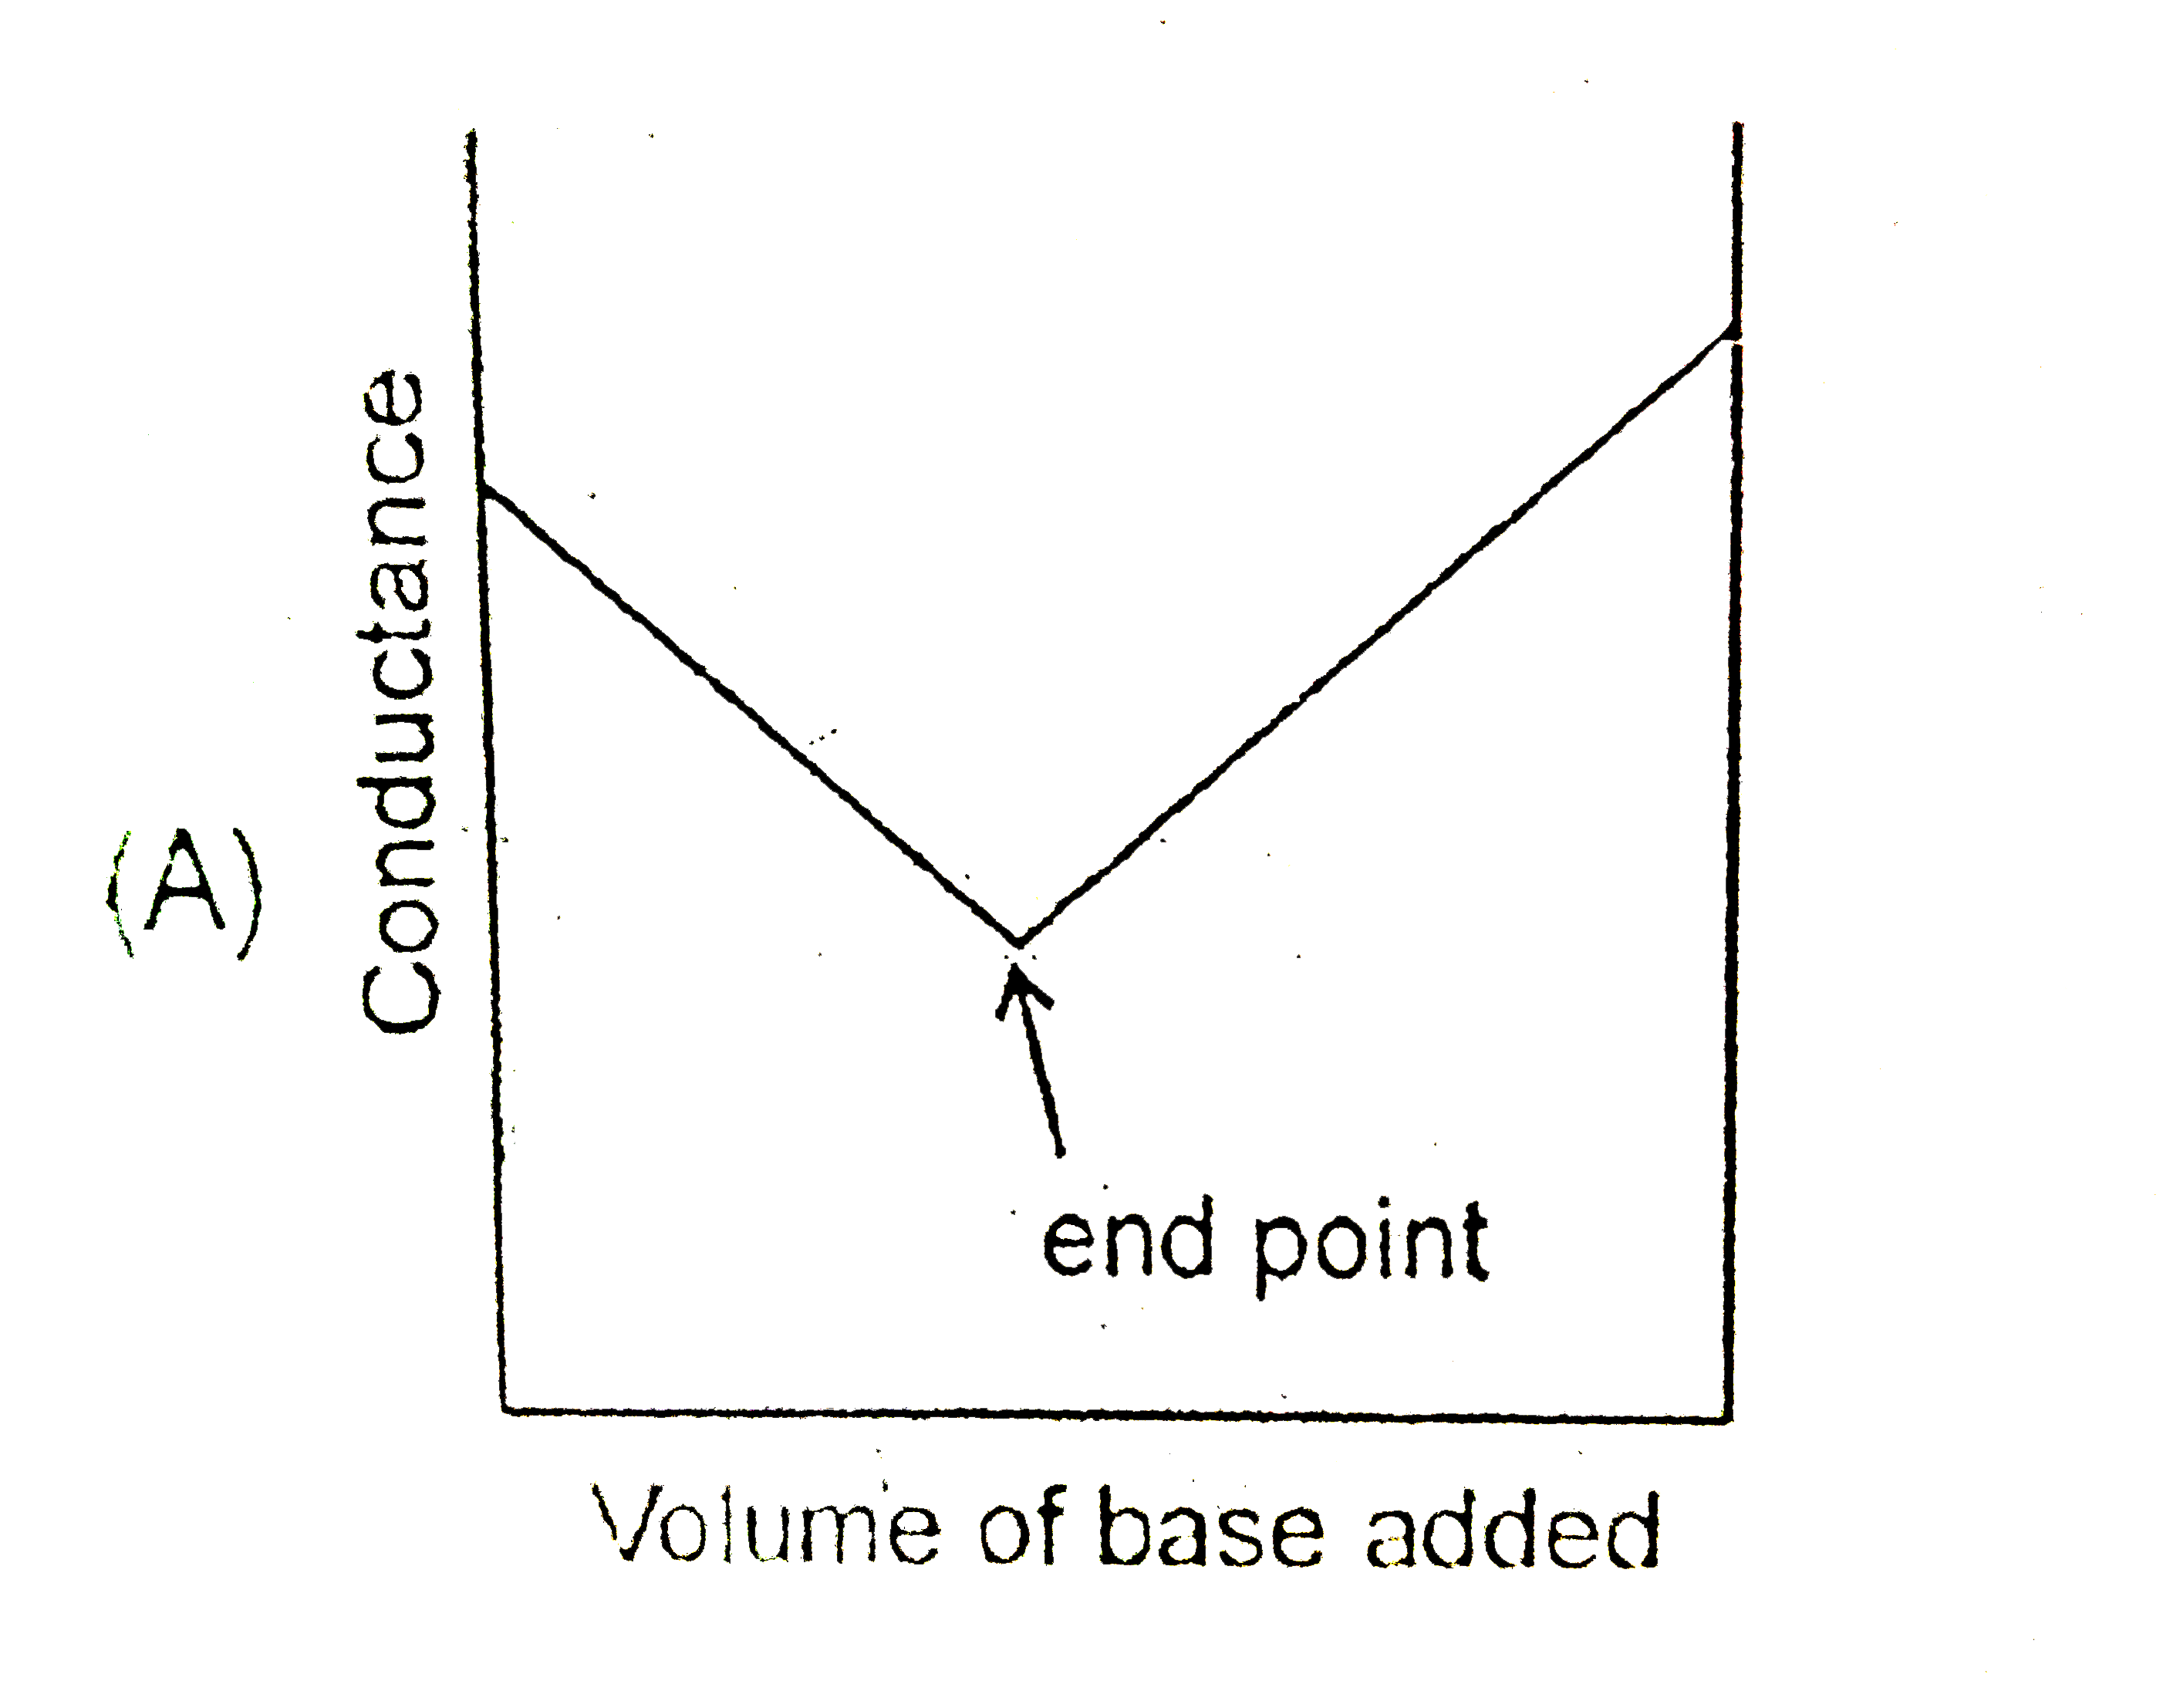
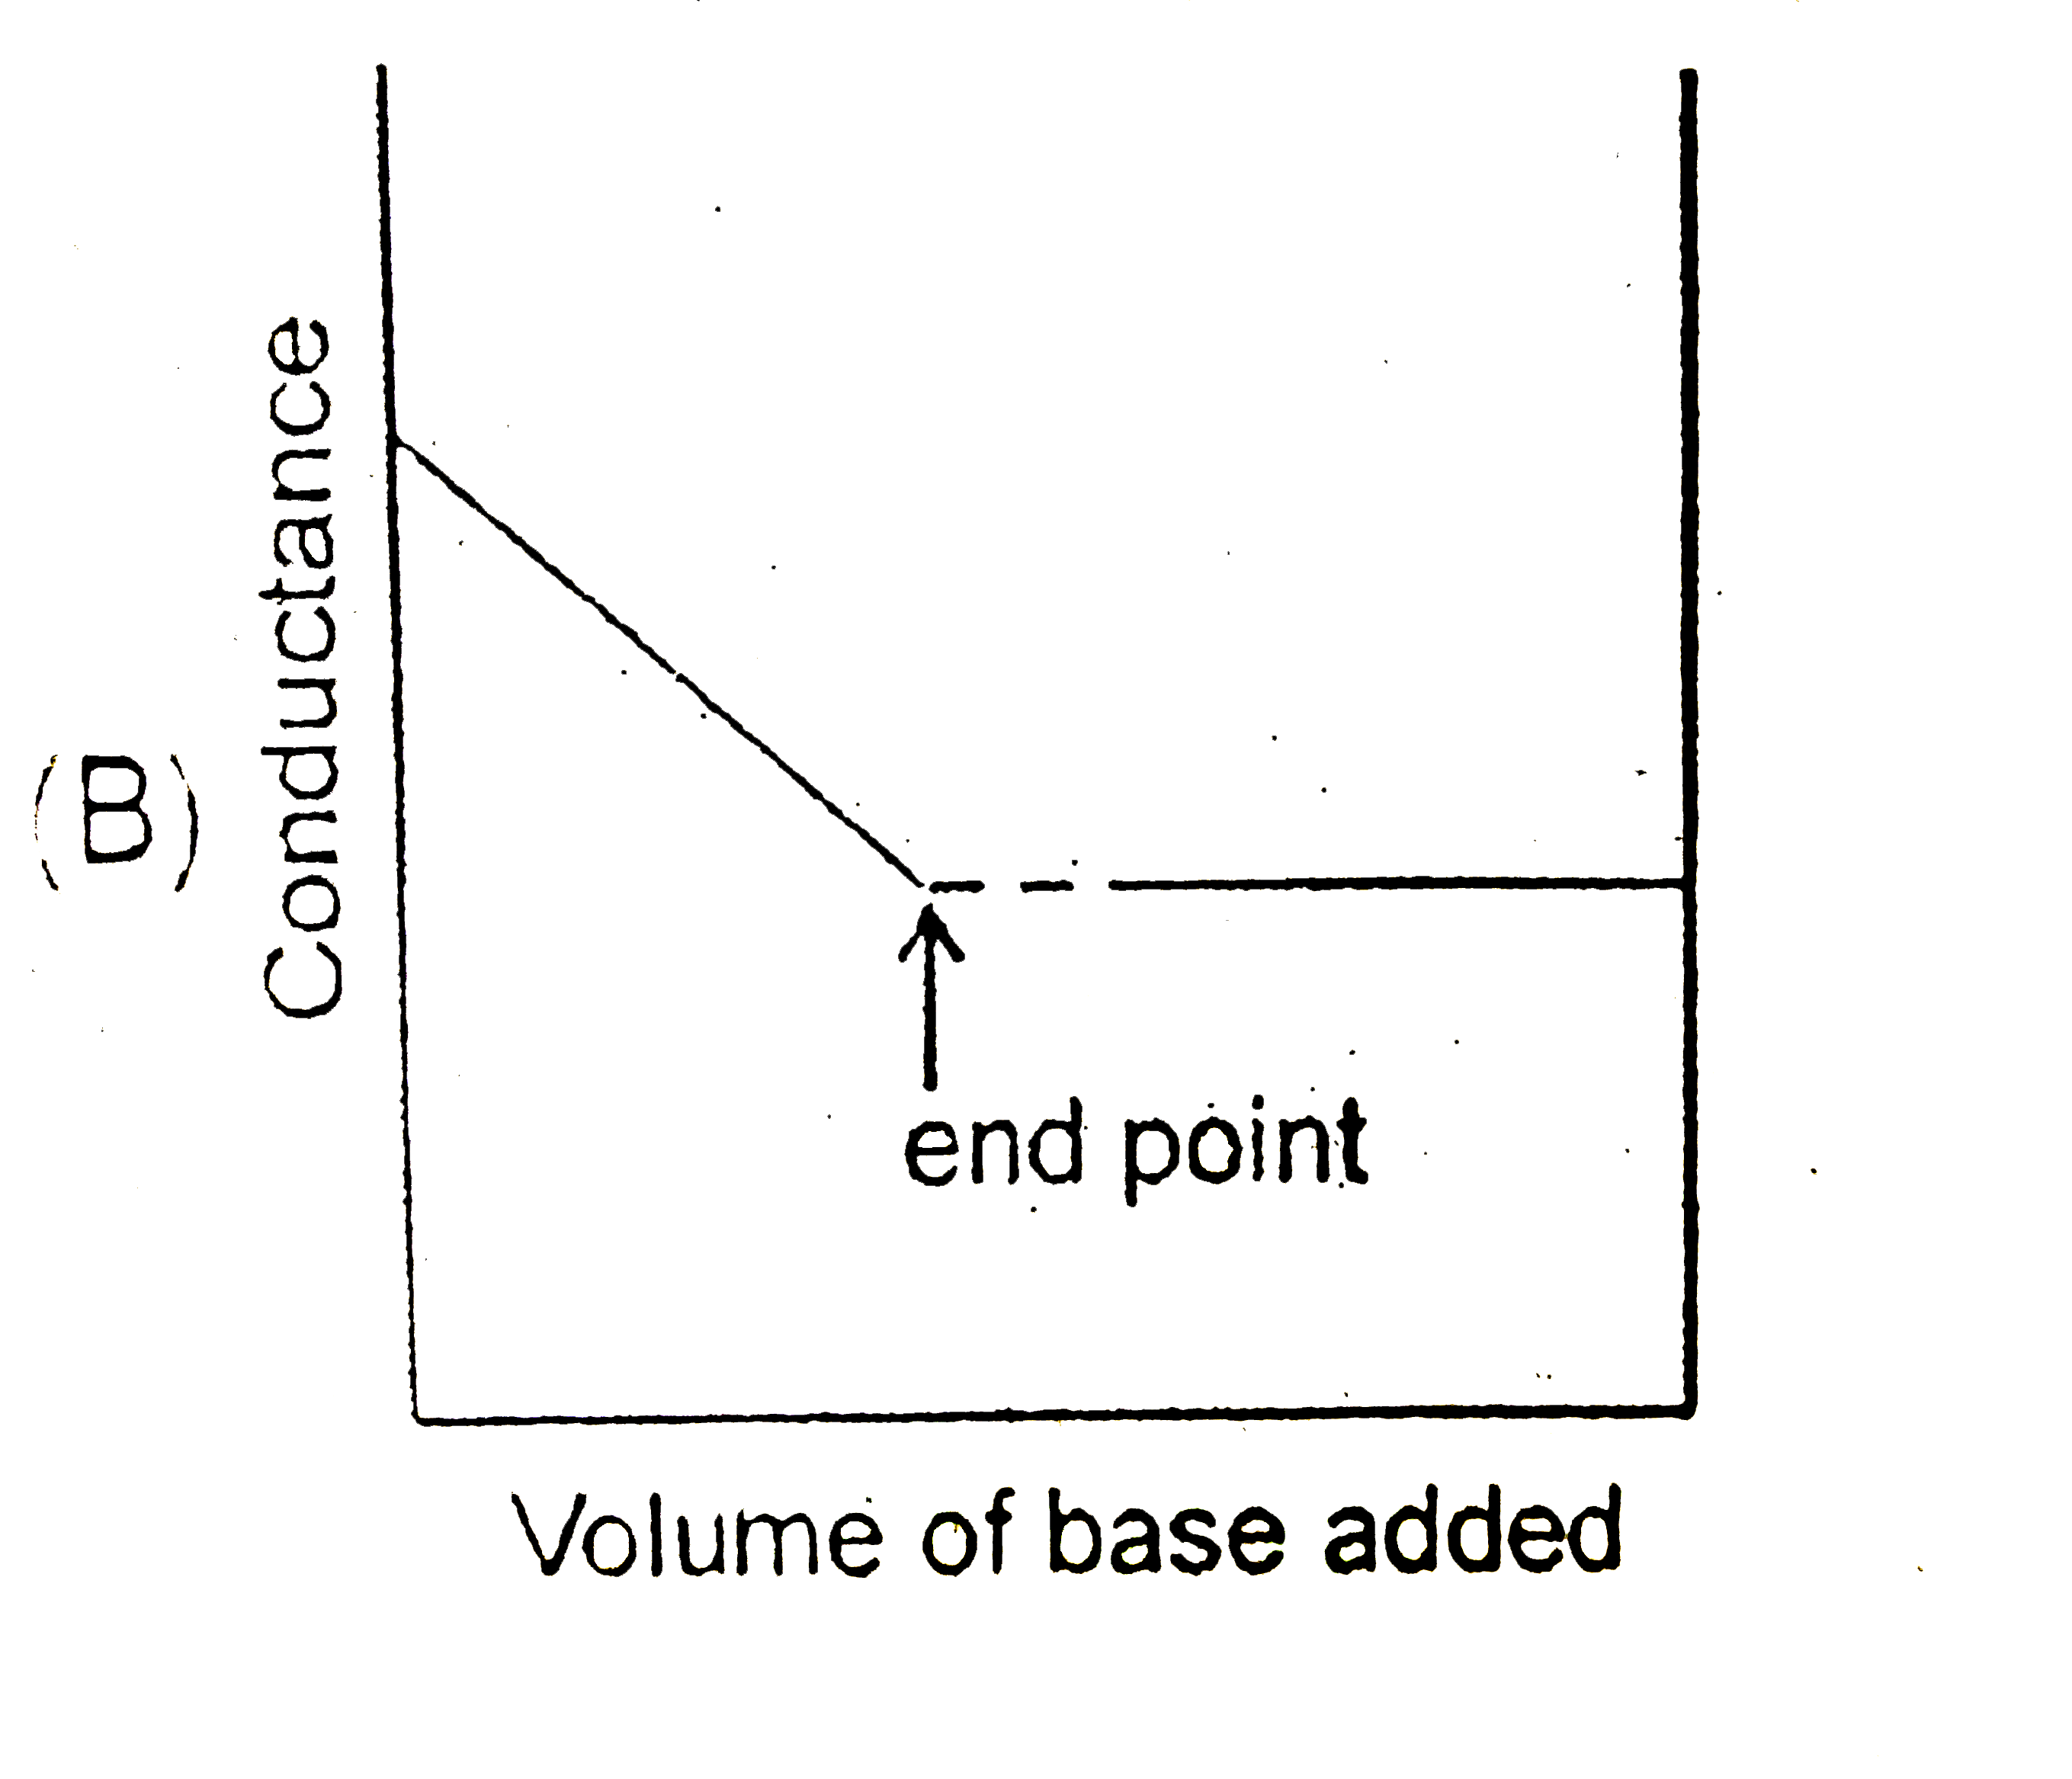
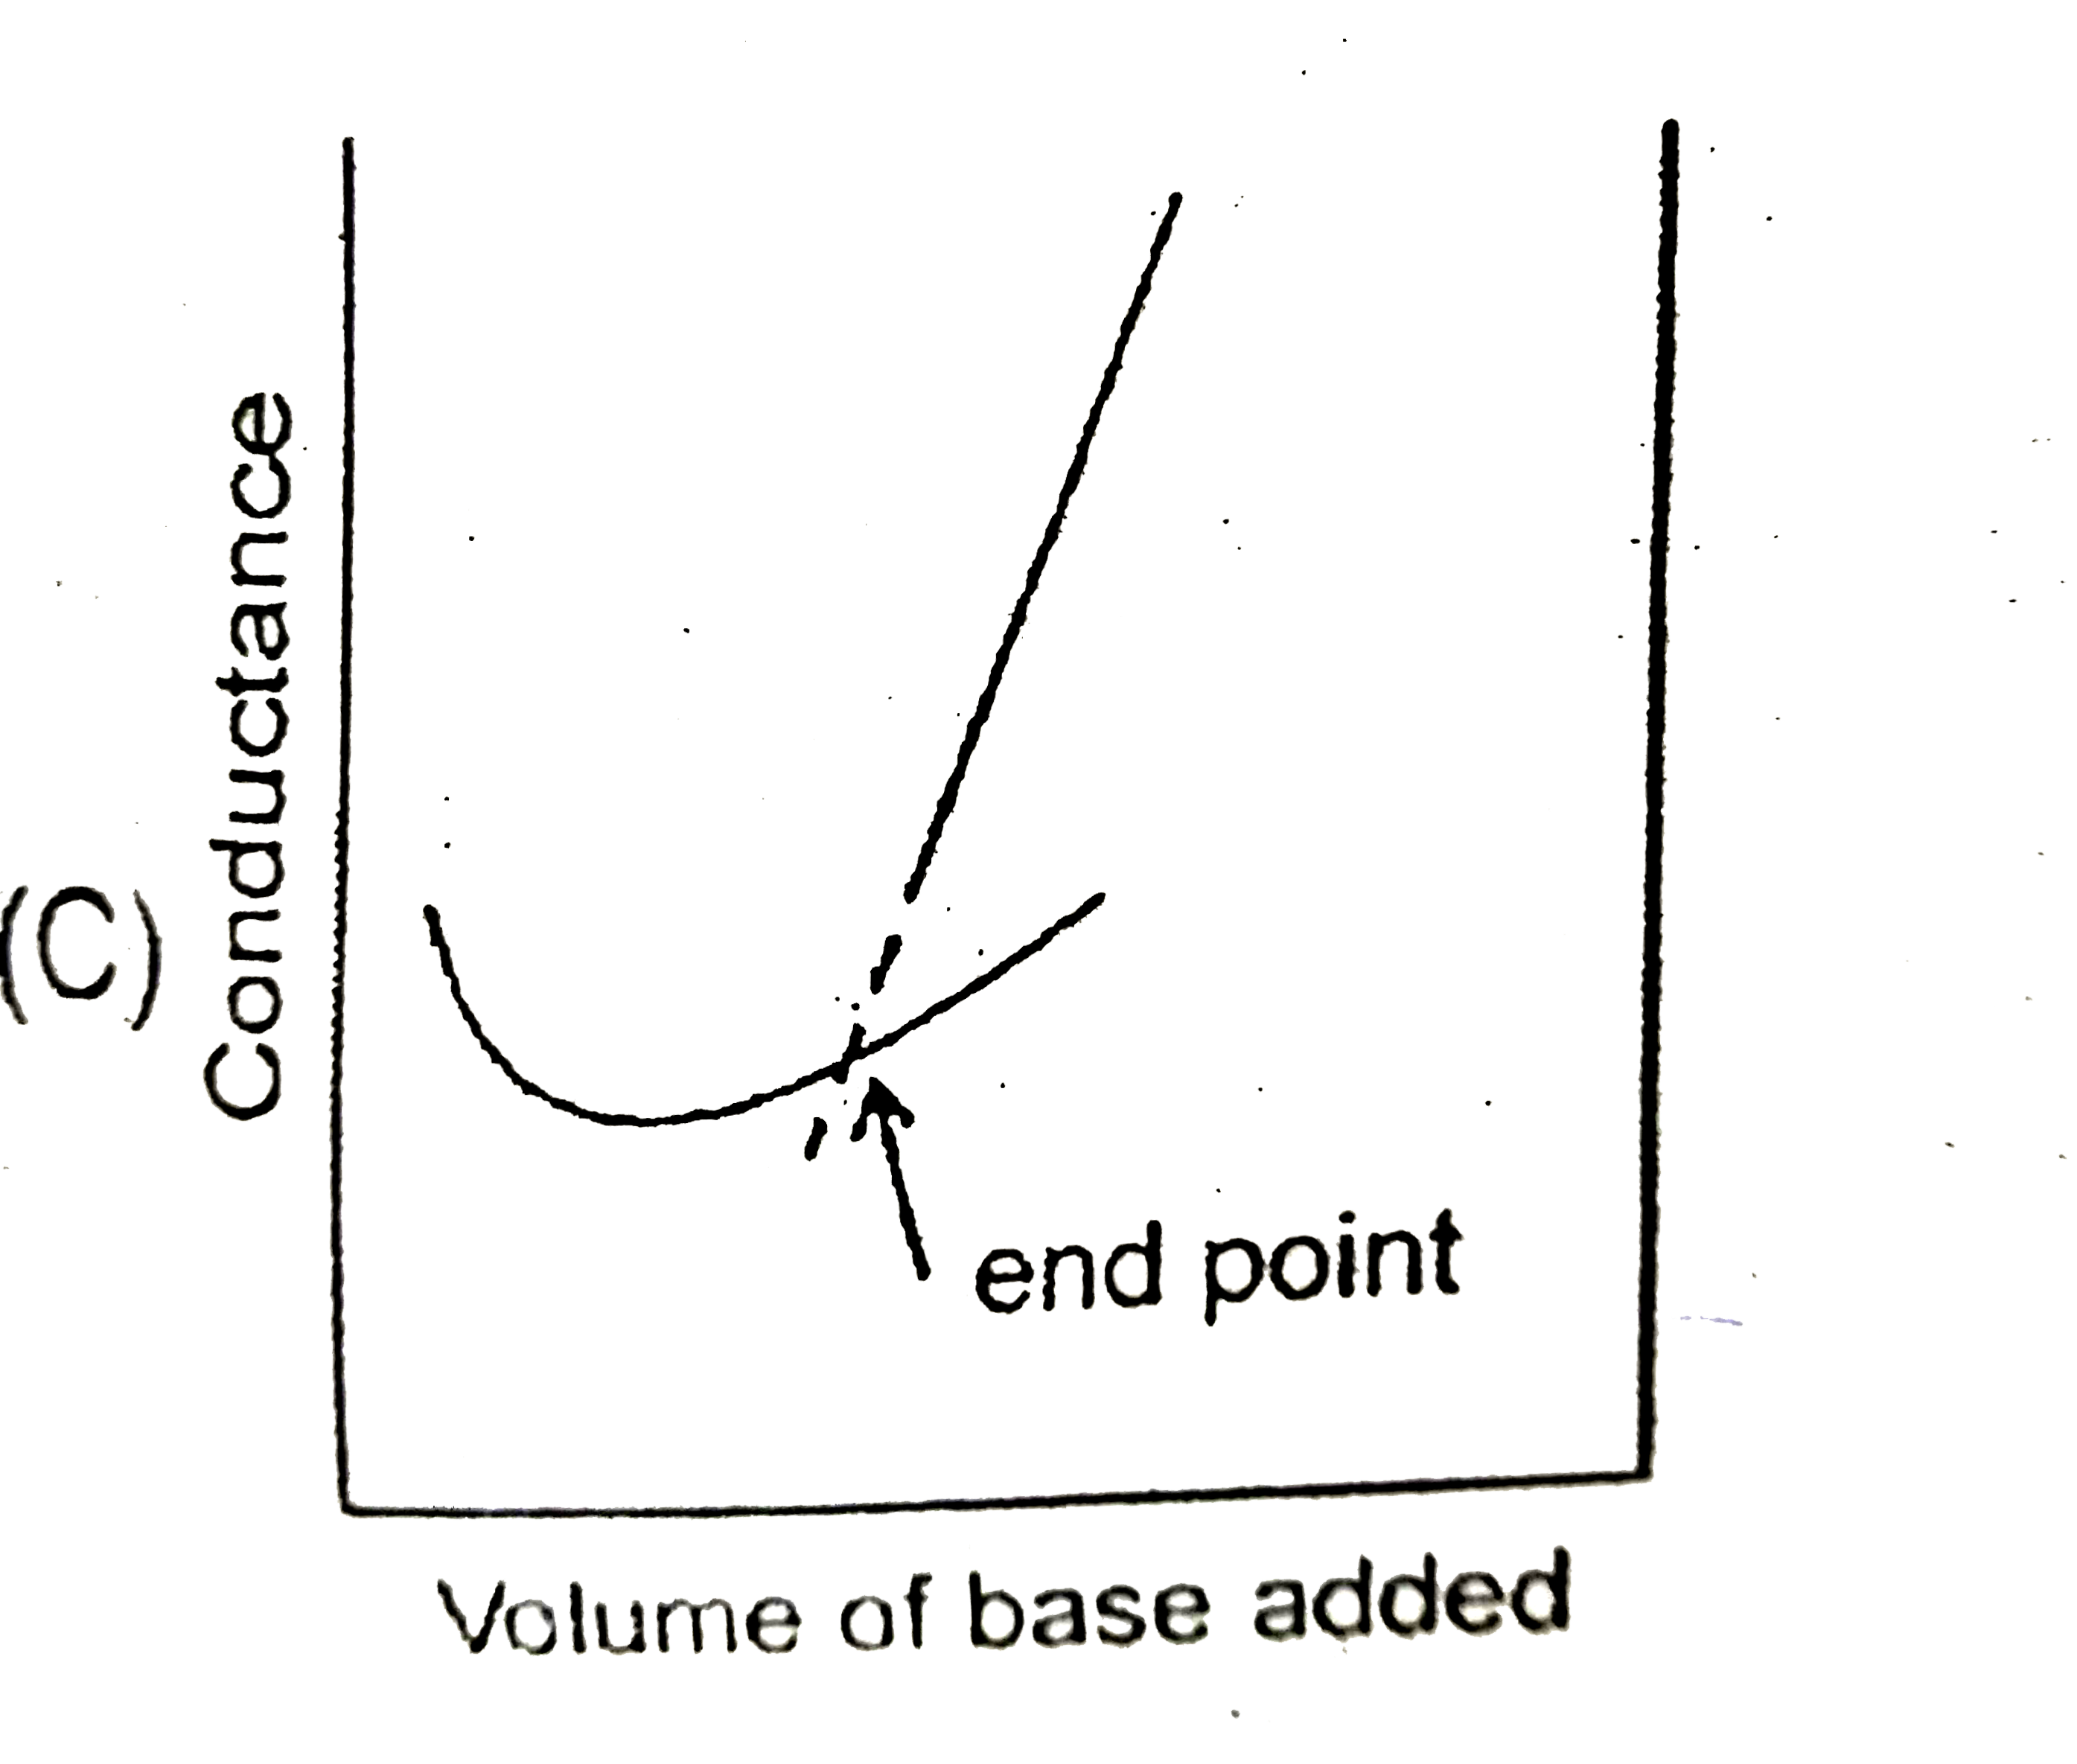
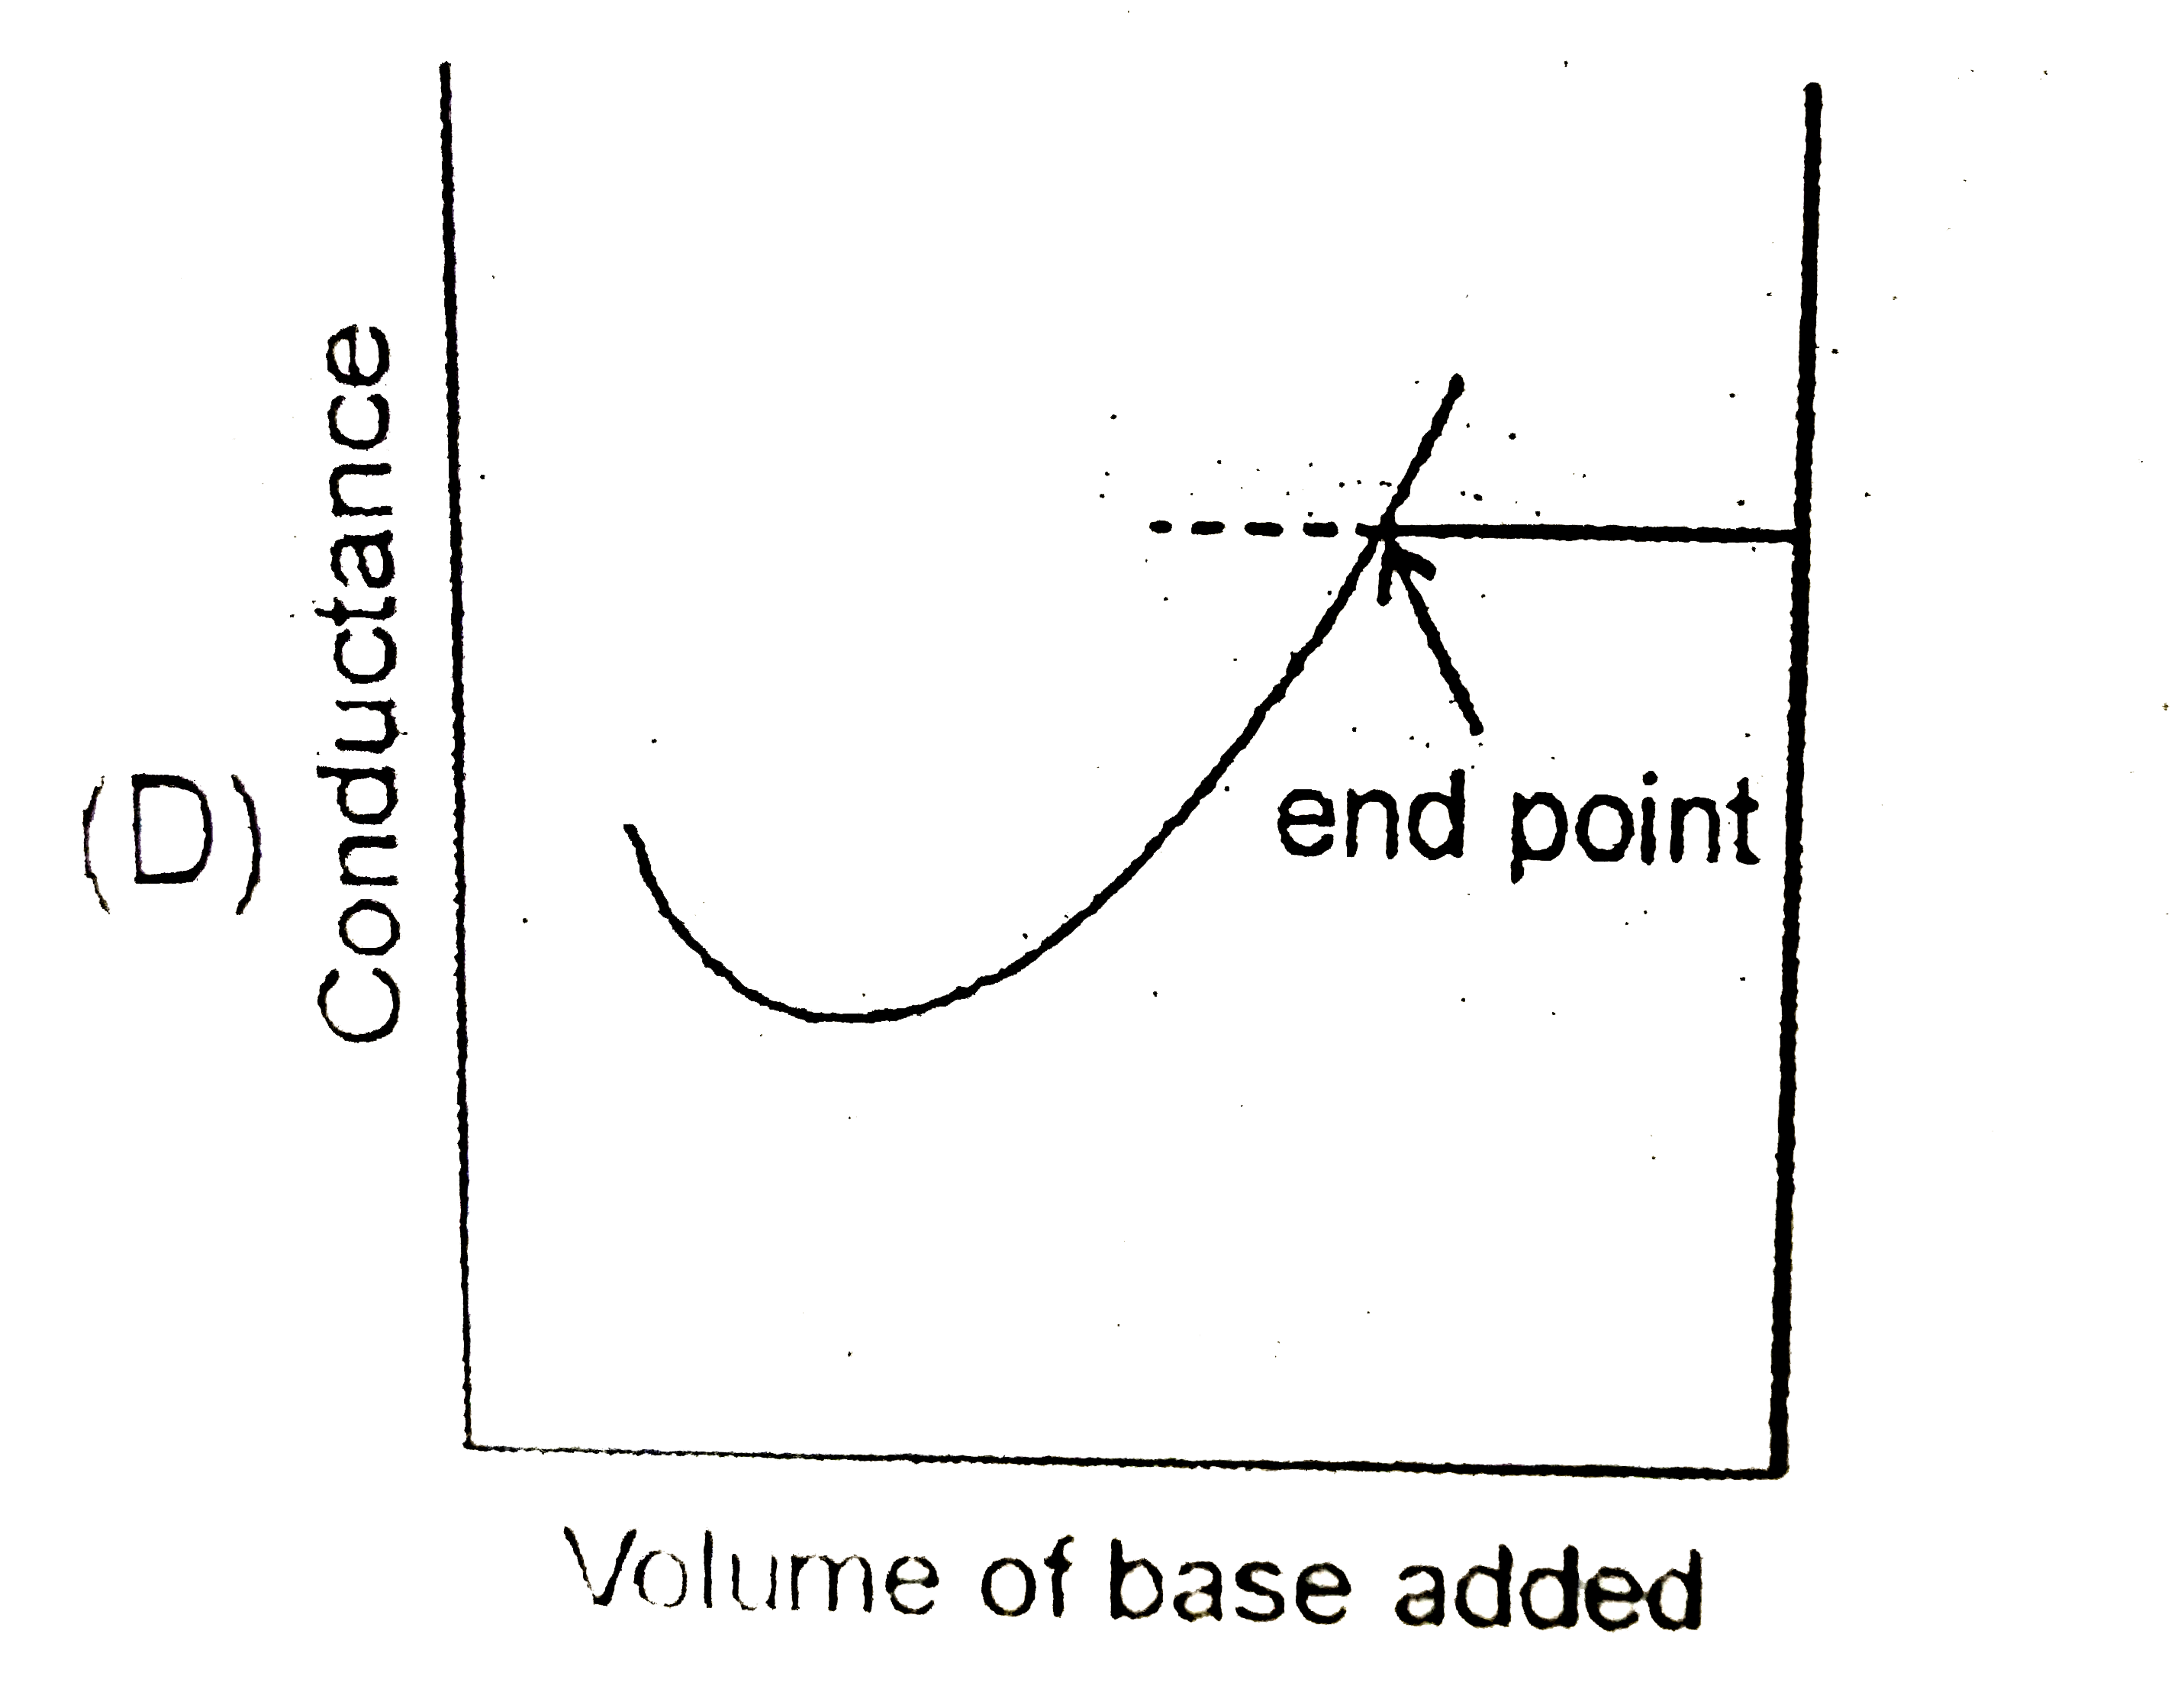
Conductance measurements and be used to detect the end point of acid-base titrations. Which of the following plots correctly represents the end point of the titration of strong acid and a strong base?


The correct Answer is:A
To solve the question regarding the conductance measurements in acid-base titrations, we will analyze the behavior of conductance during the titration of a strong acid with a strong base.
1. Understanding Conductance in Titration:
- Conductance is a measure of how well a solution can conduct electricity, which is influenced by the concentration of ions in the solution.
- In an acid-base titration, we start with a strong acid (which has a high concentration of H⁺ ions) and add a strong base (which provides OH⁻ ions).
2. Initial Conductance:
- Initially, the conductance of the solution is high due to the presence of a large number of H⁺ ions from the strong acid.
3. Neutralization Reaction:
- As we begin to add the strong base, the H⁺ ions react with OH⁻ ions to form water (H₂O). This neutralization reaction decreases the concentration of free ions in the solution.
- As the neutralization progresses, the conductance of the solution decreases because the number of H⁺ ions decreases.
4. Point of Lowest Conductance:
- The conductance will continue to decrease until we reach the equivalence point, where all the H⁺ ions have been neutralized by OH⁻ ions. At this point, the solution has the lowest conductance.
5. Post Equivalence Point:
- After the equivalence point, if we continue to add more base, the concentration of OH⁻ ions will increase. This increase in OH⁻ ions leads to an increase in conductance.
- Therefore, after reaching the lowest point, the conductance begins to rise again.
6. Plot Representation:
- The plot of conductance against the volume of titrant (strong base) added will show a decrease in conductance until the equivalence point is reached, followed by an increase in conductance after the equivalence point.
- The correct representation of this behavior is a graph that first decreases to a minimum and then rises, which corresponds to option A.
Final Answer:
The correct plot that represents the end point of the titration of a strong acid and a strong base is option A.
- Conductance is a measure of how well a solution can conduct electricity, which is influenced by the concentration of ions in the solution.
- In an acid-base titration, we start with a strong acid (which has a high concentration of H⁺ ions) and add a strong base (which provides OH⁻ ions).
- Initially, the conductance of the solution is high due to the presence of a large number of H⁺ ions from the strong acid.
- As we begin to add the strong base, the H⁺ ions react with OH⁻ ions to form water (H₂O). This neutralization reaction decreases the concentration of free ions in the solution.
- As the neutralization progresses, the conductance of the solution decreases because the number of H⁺ ions decreases.
- The conductance will continue to decrease until we reach the equivalence point, where all the H⁺ ions have been neutralized by OH⁻ ions. At this point, the solution has the lowest conductance.
- After the equivalence point, if we continue to add more base, the concentration of OH⁻ ions will increase. This increase in OH⁻ ions leads to an increase in conductance.
- Therefore, after reaching the lowest point, the conductance begins to rise again.
- The plot of conductance against the volume of titrant (strong base) added will show a decrease in conductance until the equivalence point is reached, followed by an increase in conductance after the equivalence point.
- The correct representation of this behavior is a graph that first decreases to a minimum and then rises, which corresponds to option A.
The correct plot that represents the end point of the titration of a strong acid and a strong base is option A.
Topper's Solved these Questions
- BOOK - RESONANCE ENGLISHCHAPTER - ELECTROCHEMISRYEXERCISE - Comprehension30videos
ELECTROCHEMISRY
- BOOK - RESONANCE ENGLISHCHAPTER - ELECTROCHEMISRYEXERCISE - Exercise 37videos
ELECTROCHEMISRY
- BOOK - RESONANCE ENGLISHCHAPTER - ELECTROCHEMISRYEXERCISE - Subjective Questions14videos
ELECTROCHEMISRY
- BOOK - RESONANCE ENGLISHCHAPTER - ELECTRO CHEMISTRYEXERCISE - PHYSICAL CHEMITRY (ELECTROCHEMISTRY)53videos
ELECTRO CHEMISTRY
- BOOK - RESONANCE ENGLISHCHAPTER - EQUIVALENT CONCEPT & TITRATIONSEXERCISE - Part -IV22videos
EQUIVALENT CONCEPT & TITRATIONS
Similar Questions
The best indicator for the detection of the end point in the titration of a weak acid and a strong base is
View Solutionwhich of the following plots will obtained for a conductometric titration of strong acid against a weak base?
View SolutionWhich indicator is most commonly used for the titration of a strong acid against a strong base?
View SolutionWhich of the following is strong Lewis base?
View SolutionThe best indicator for detection of end point in titration of a weak acid and a strong base is
View SolutionWhy is heat of neutralisation for a strong acid and strong base constant ?
View SolutionWhich of the following pH curve represent the titration of weak acid and strong base (dotted line show equivalence point)?
View SolutionAcetic acid is titrated with NaOH solution. Which of the following statement is correct for this titration?
View SolutionWhich of the following is strong Lewis acid?
View SolutionWhat are acid -base indicators and how do they indicate the end point of an acid -base titration?
View Solution

