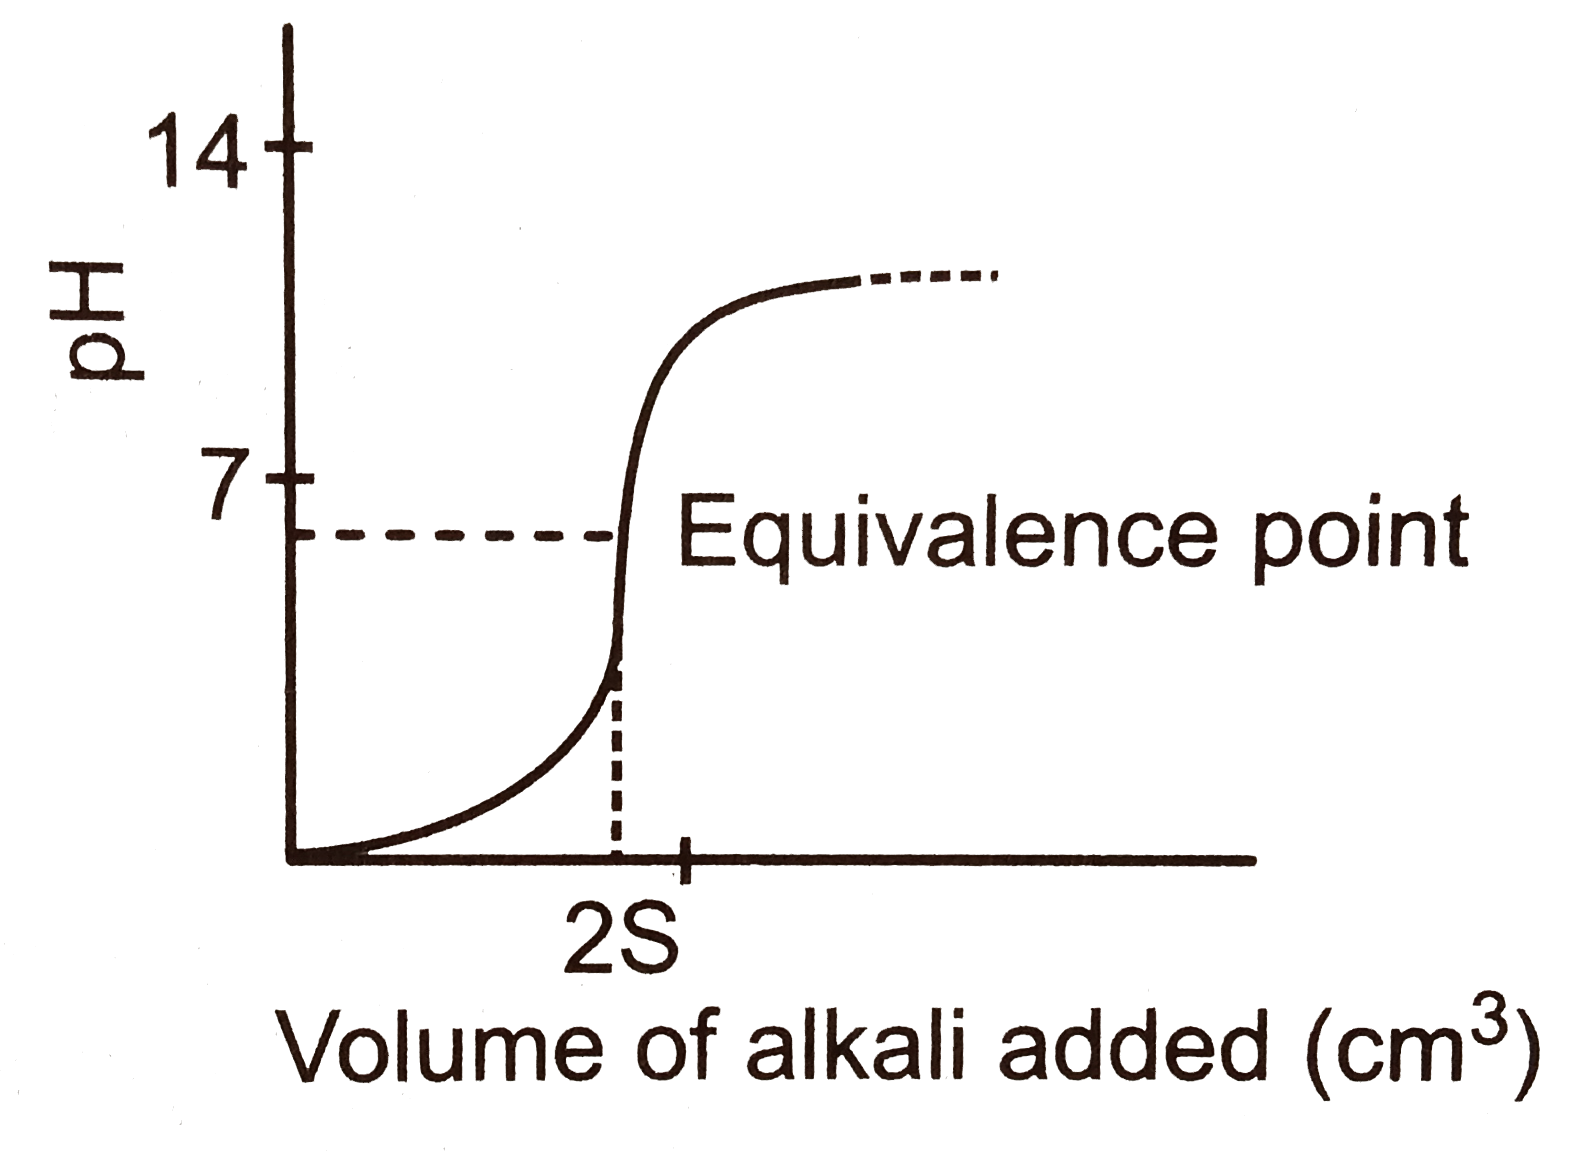
The graph represents the titration curve for :
a.Strong acid and strong base
b.Strong acid and weak base
c.Weak acid and strong base
d.Weak acid and weak base
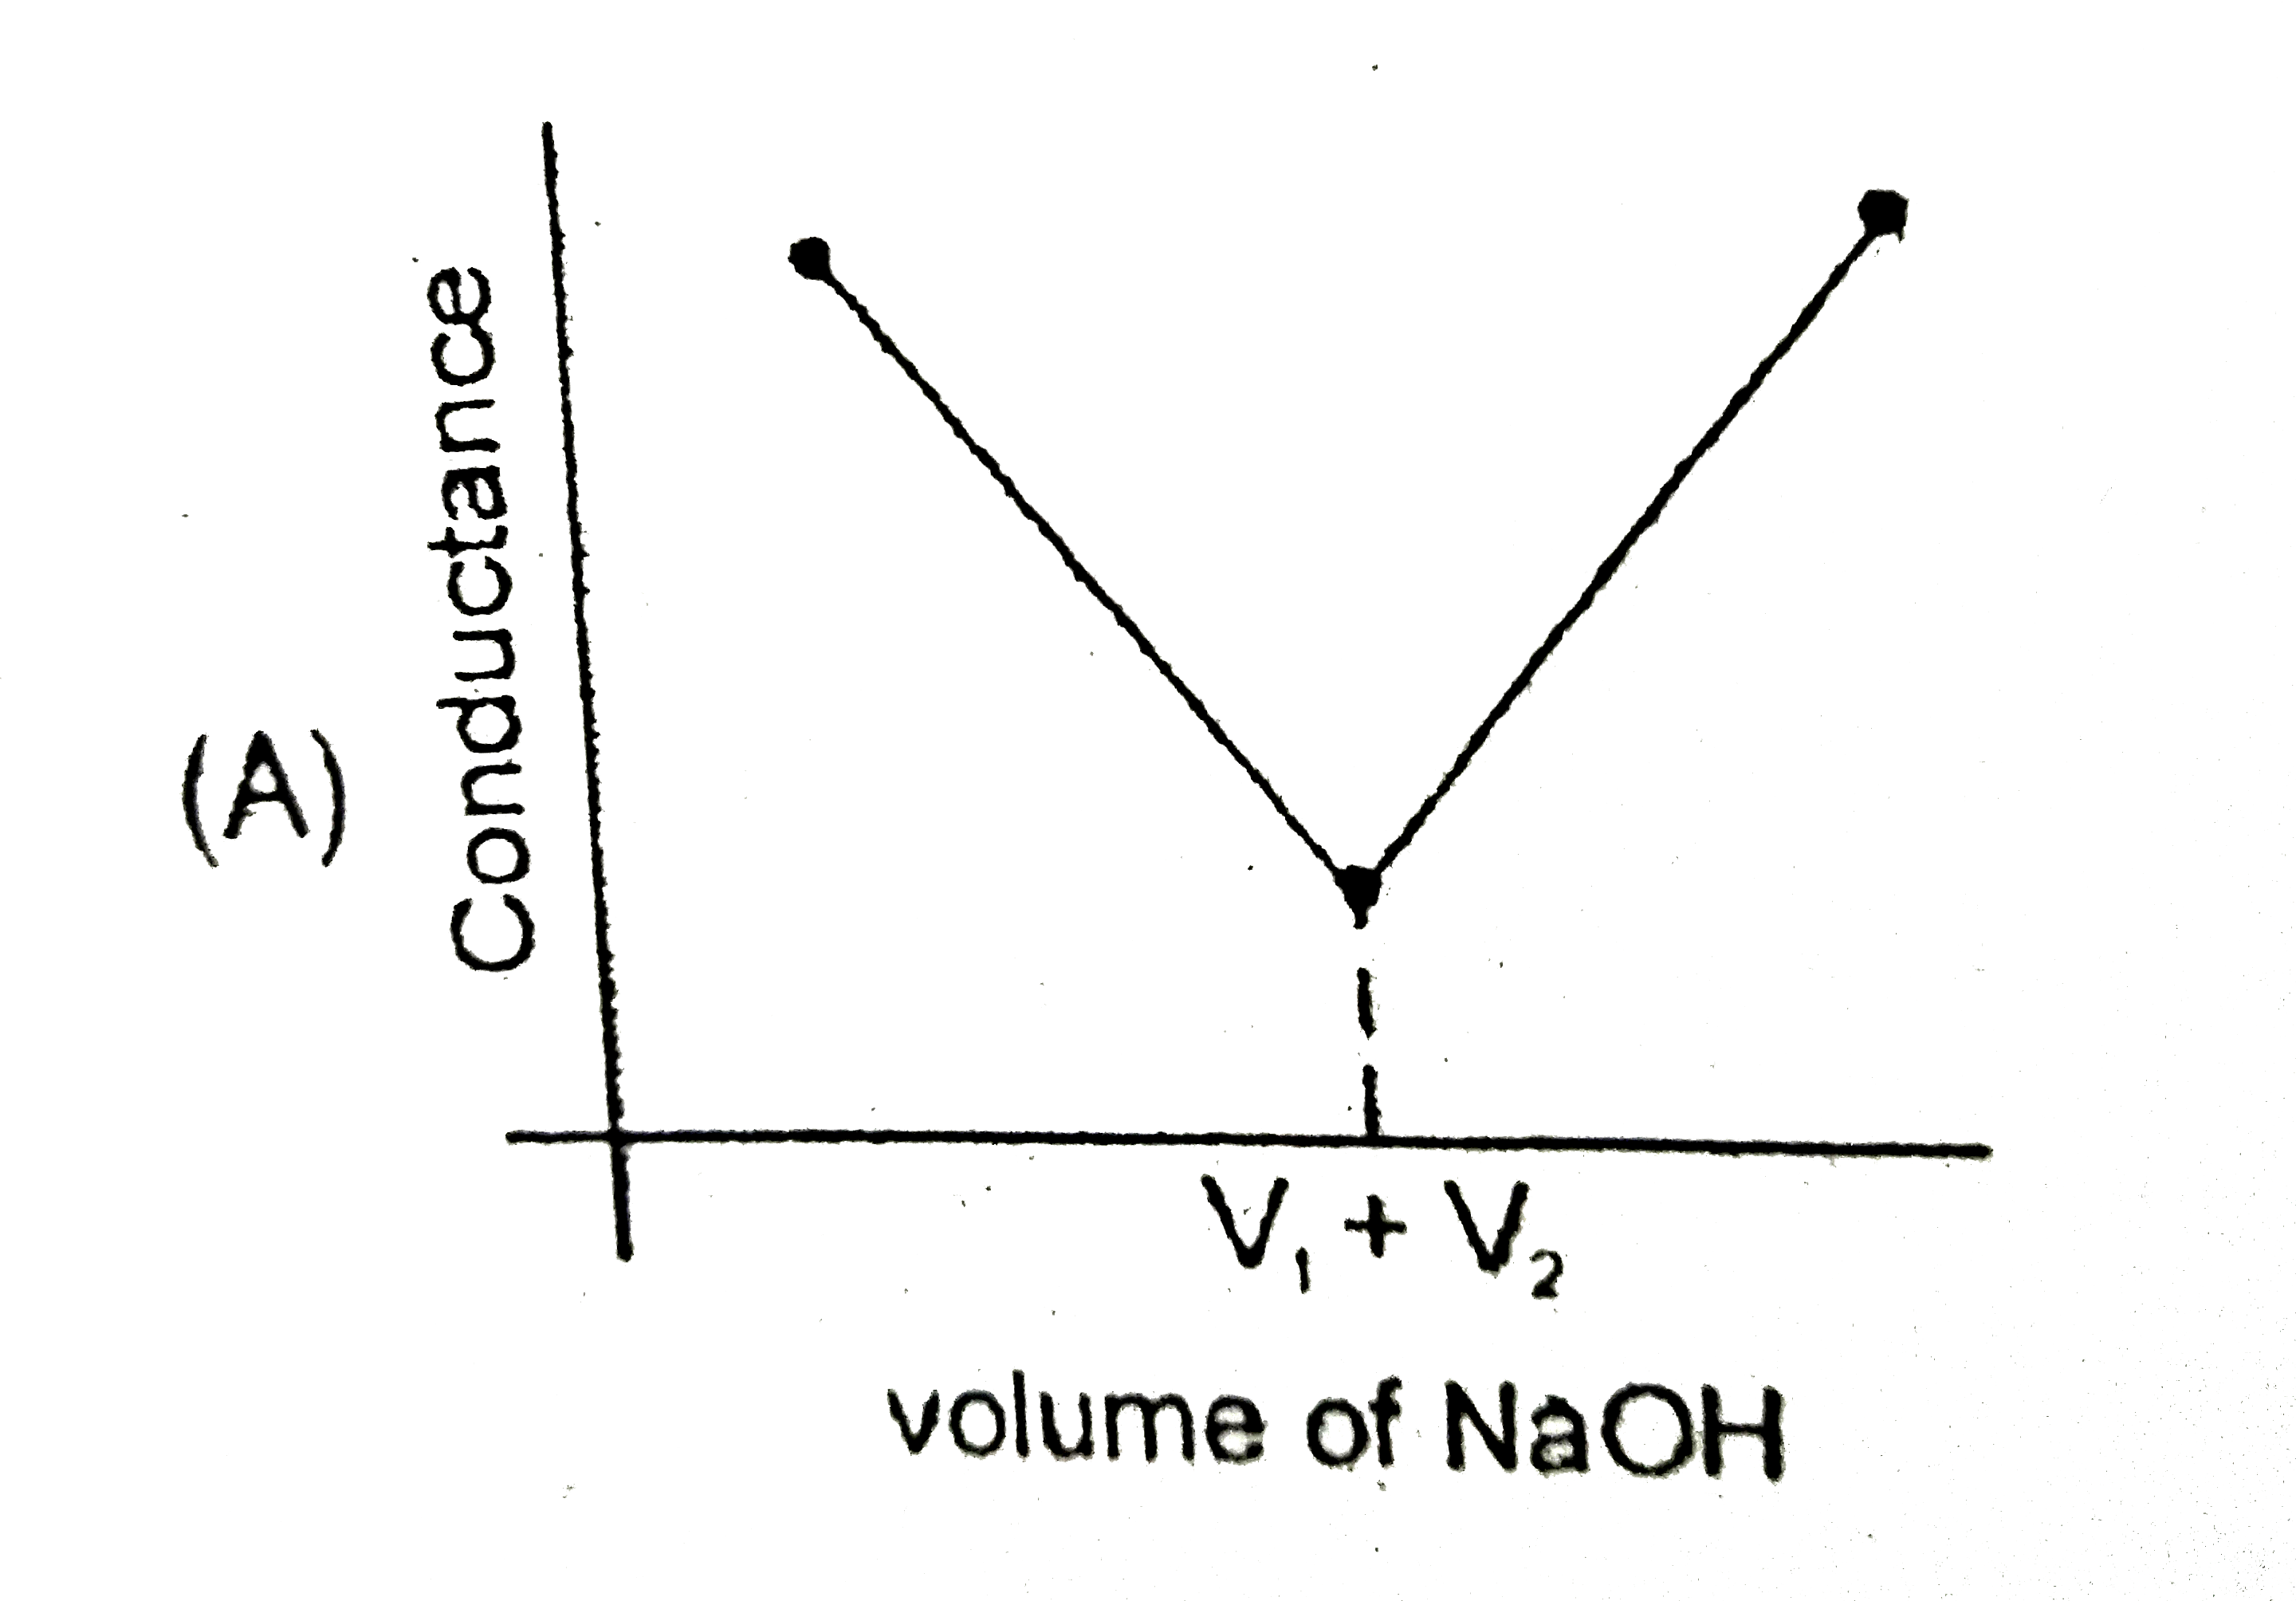
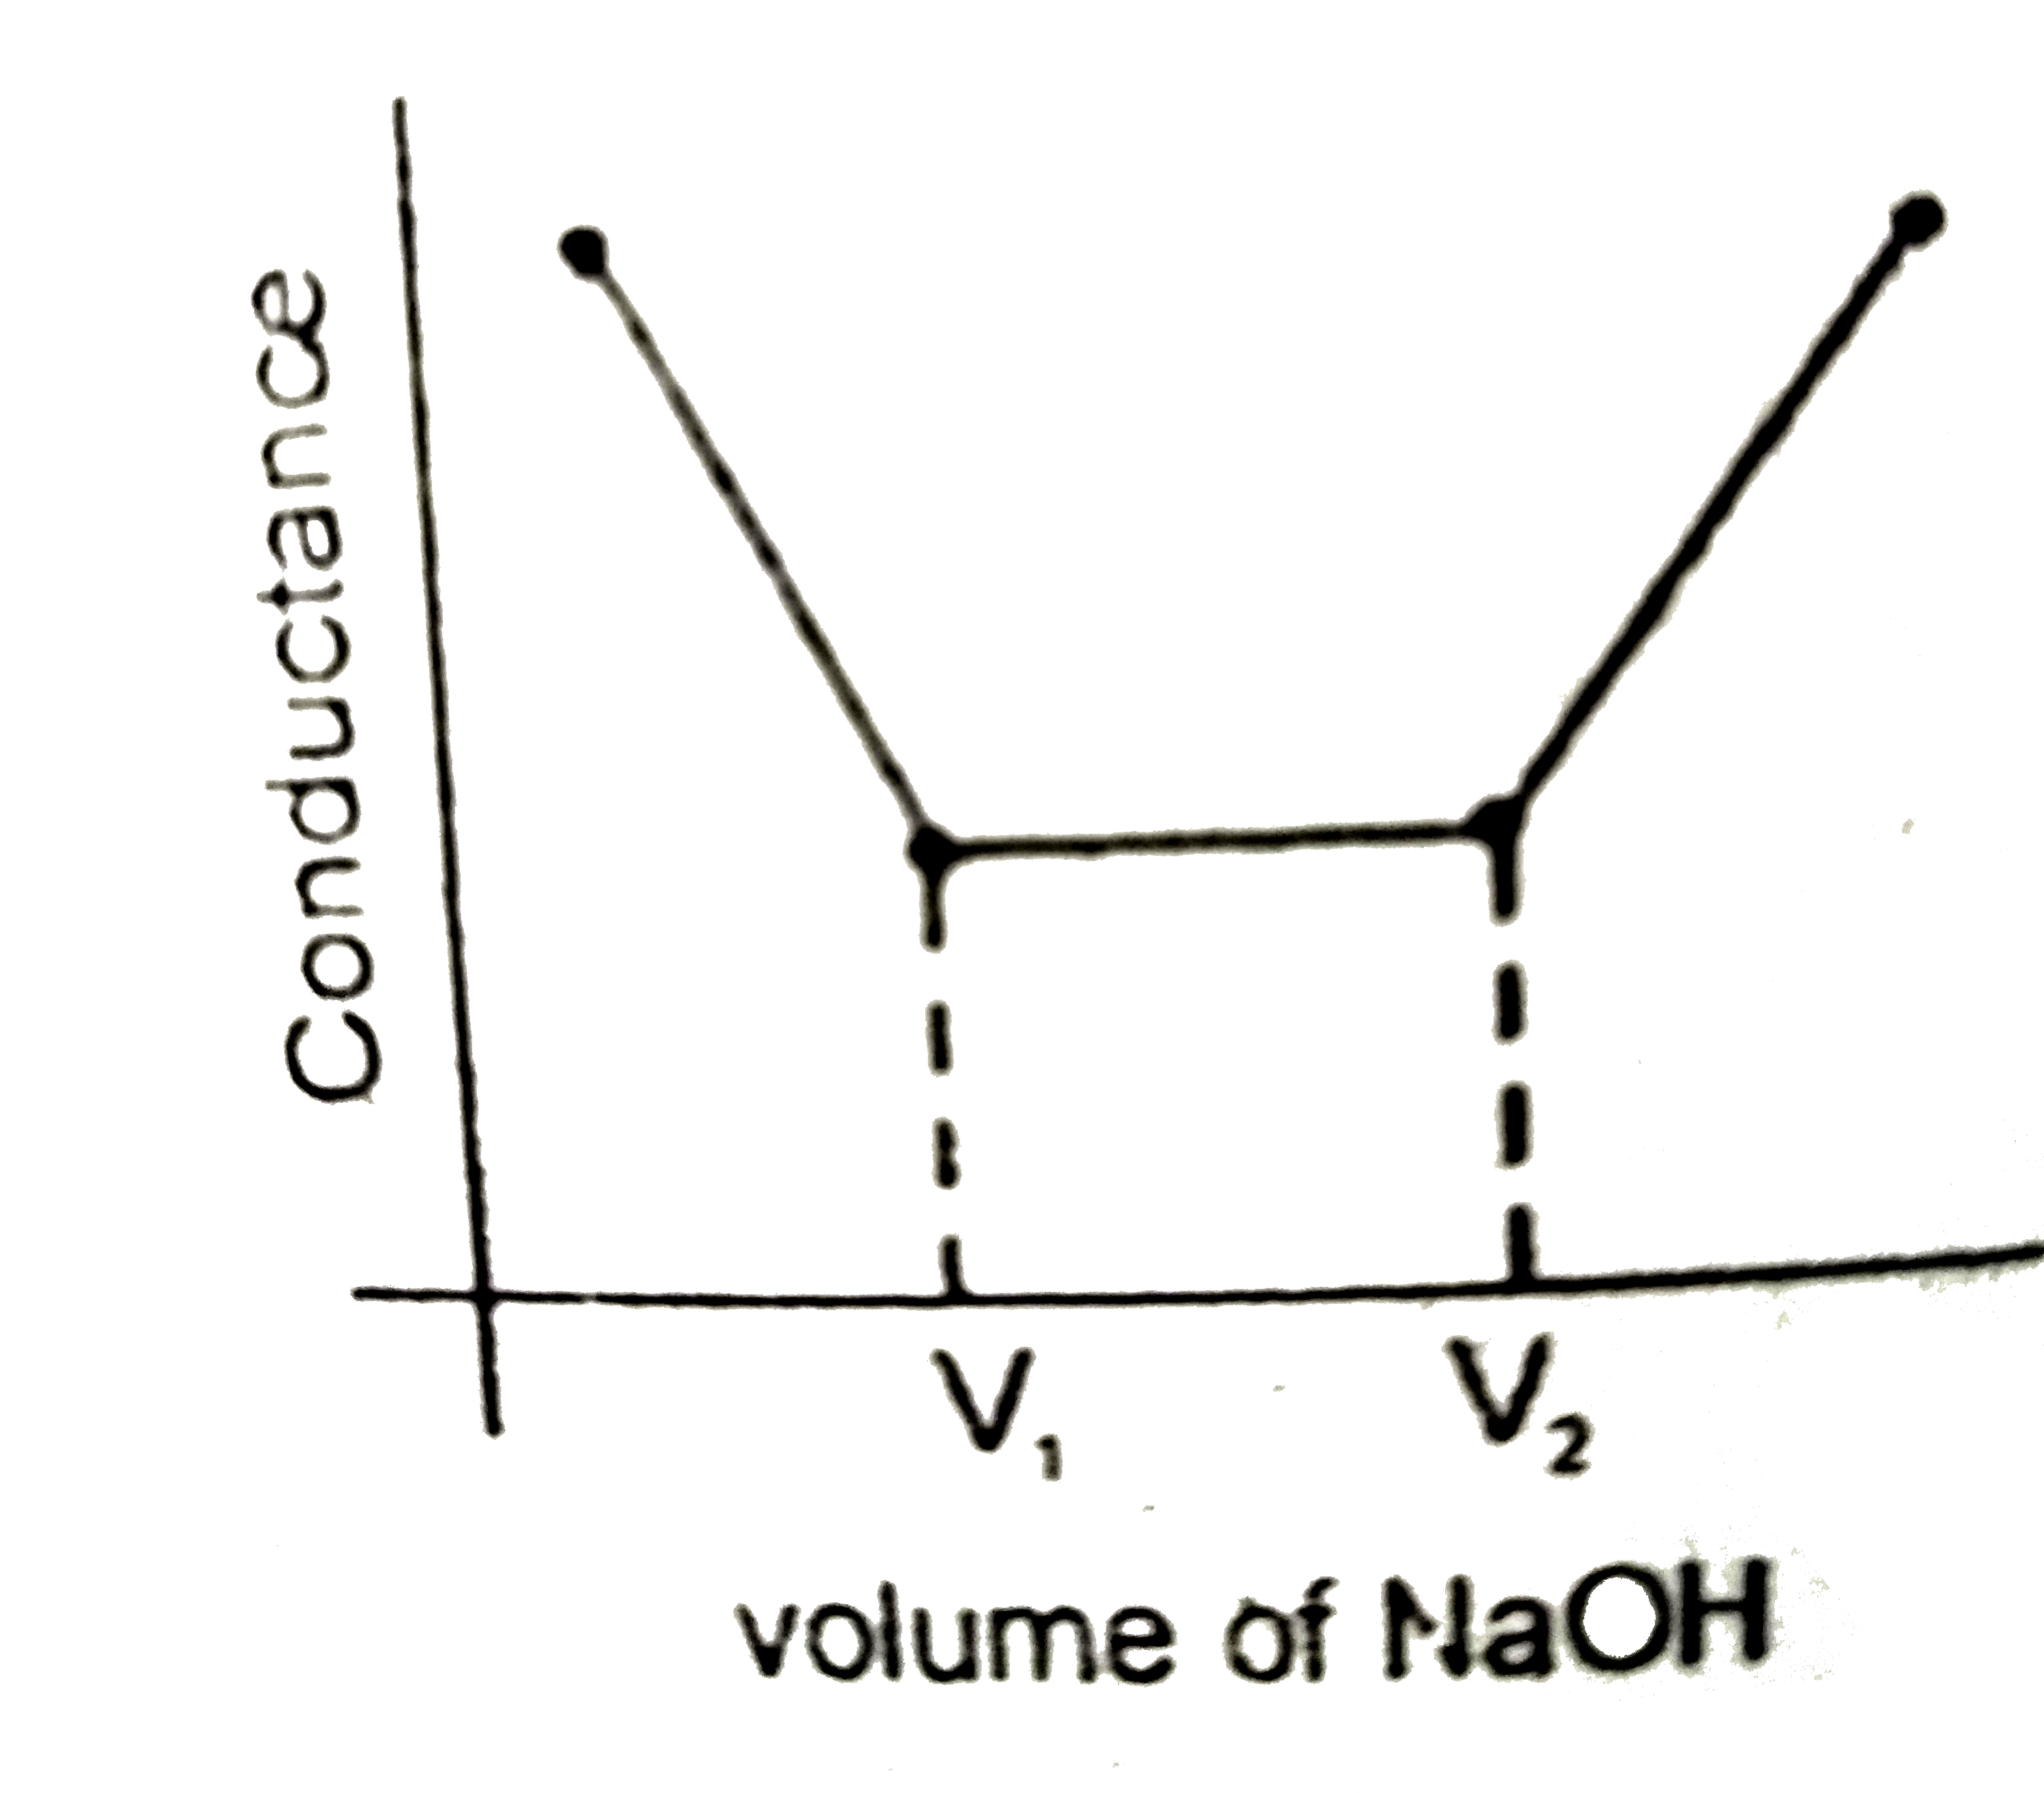
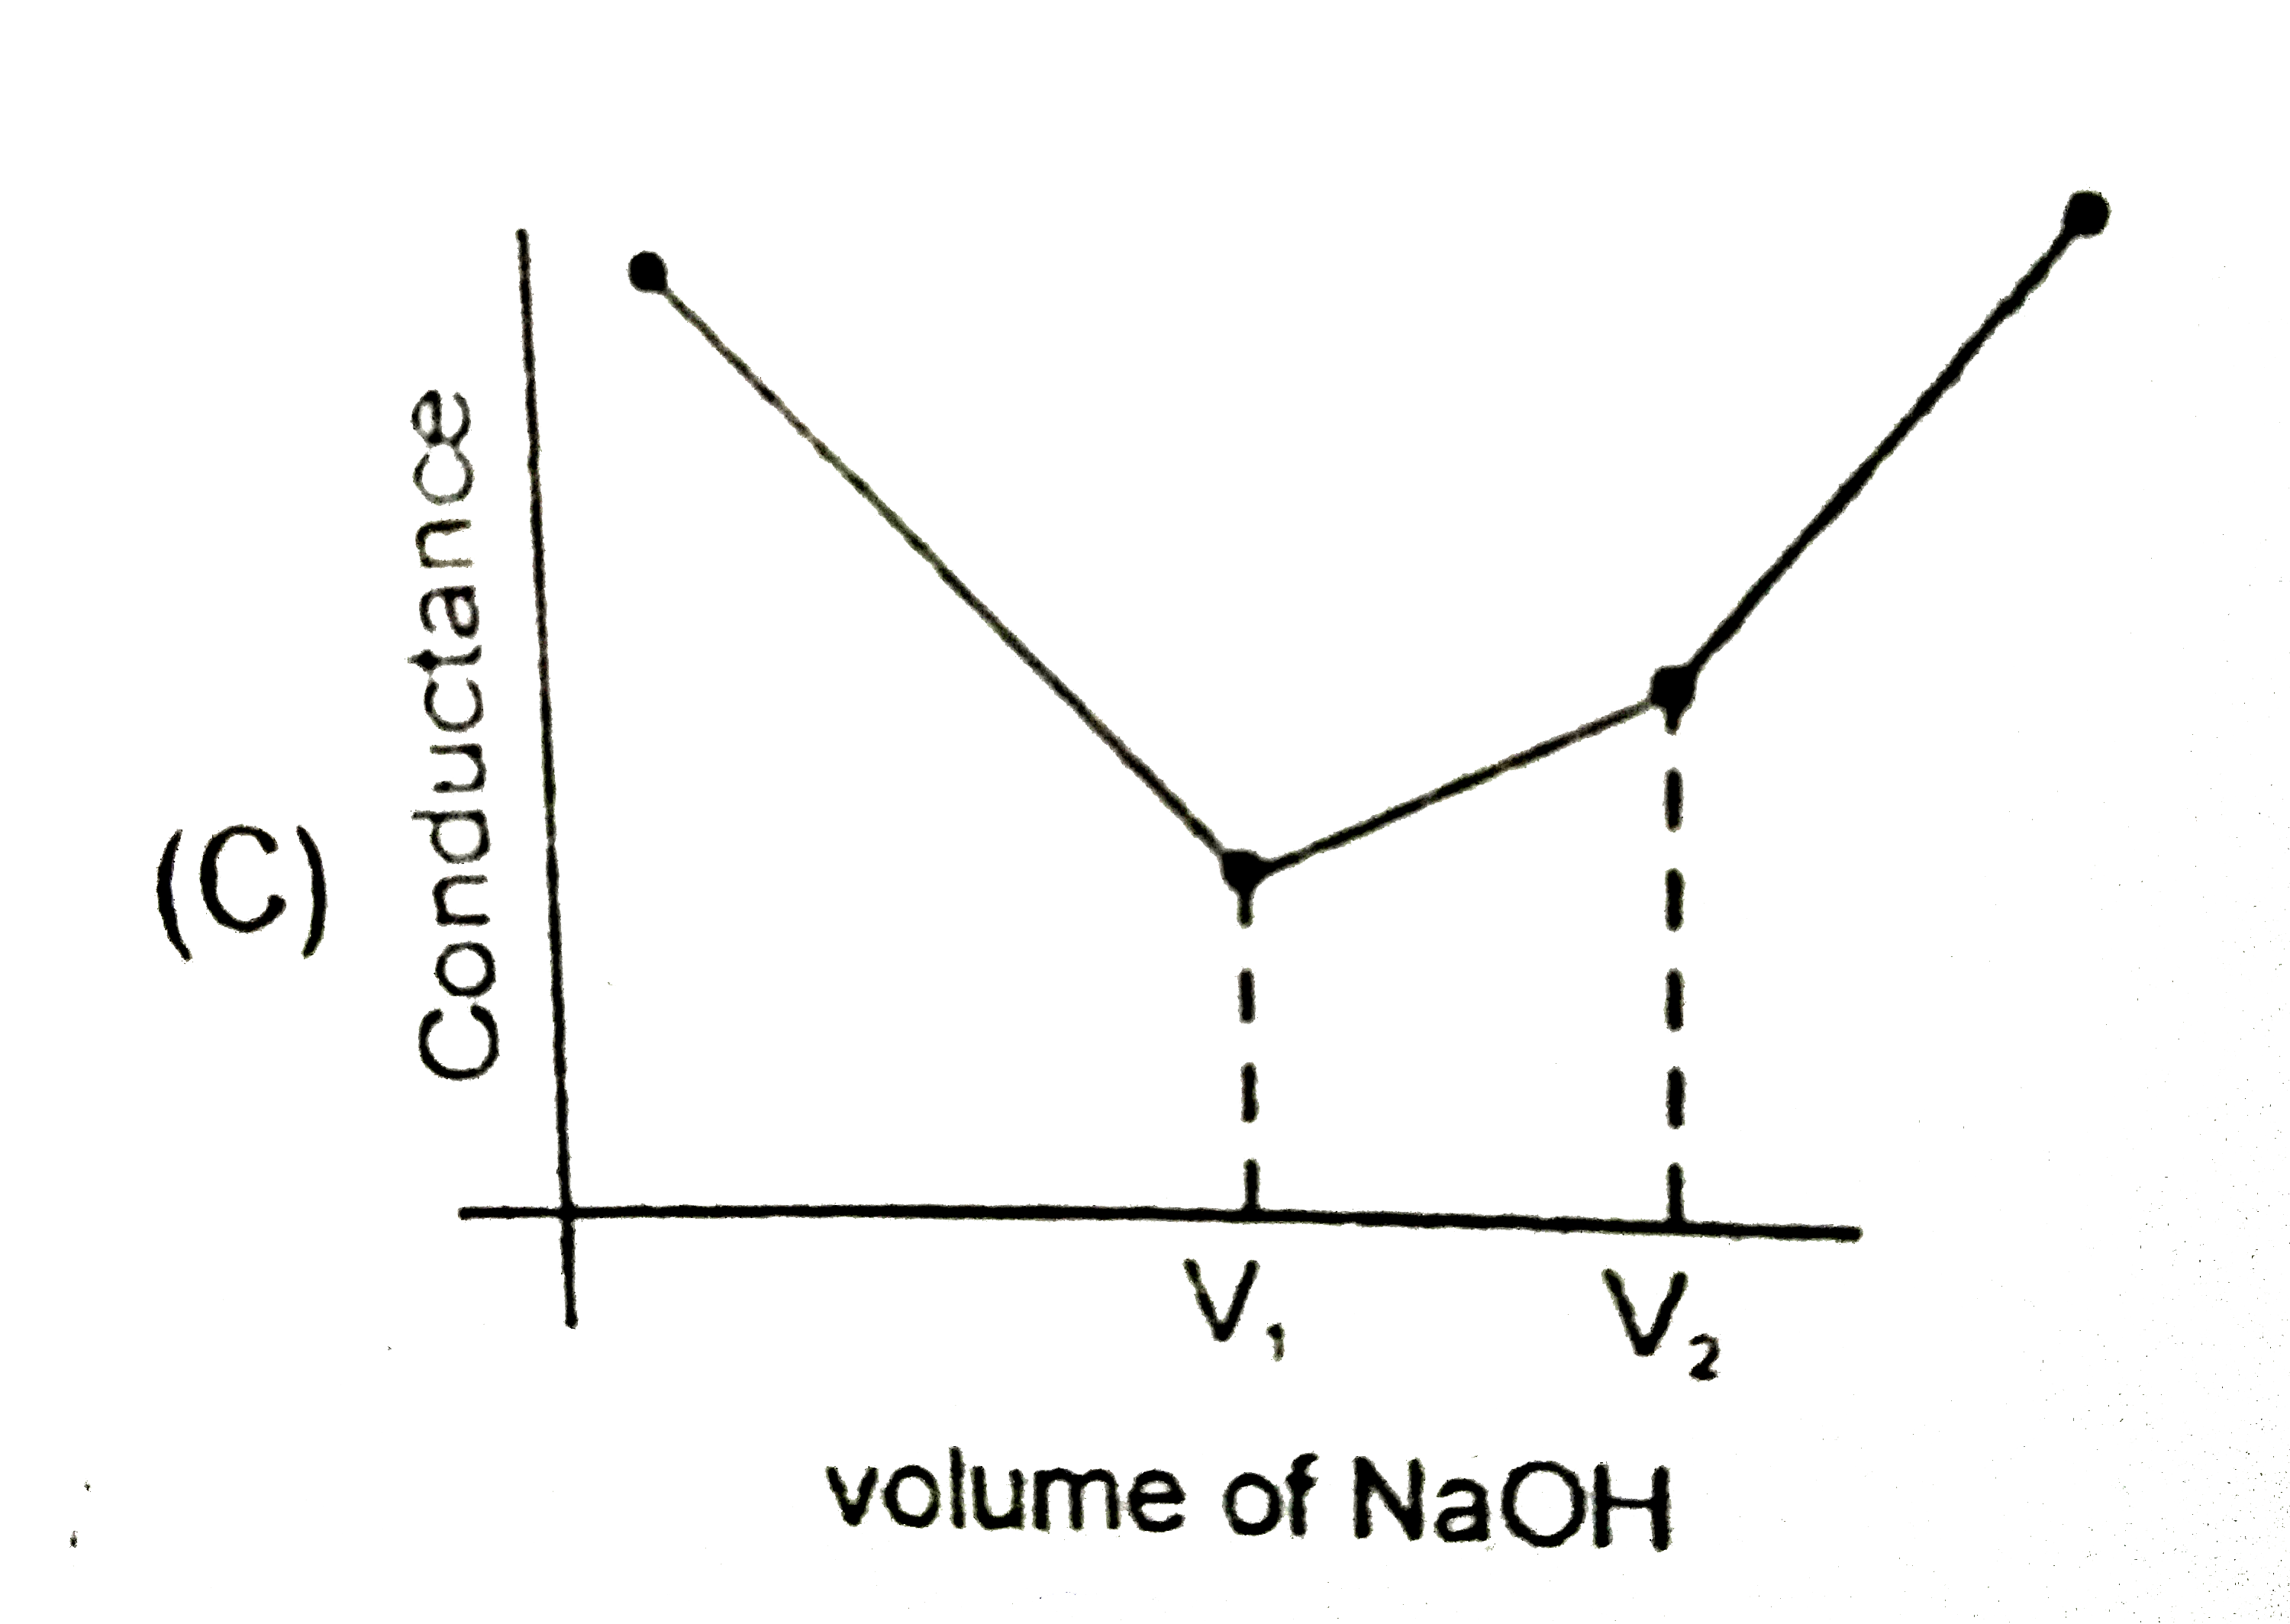
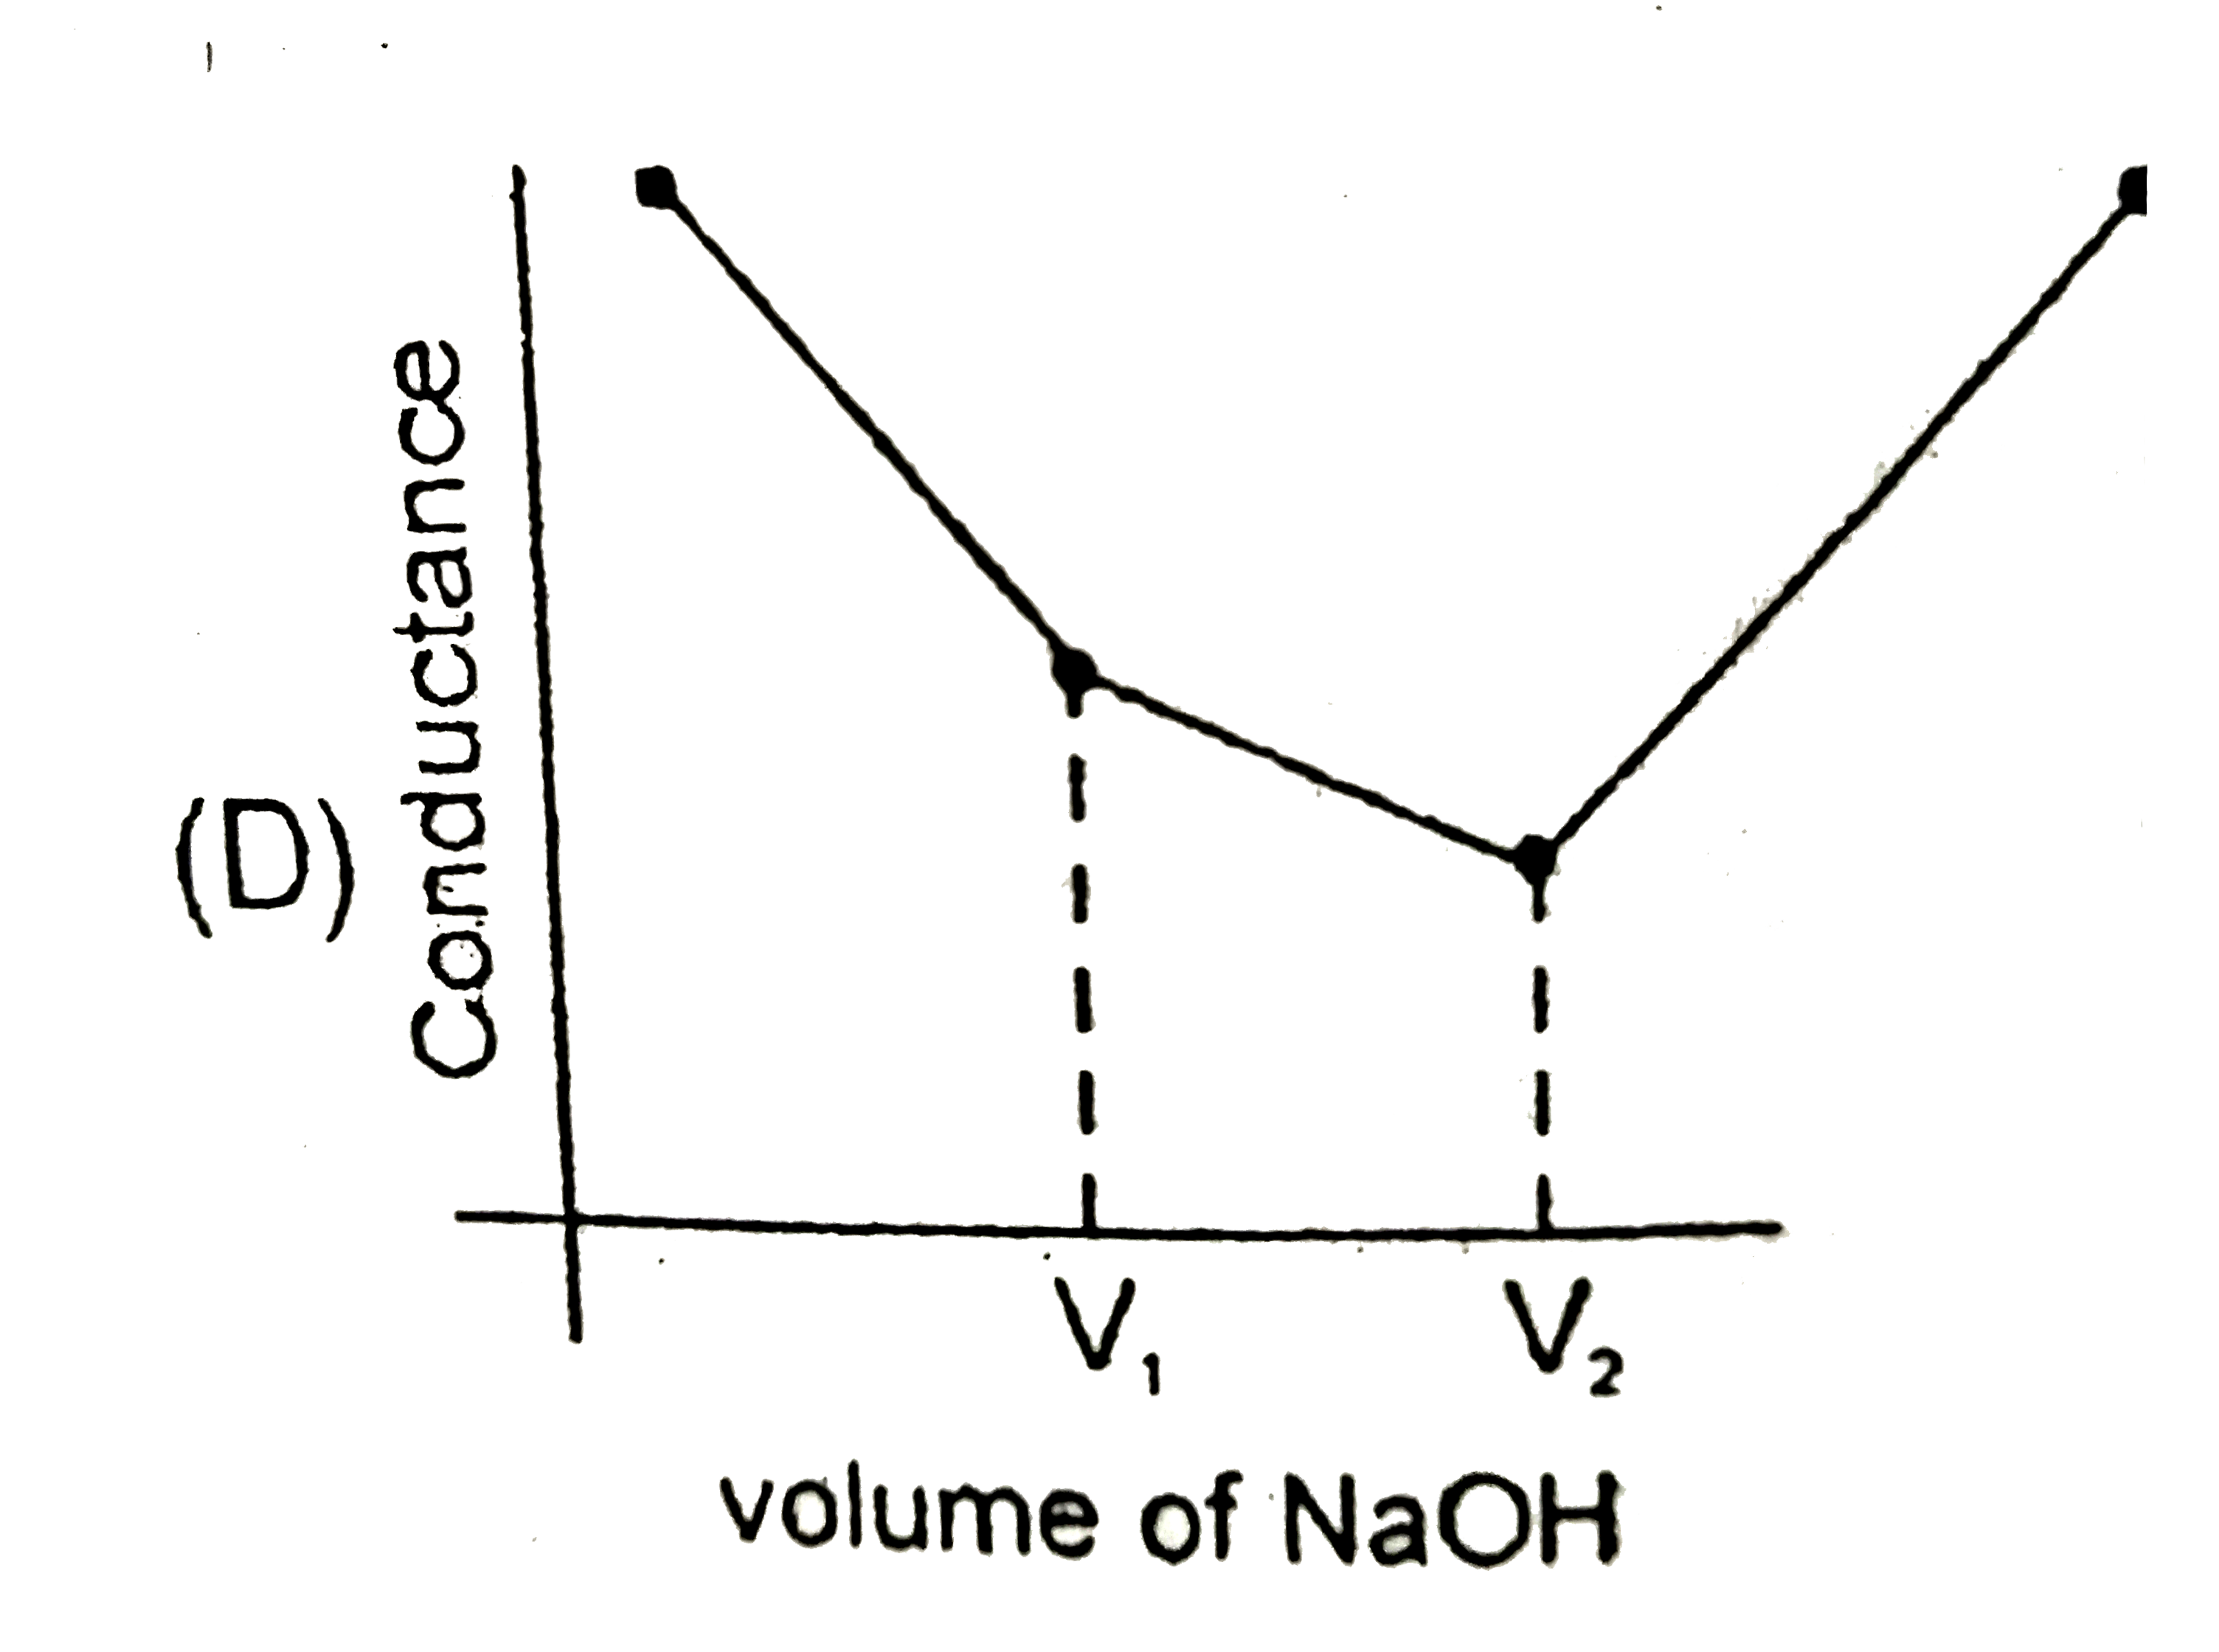
The correct Answer is:C
Step by step video & image solution for The graph represents the titration curve for : a.Strong acid and strong base b.Strong acid and weak base c.Weak acid and strong base d.Weak acid and weak base by Chemistry experts to help you in doubts & scoring excellent marks in Class 12 exams.
Updated on:21/07/2023Topper's Solved these Questions
- ELECTROCHEMISRYBOOK - RESONANCE ENGLISHCHAPTER - ELECTROCHEMISRYEXERCISE - Exercise 3
7 Videos
- ELECTROCHEMISRYBOOK - RESONANCE ENGLISHCHAPTER - ELECTROCHEMISRYEXERCISE - Part 2
23 Videos
- ELECTROCHEMISRYBOOK - RESONANCE ENGLISHCHAPTER - ELECTROCHEMISRYEXERCISE - Objective Questions
41 Videos
- ELECTRO CHEMISTRYBOOK - RESONANCE ENGLISHCHAPTER - ELECTRO CHEMISTRYEXERCISE - PHYSICAL CHEMITRY (ELECTROCHEMISTRY)
53 Videos
- EQUIVALENT CONCEPT & TITRATIONSBOOK - RESONANCE ENGLISHCHAPTER - EQUIVALENT CONCEPT & TITRATIONSEXERCISE - Part -IV
22 Videos
Similar Questions
Give an example of Strong acid and a Weak acid.
View SolutionWhy is heat of neutralisation for a strong acid and strong base constant ?
View SolutionThe heat of neutralization for a strong acid by a strong base is a constant
View SolutionThe heat of neutralisation for strong acid and strong base forming 2 moles of water is
View SolutionDegree of hydrolysis for a salt of strong acid and weak base:
View SolutionpH of a salt of a strong base with weak acid
View SolutionThe conjugate of a strong acid is always a weak base.
View SolutionWhich of the following pH curve represent the titration of weak acid and strong base (dotted line show equivalence point)?
View SolutionIs the process of neutralisation of a strong acid by a strong base a redox process ?
View SolutionThe heat of neutralization of a strong acid by a strong base is a constant because :
View Solution
