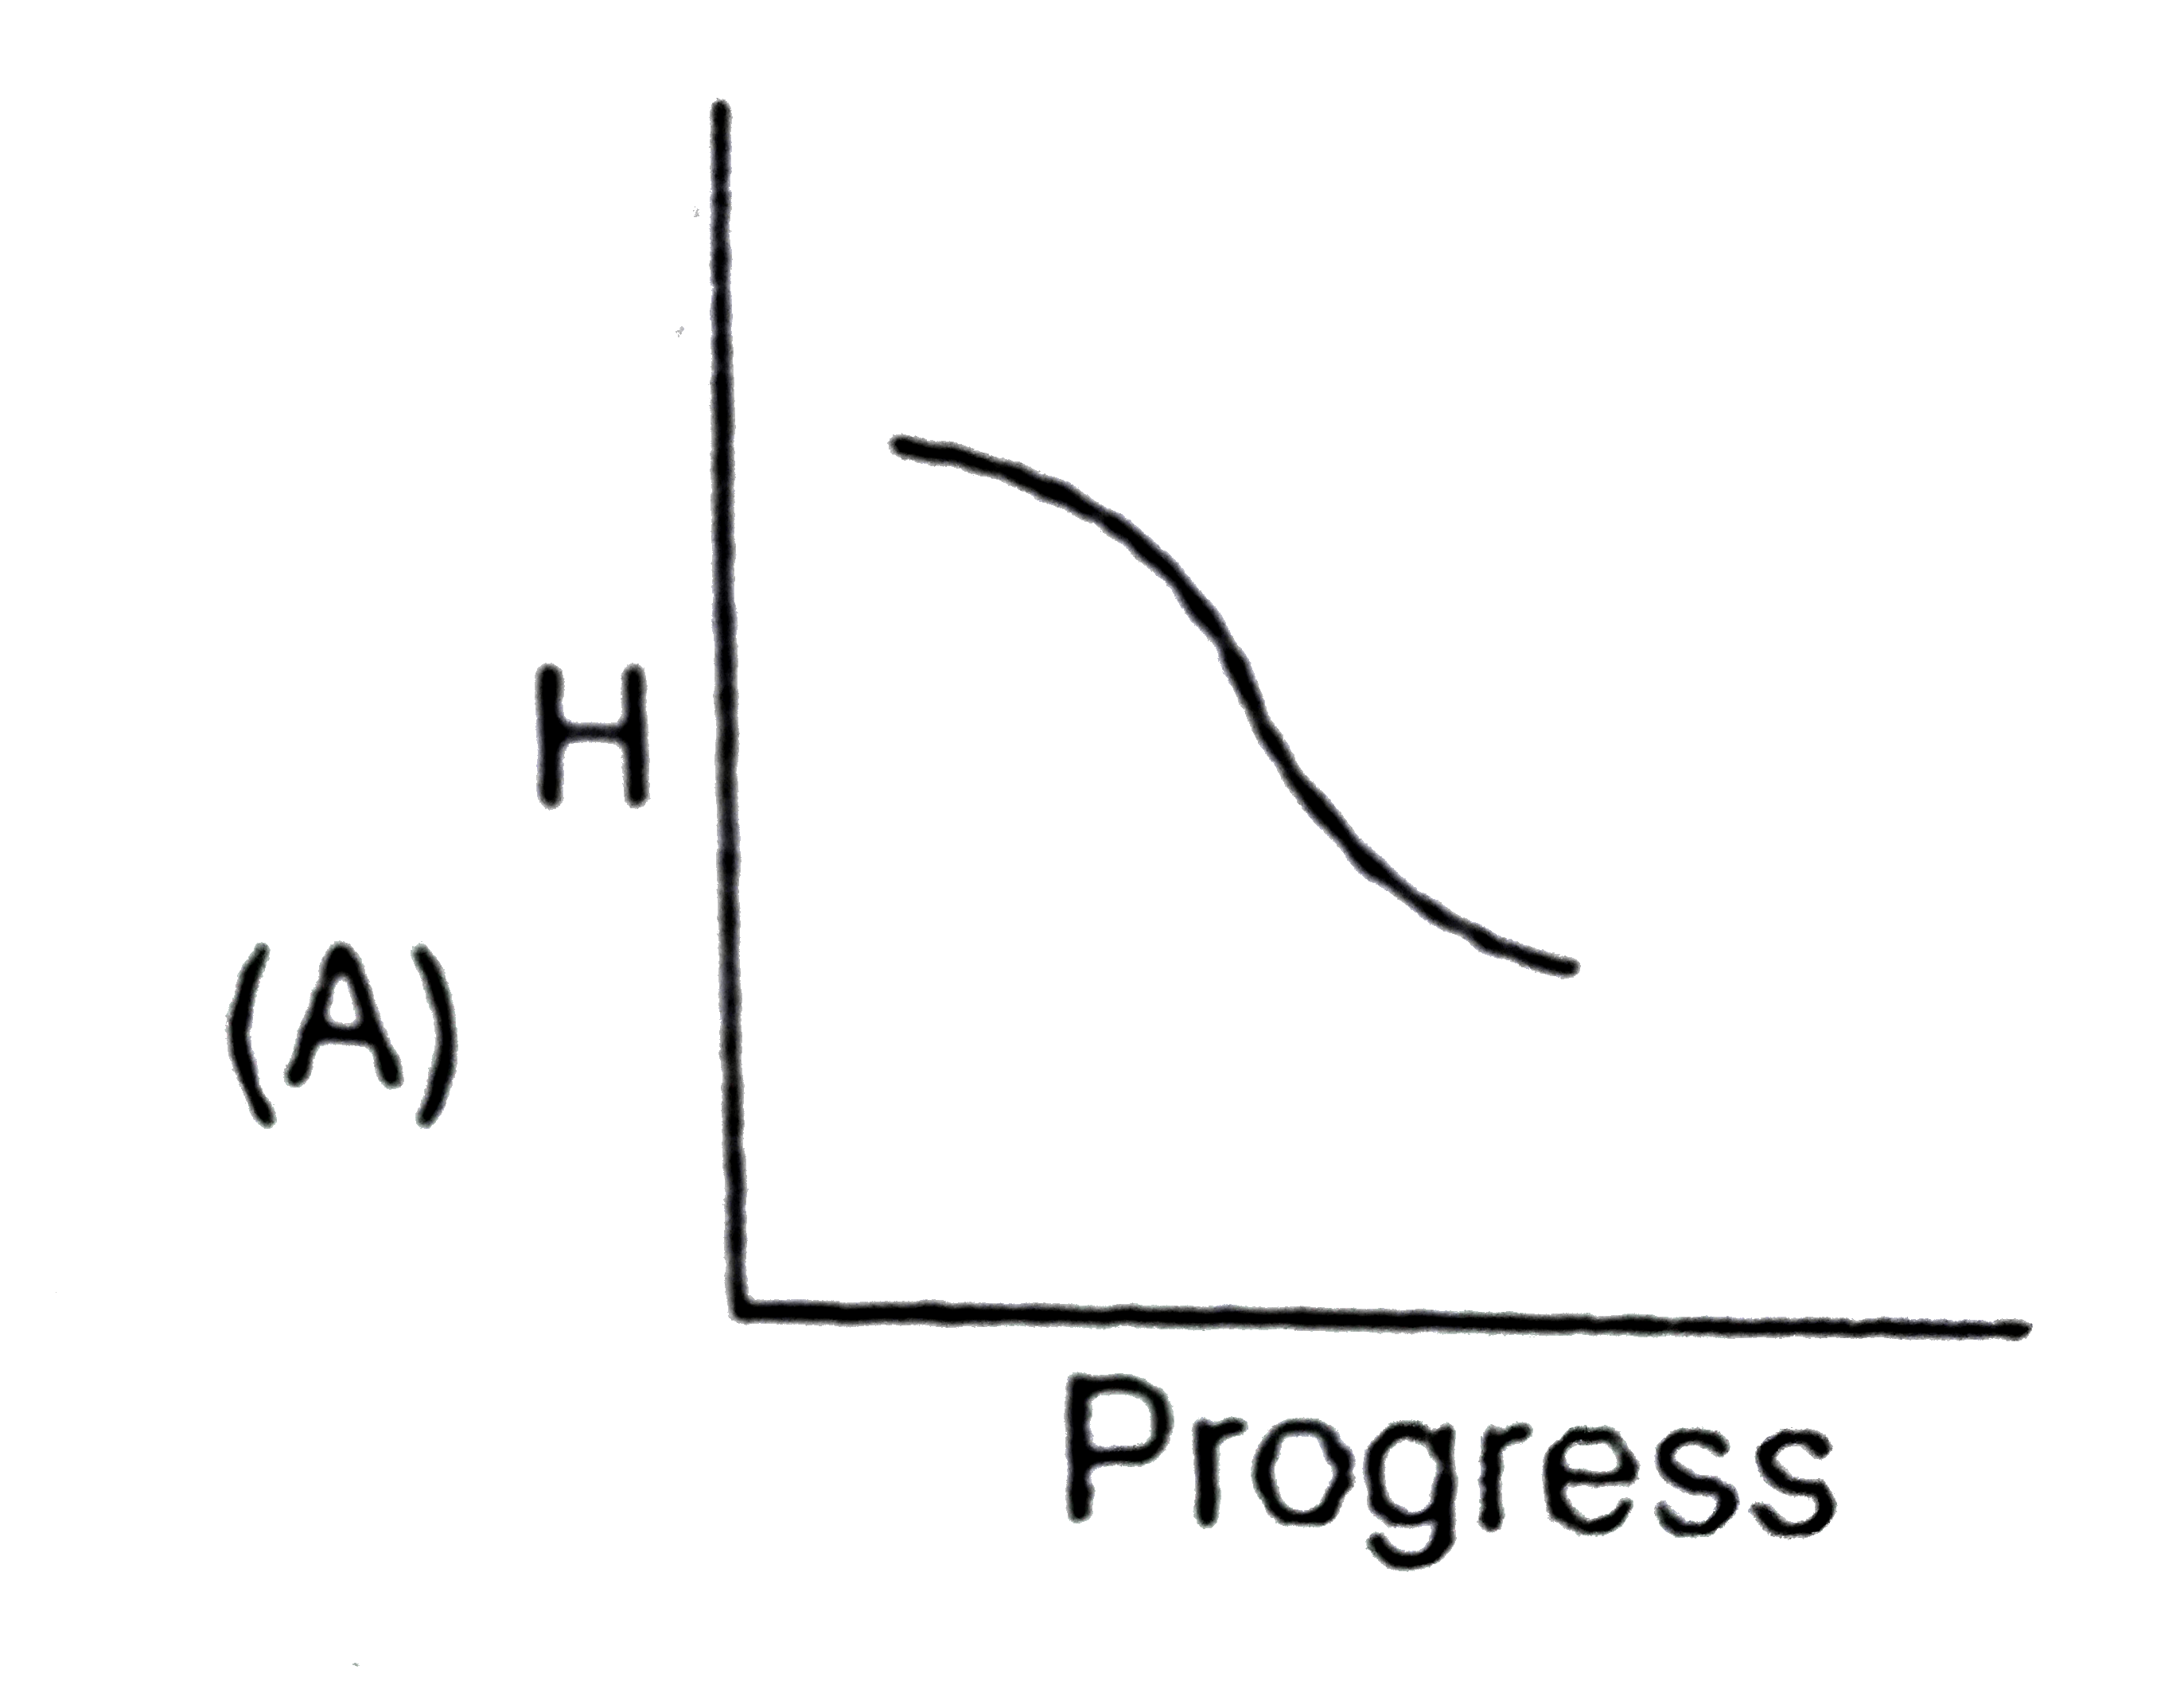
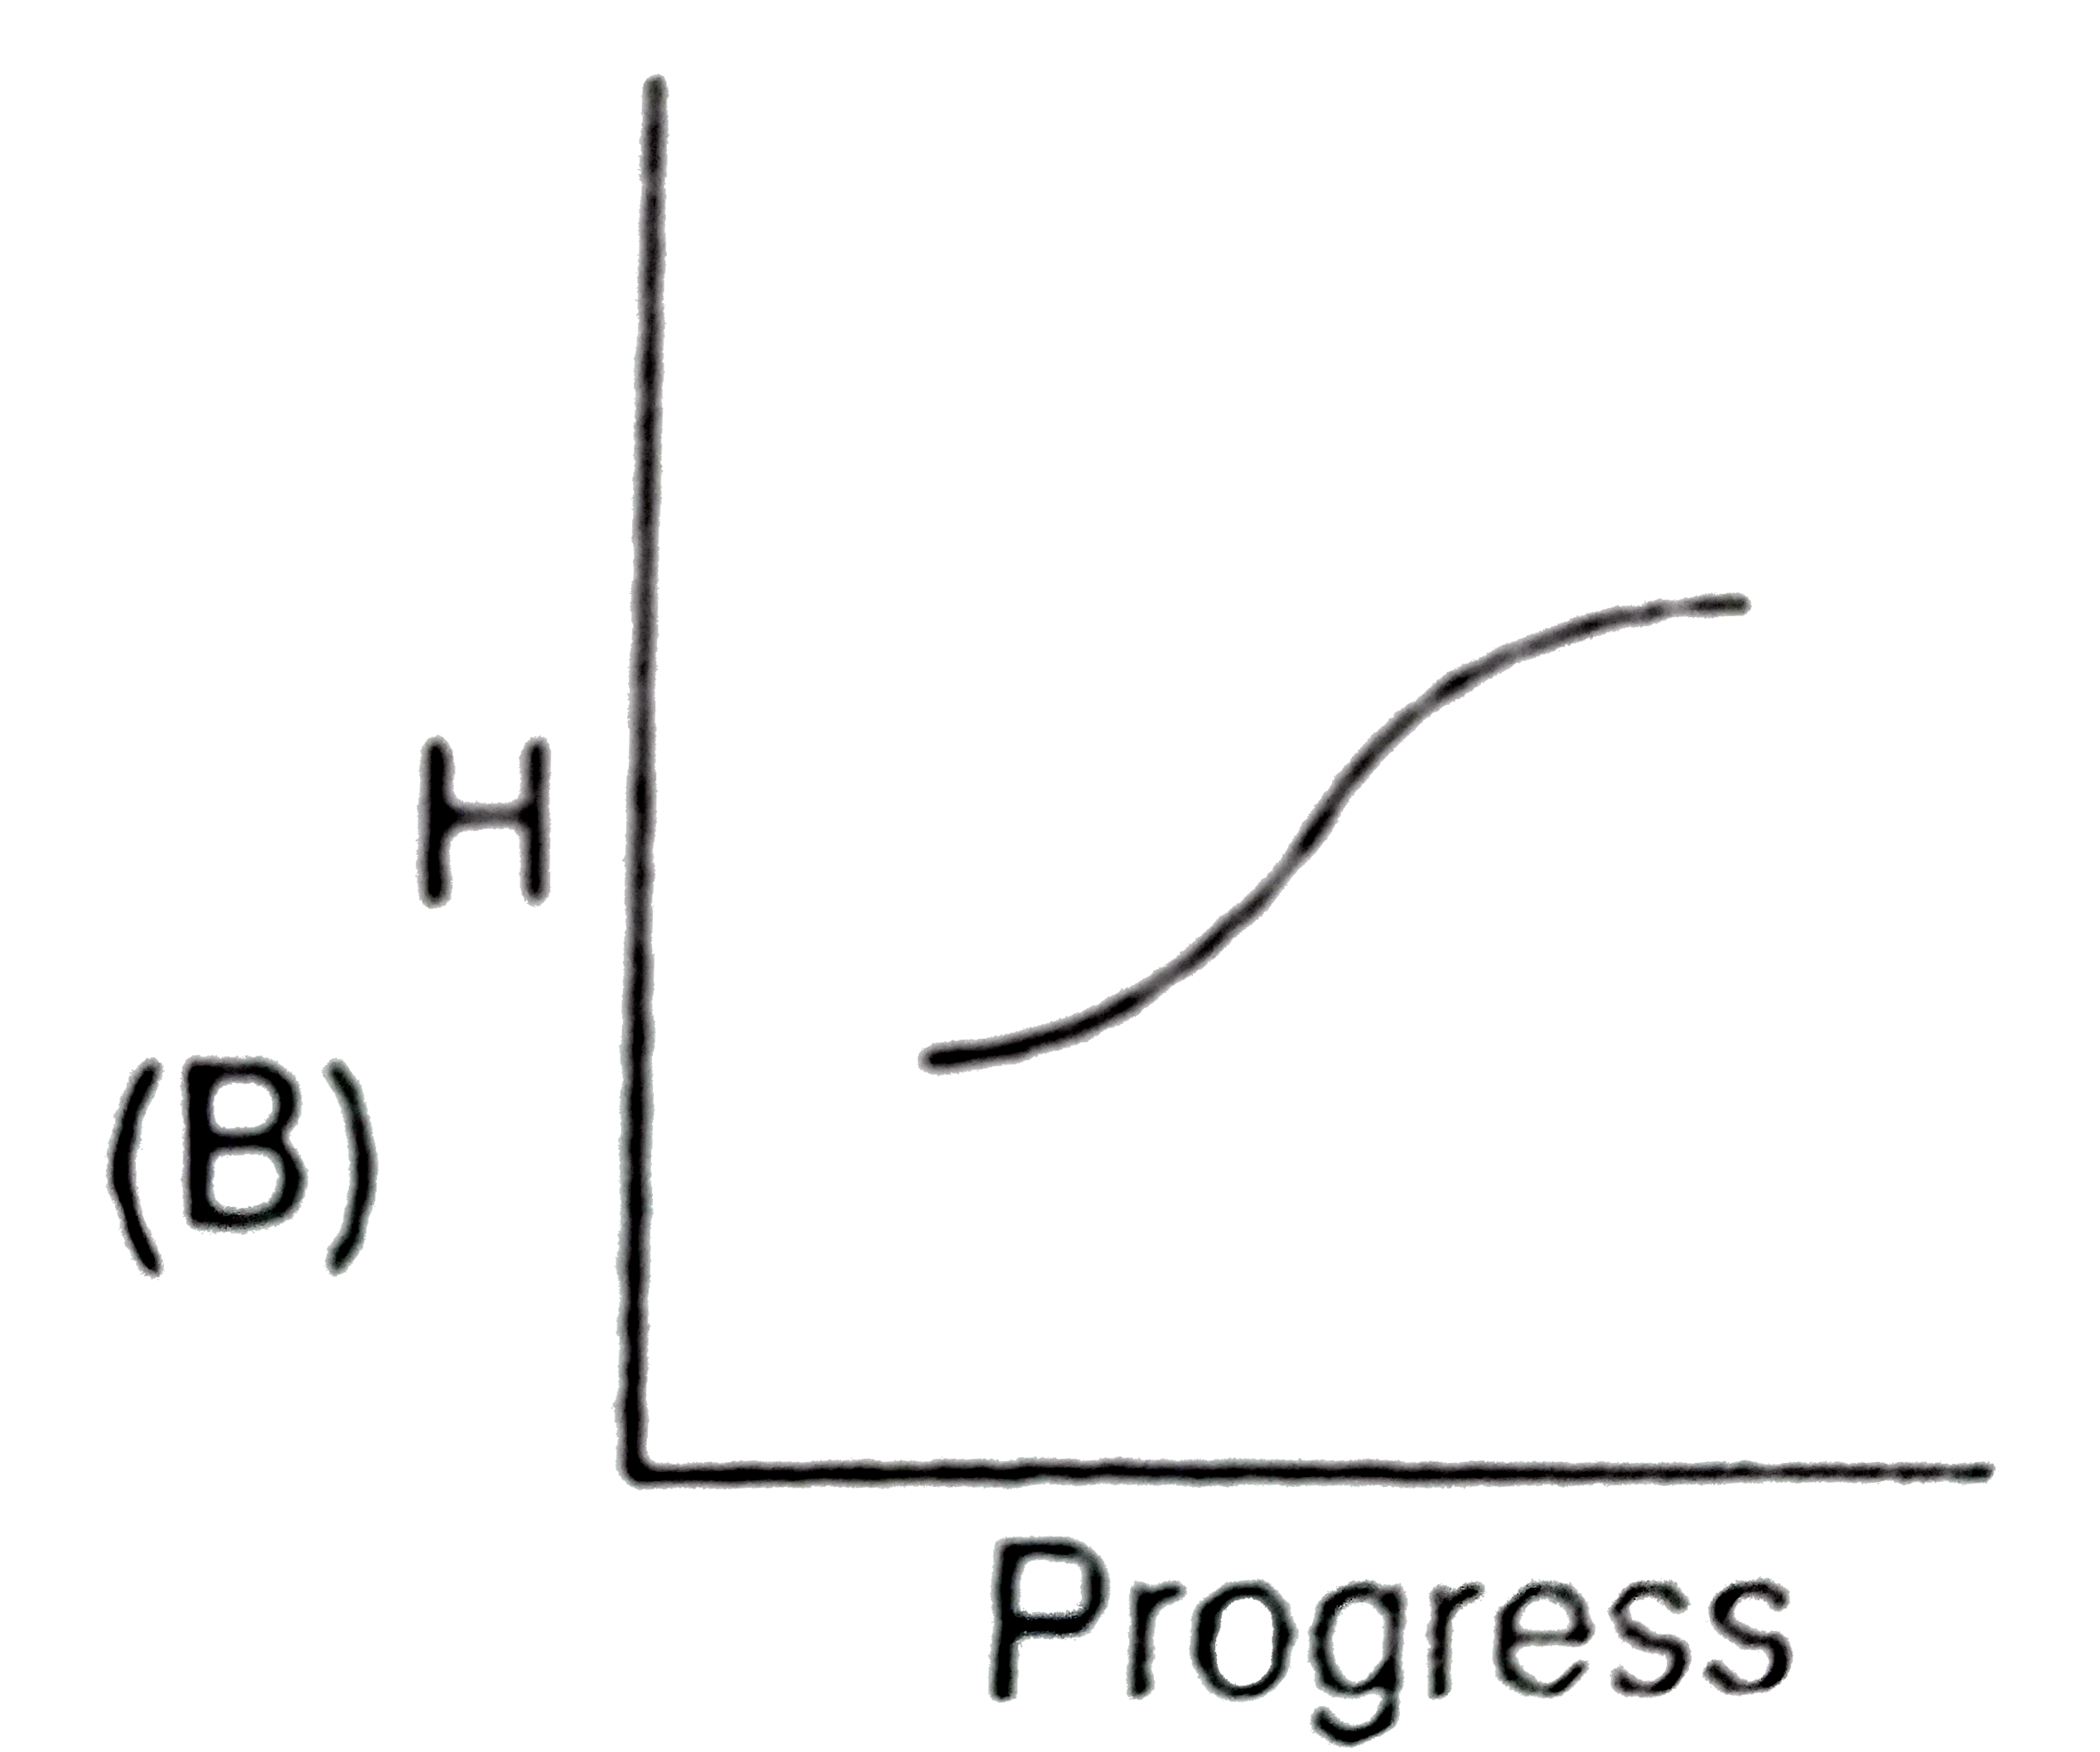
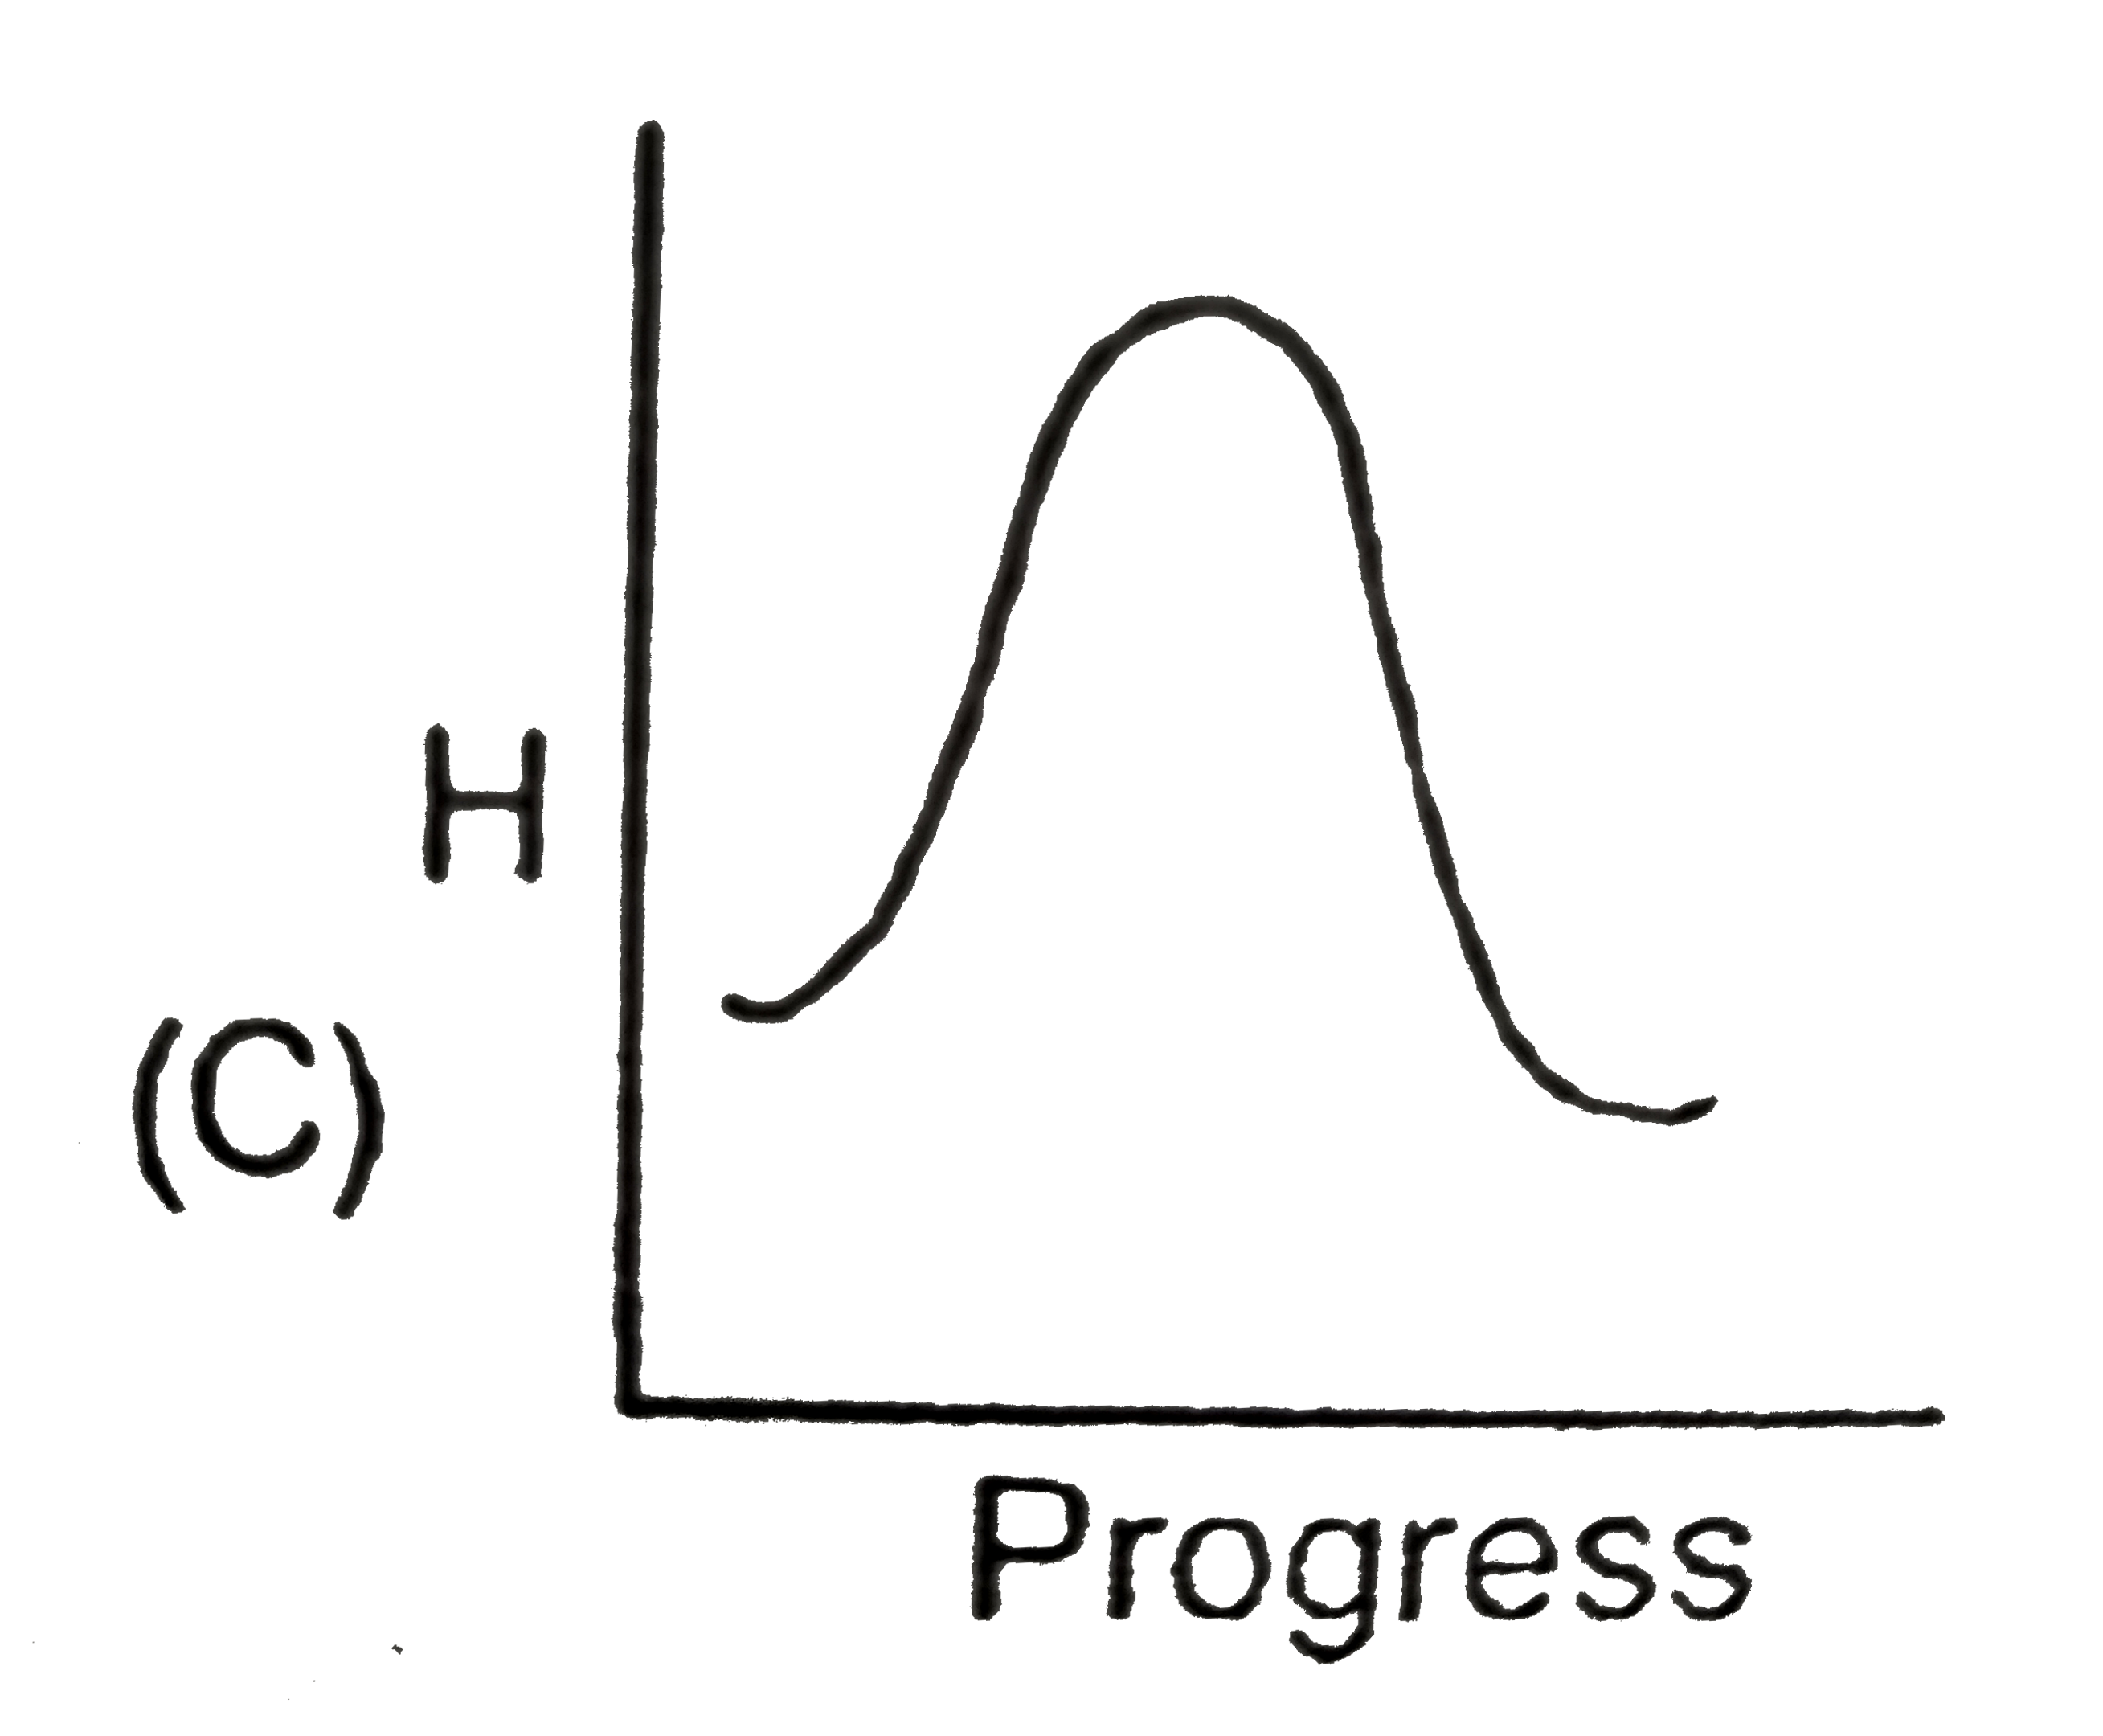
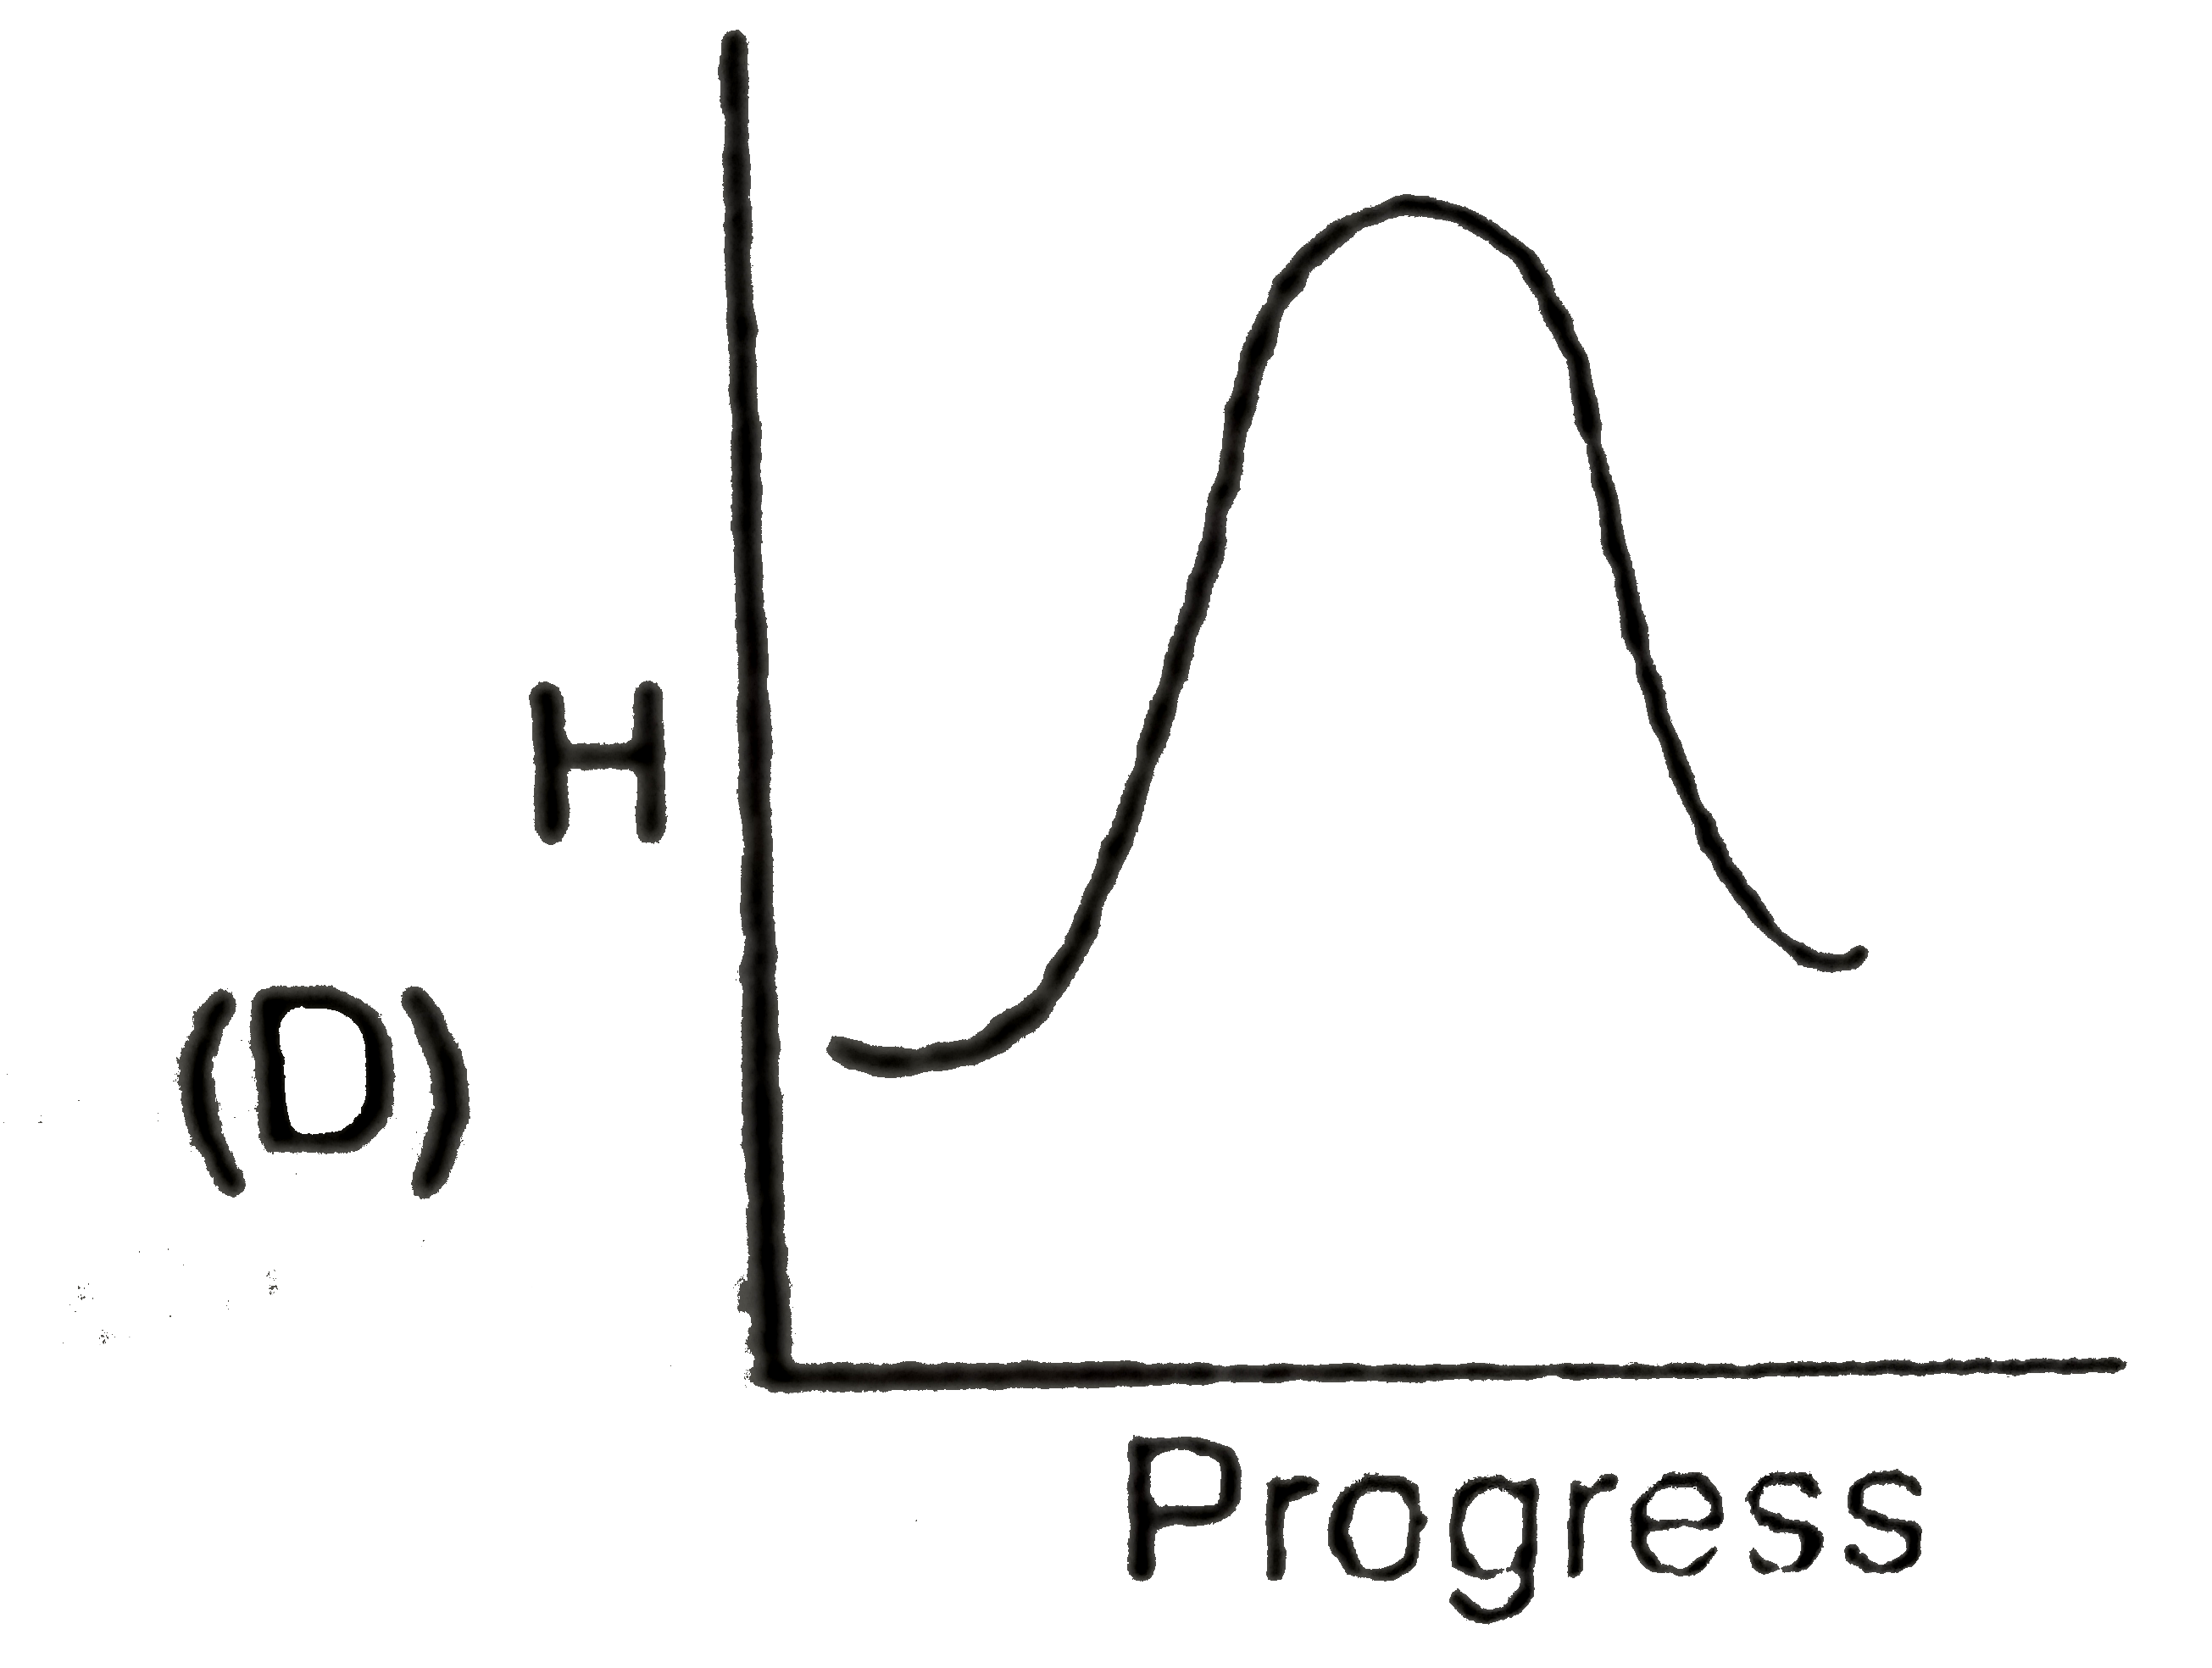
Identify the appropriate graph between enthalpy and progress of physical adsorption.


The correct Answer is:A
To identify the appropriate graph between enthalpy and the progress of physical adsorption, we will follow these steps:
Step 1: Understand Physical Adsorption
Physical adsorption is a process where molecules adhere to a surface through weak van der Waals forces. This process is typically exothermic, meaning it releases heat.
Step 2: Recognize the Enthalpy Change
Since physical adsorption is exothermic, the change in enthalpy (ΔH) is negative. This can be expressed as:
ΔH=Hf−Hi
where:
- Hf is the final enthalpy after adsorption.
- Hi is the initial enthalpy before adsorption.
Step 3: Determine the Relationship Between Initial and Final Enthalpy
For an exothermic process, the final enthalpy Hf will be less than the initial enthalpy Hi:
Hf<Hi
This indicates that the enthalpy decreases as the process progresses.
Step 4: Sketch the Graph
On the graph:
- The x-axis represents the progress of adsorption.
- The y-axis represents the enthalpy.
Since Hf<Hi, the graph will show a downward trend, indicating that enthalpy decreases as the adsorption progresses.
Step 5: Identify the Correct Graph
Given the options, the correct graph would show a decreasing line from left to right, indicating that as the progress of physical adsorption increases, the enthalpy decreases.
Conclusion
The appropriate graph for the enthalpy versus the progress of physical adsorption is a downward sloping line, indicating a decrease in enthalpy.
Physical adsorption is a process where molecules adhere to a surface through weak van der Waals forces. This process is typically exothermic, meaning it releases heat.
Since physical adsorption is exothermic, the change in enthalpy (ΔH) is negative. This can be expressed as:
ΔH=Hf−Hi
where:
- Hf is the final enthalpy after adsorption.
- Hi is the initial enthalpy before adsorption.
For an exothermic process, the final enthalpy Hf will be less than the initial enthalpy Hi:
Hf<Hi
This indicates that the enthalpy decreases as the process progresses.
On the graph:
- The x-axis represents the progress of adsorption.
- The y-axis represents the enthalpy.
Given the options, the correct graph would show a decreasing line from left to right, indicating that as the progress of physical adsorption increases, the enthalpy decreases.
The appropriate graph for the enthalpy versus the progress of physical adsorption is a downward sloping line, indicating a decrease in enthalpy.
Similar Questions
Knowledge Check
- Question 1 - Select One
Physical adsorption is:
AirreversibleBhighly specificCnot very specificDunpredictable
Discuss the characteristics of physical adsorption.
View SolutionWhich is not correct for physical adsorption?
View SolutionWhich is not correct for physical adsorption ?
View SolutionWhich is not a characteristic of physical adsorption ?
View SolutionDistinguish between physical adsorption and chemical adsorption.
View SolutionThere is desorption of physical adsorption when
View SolutionThe heat of adsorption of physical adsorption is nearly
View Solution

