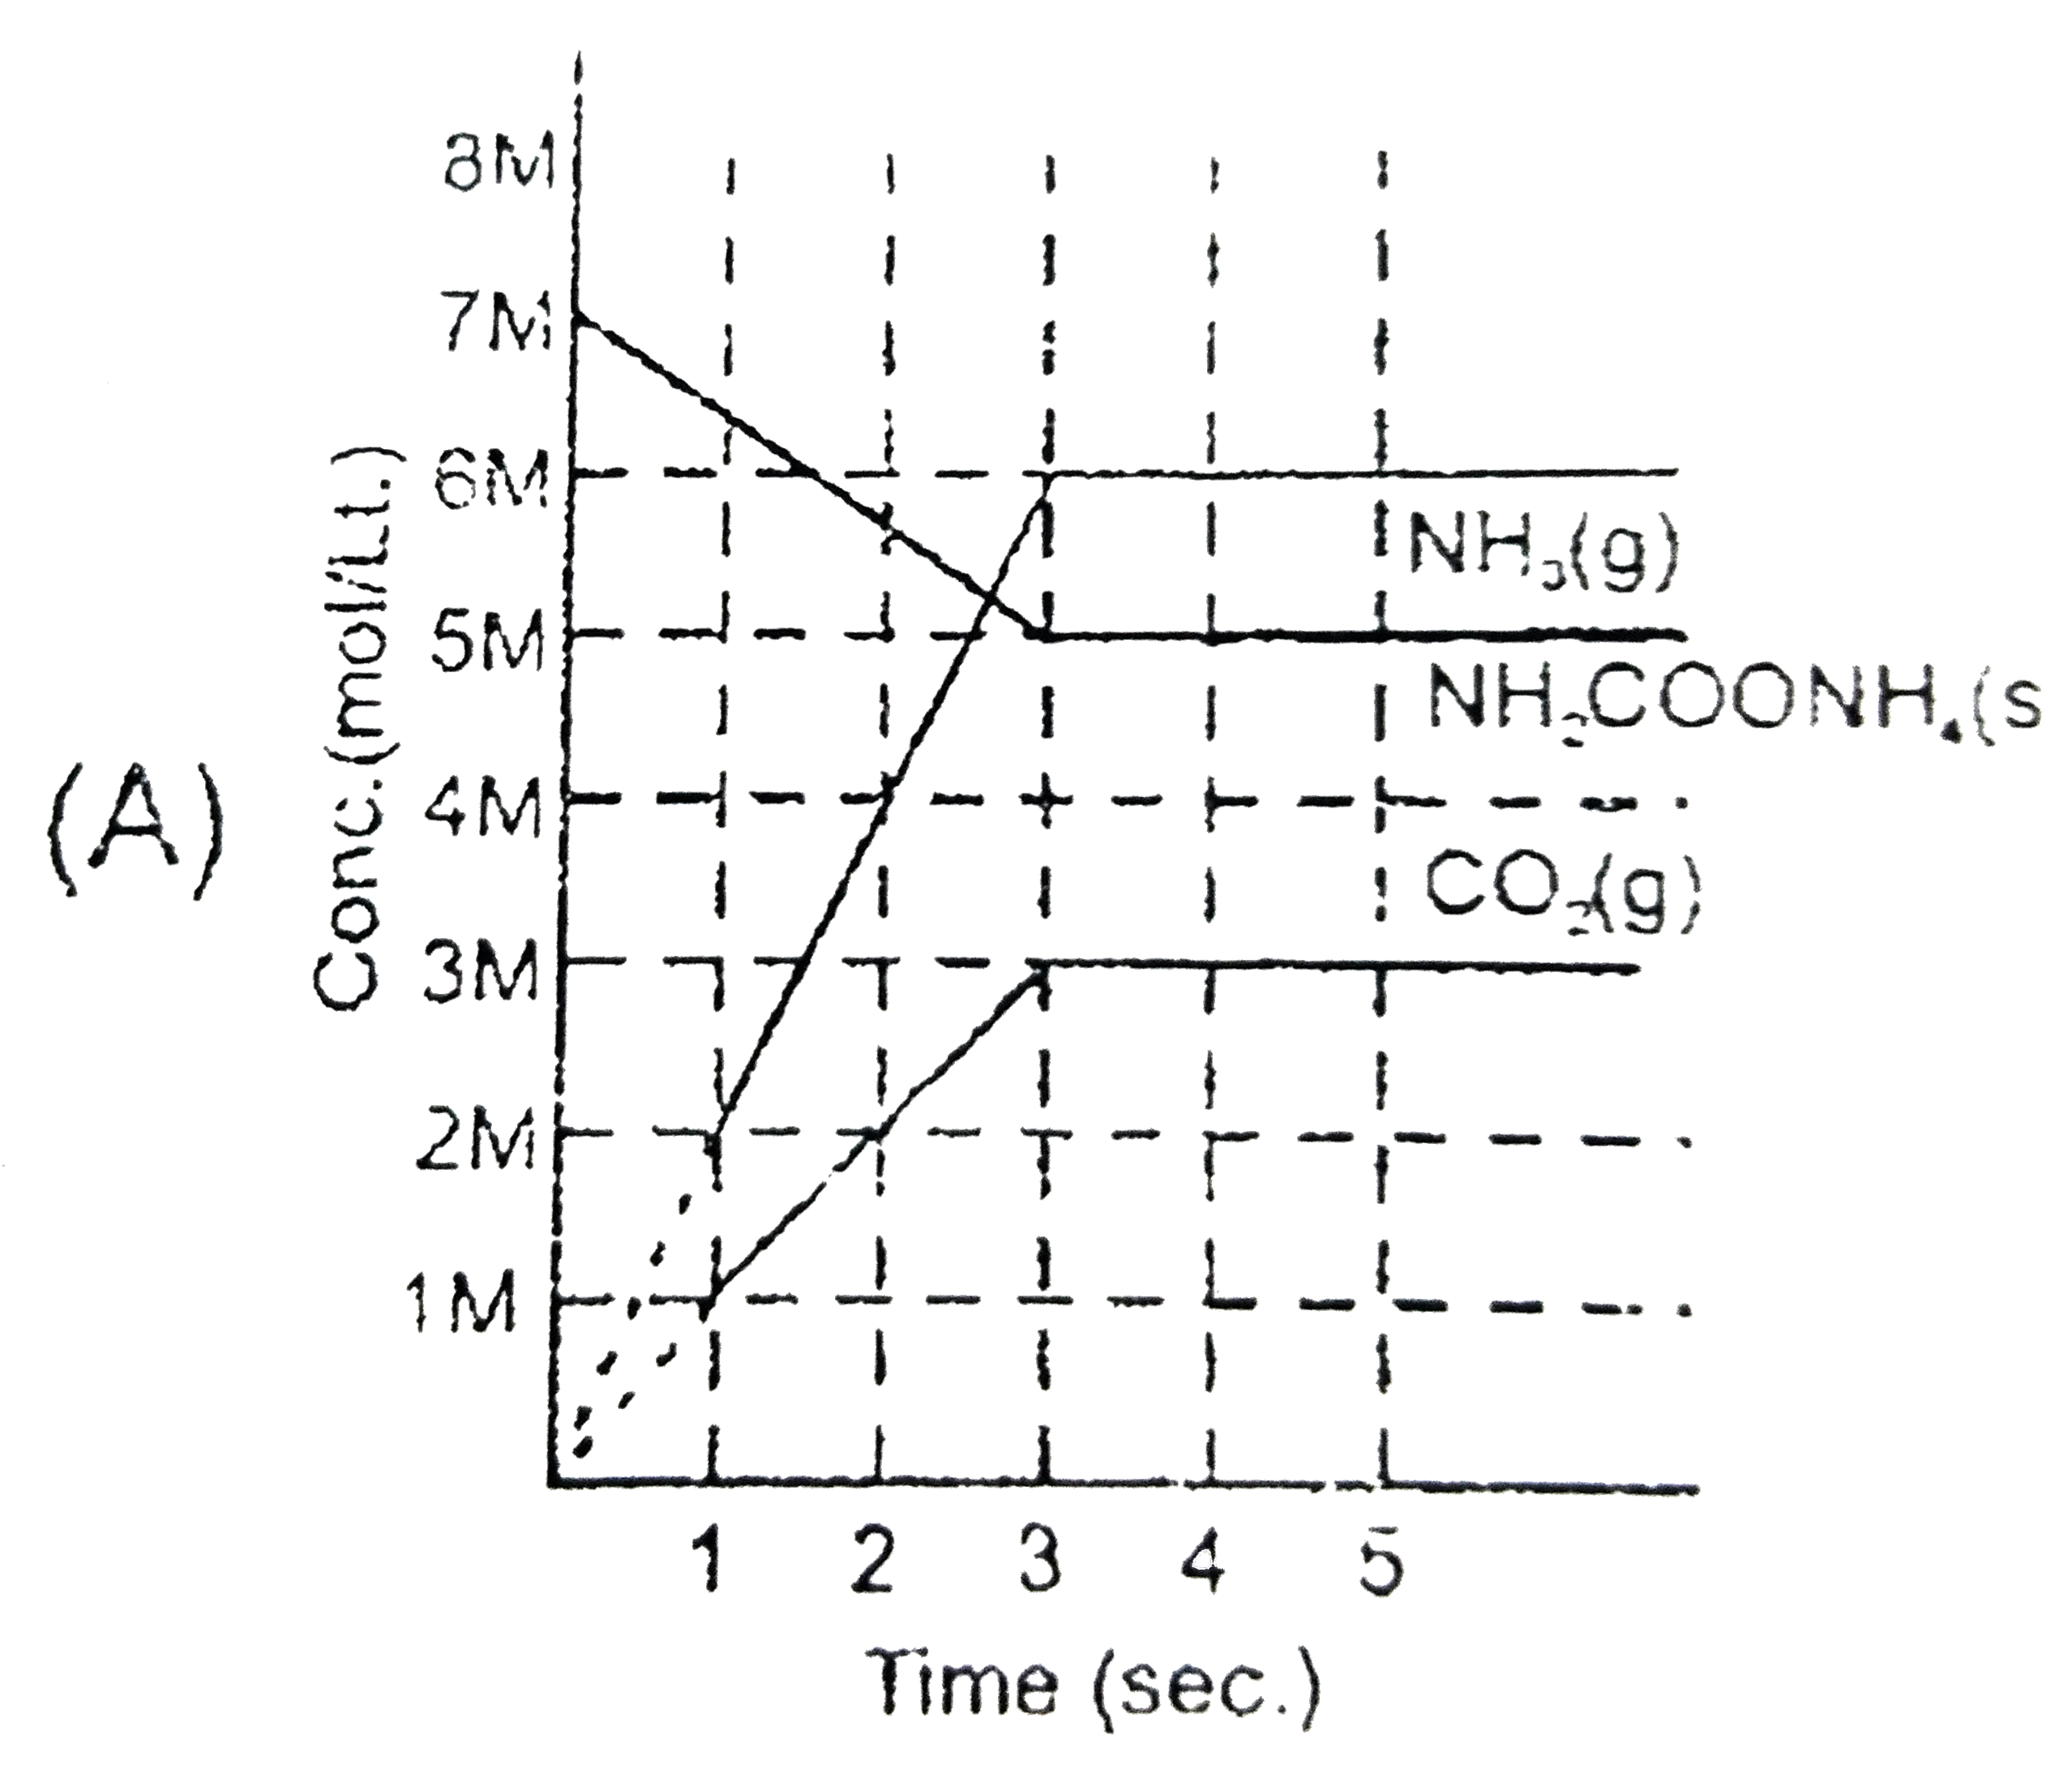
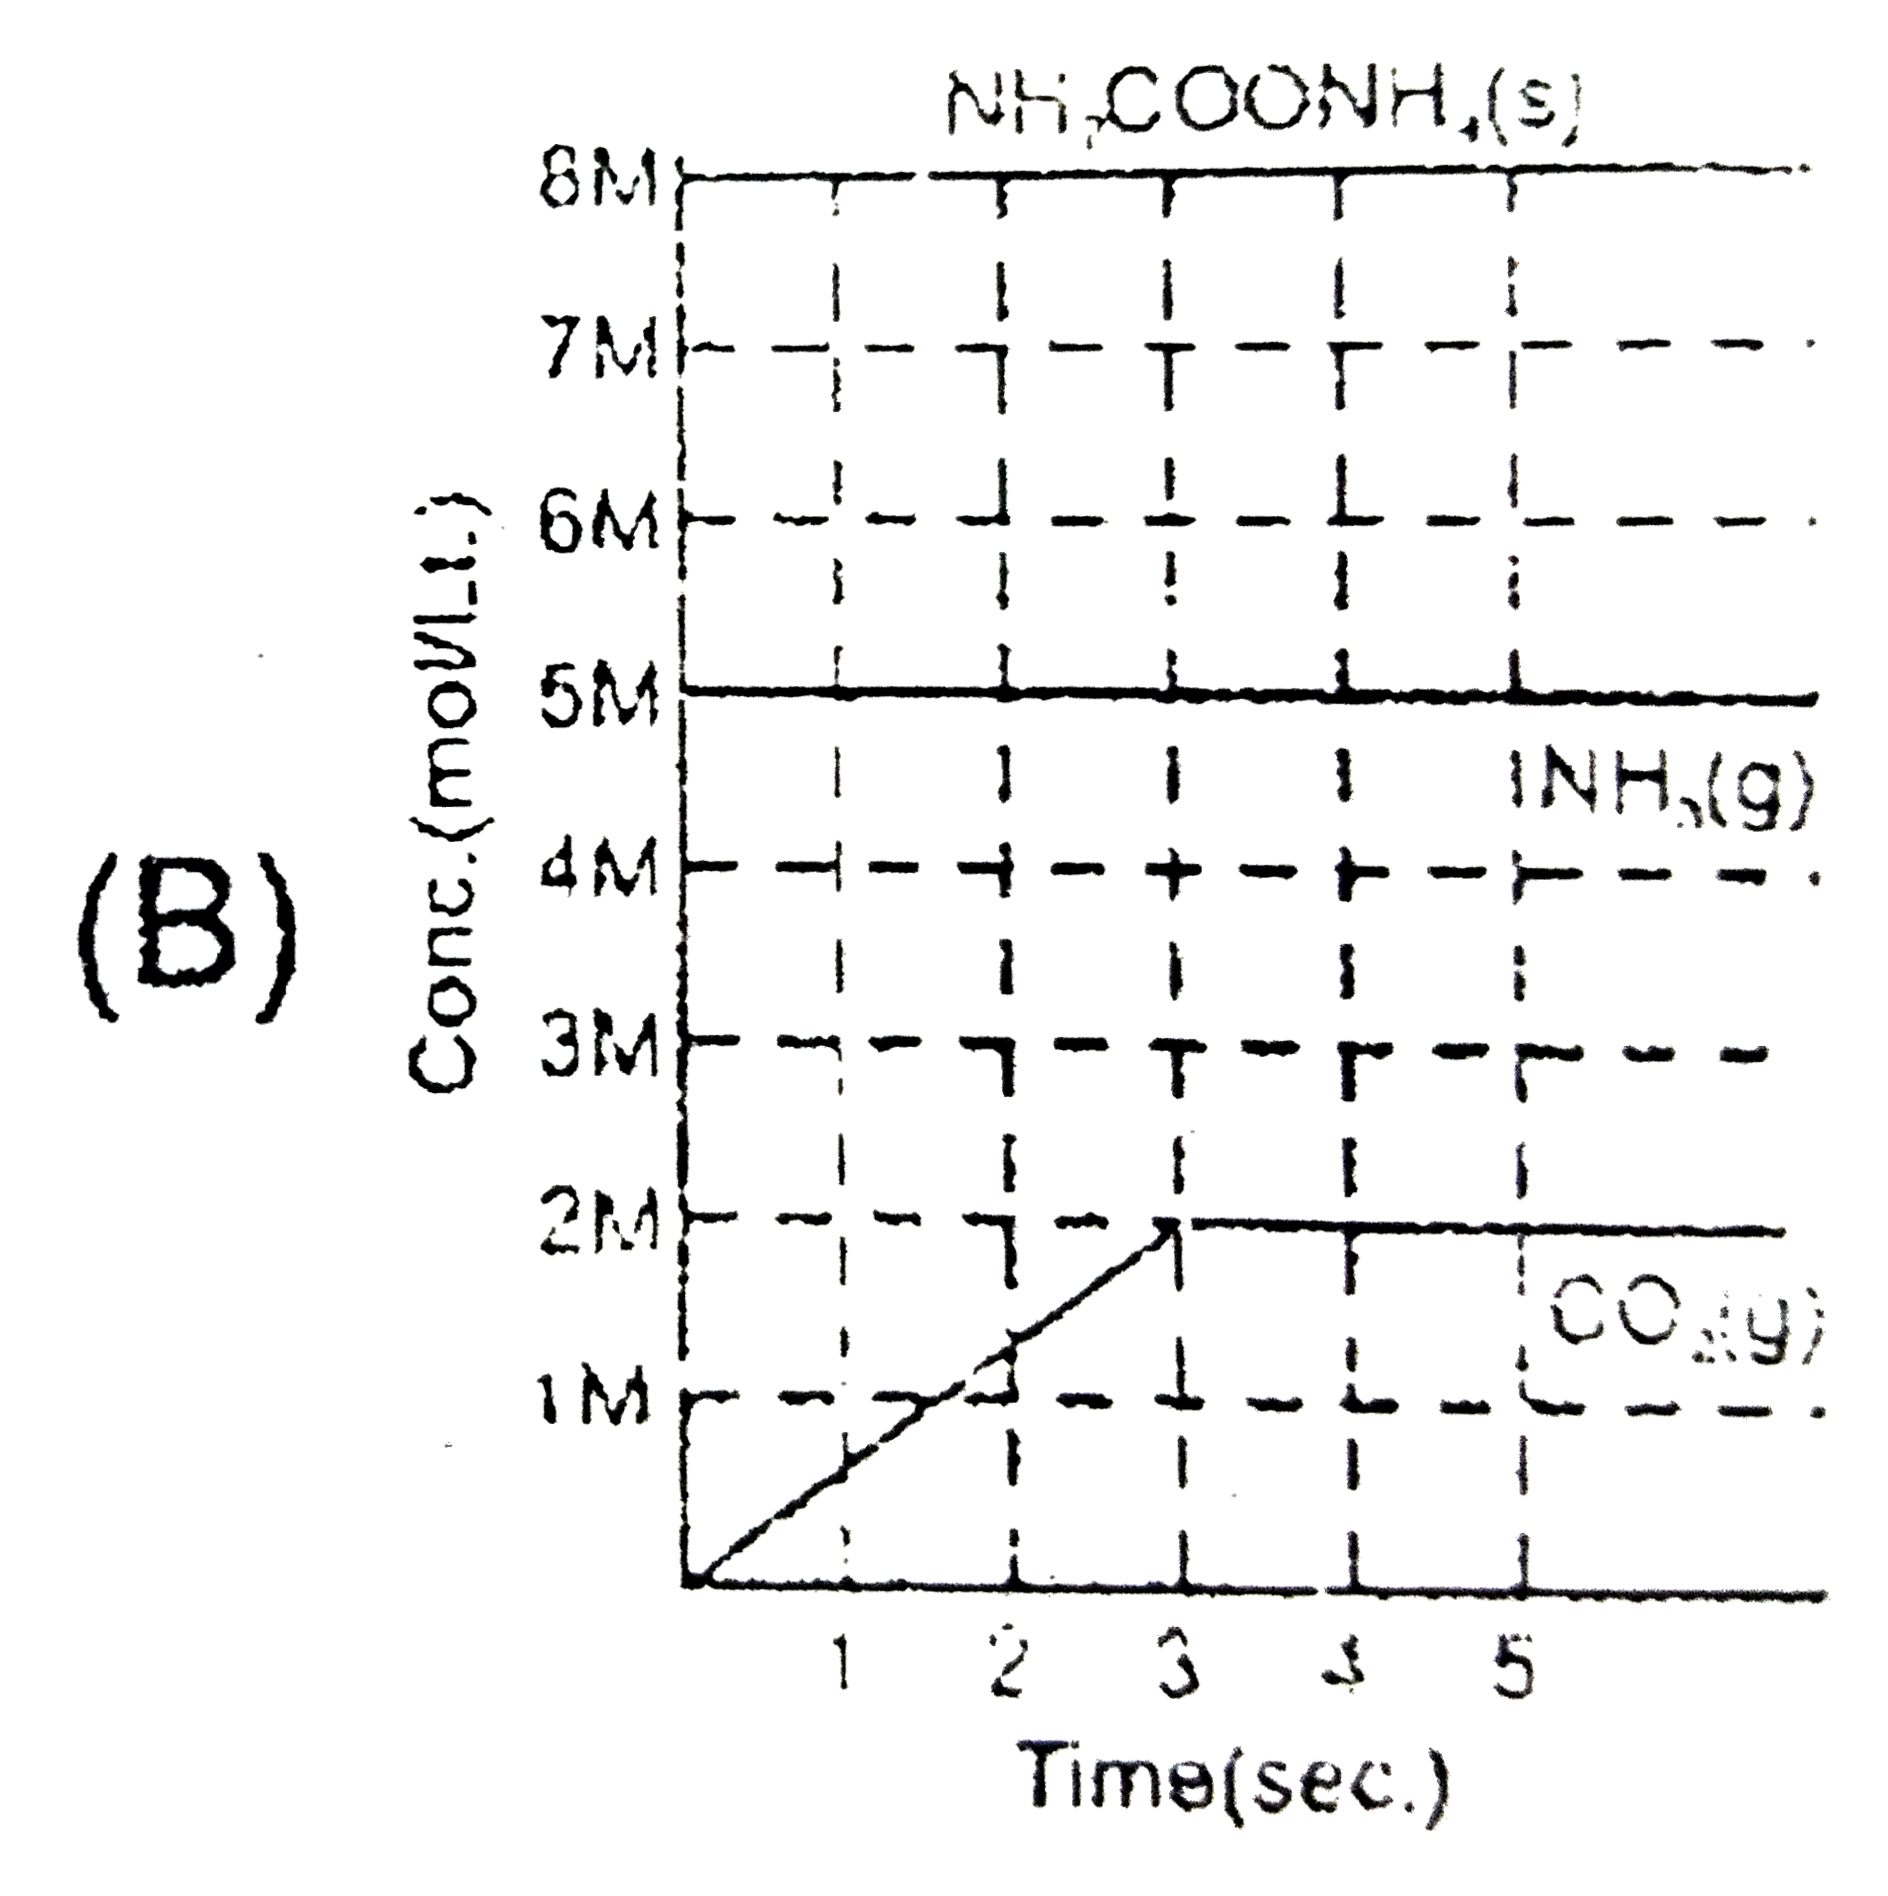
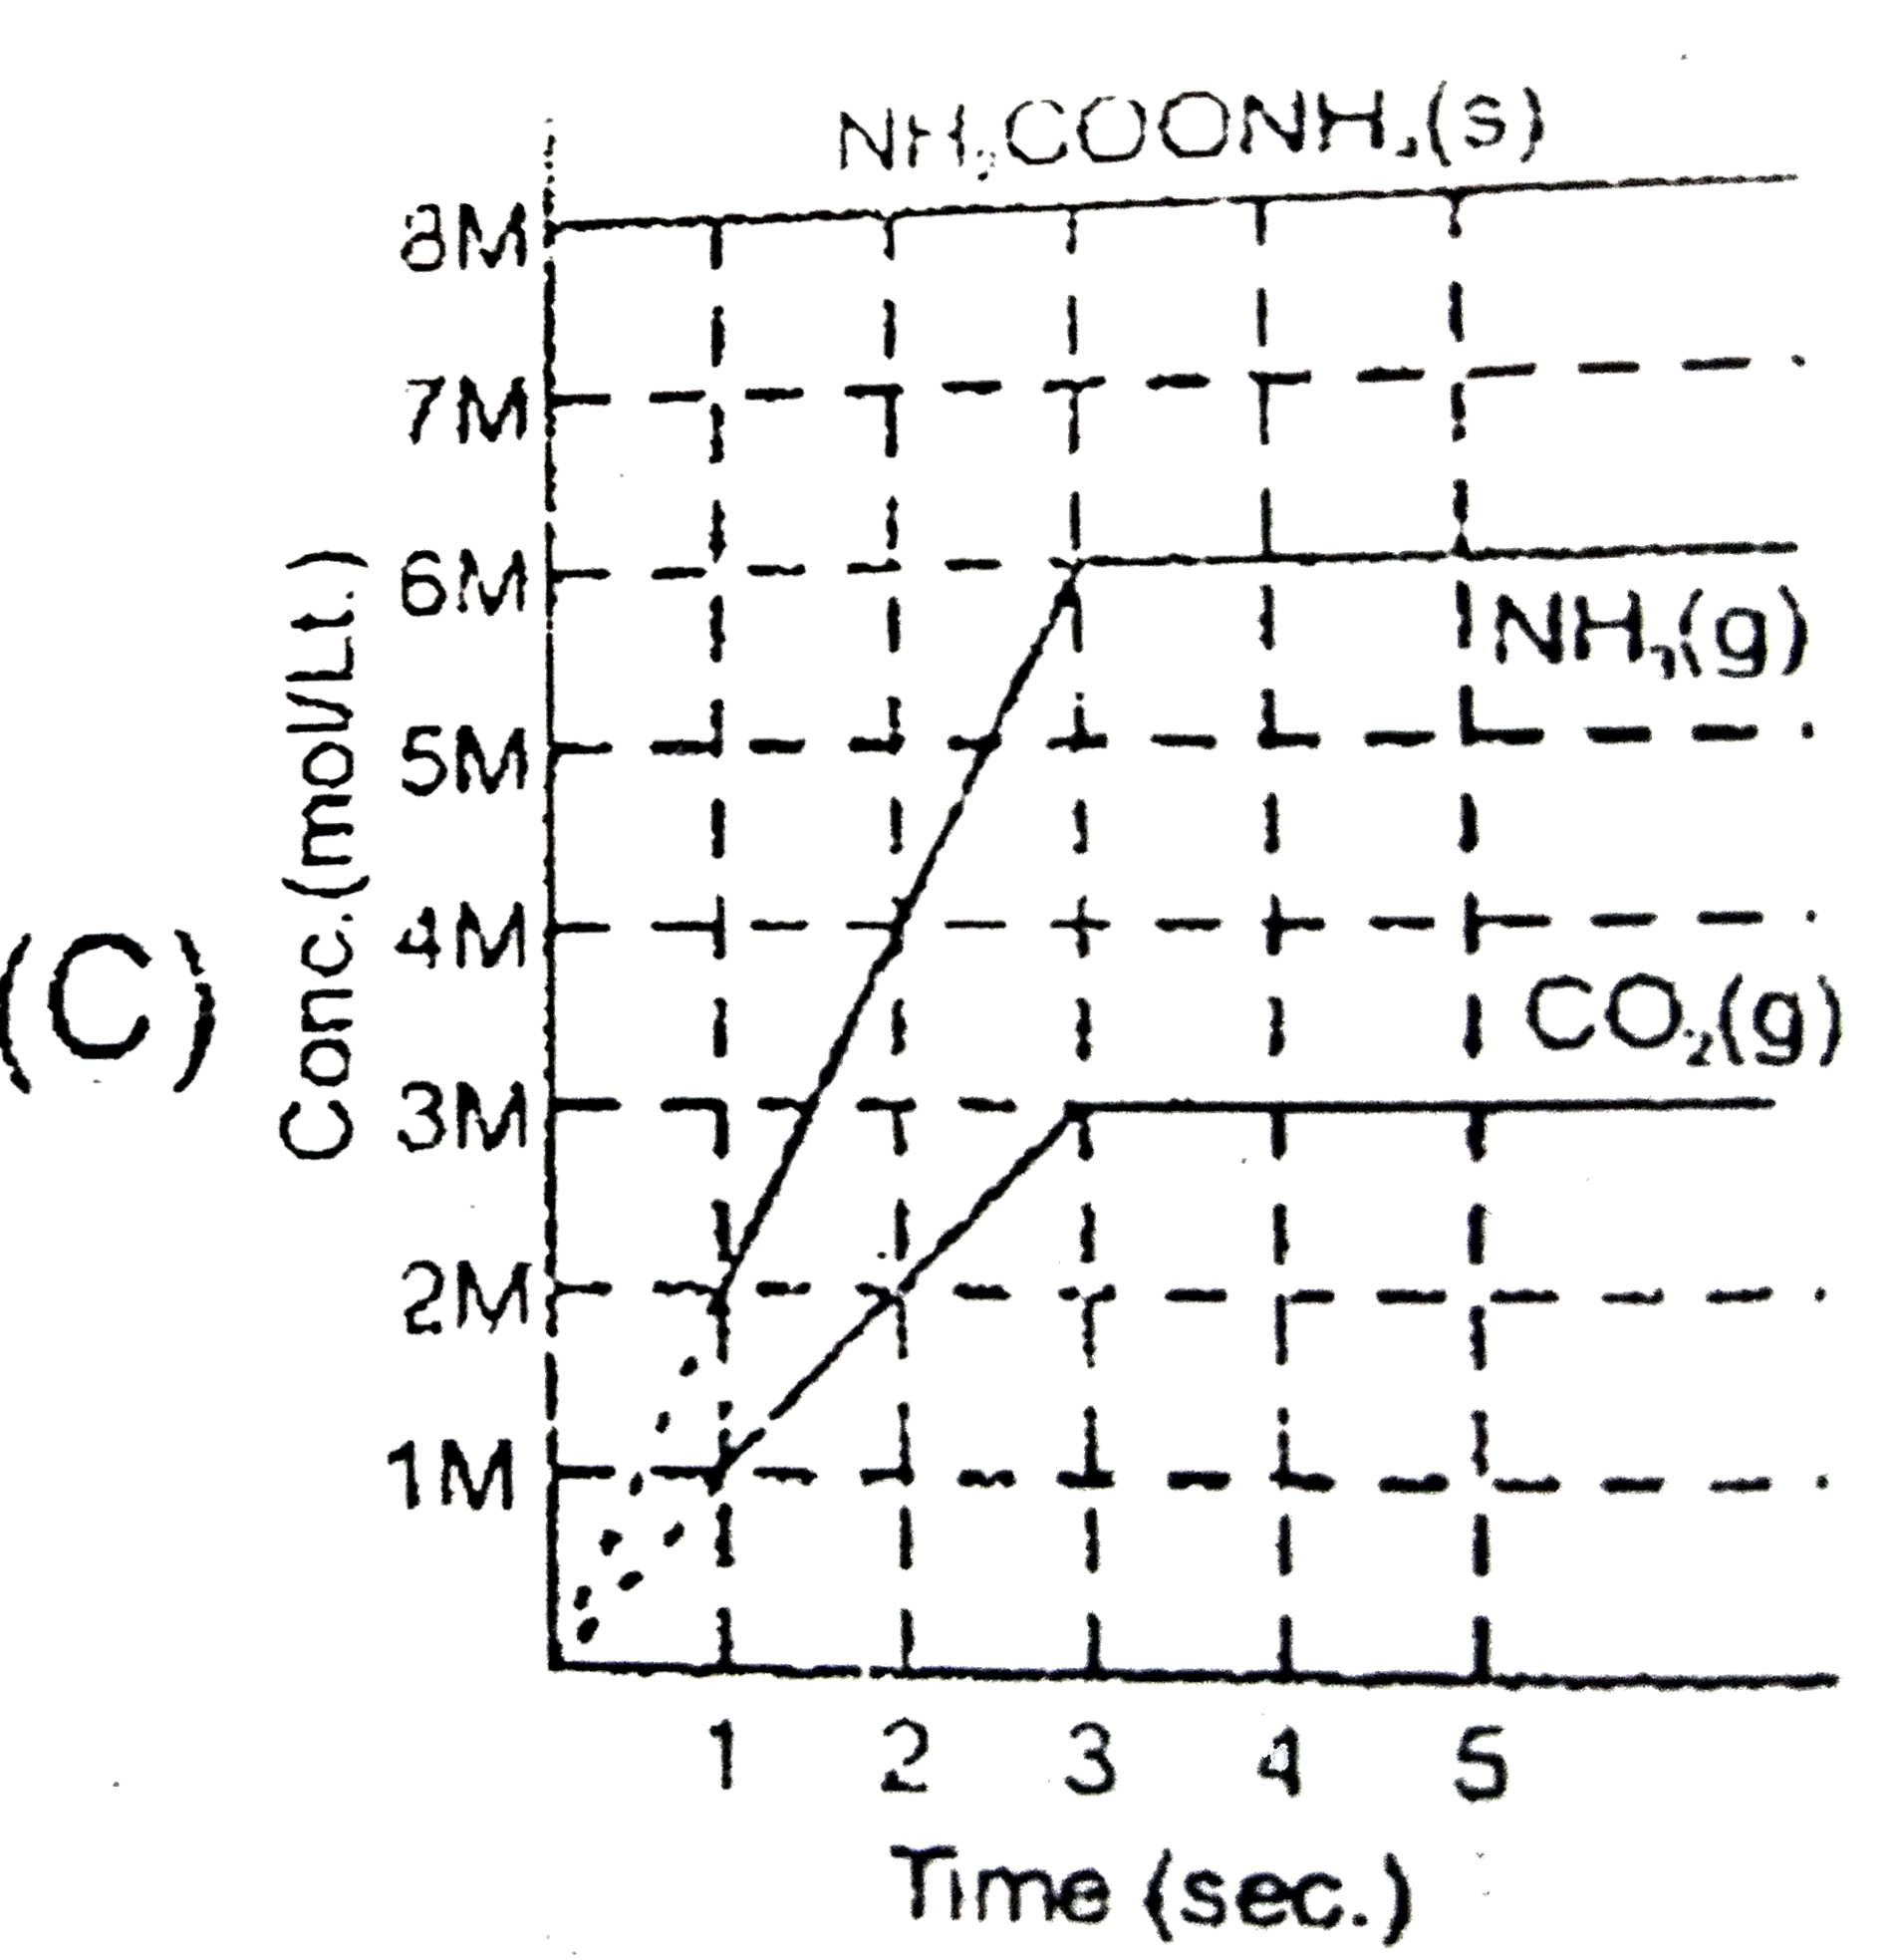
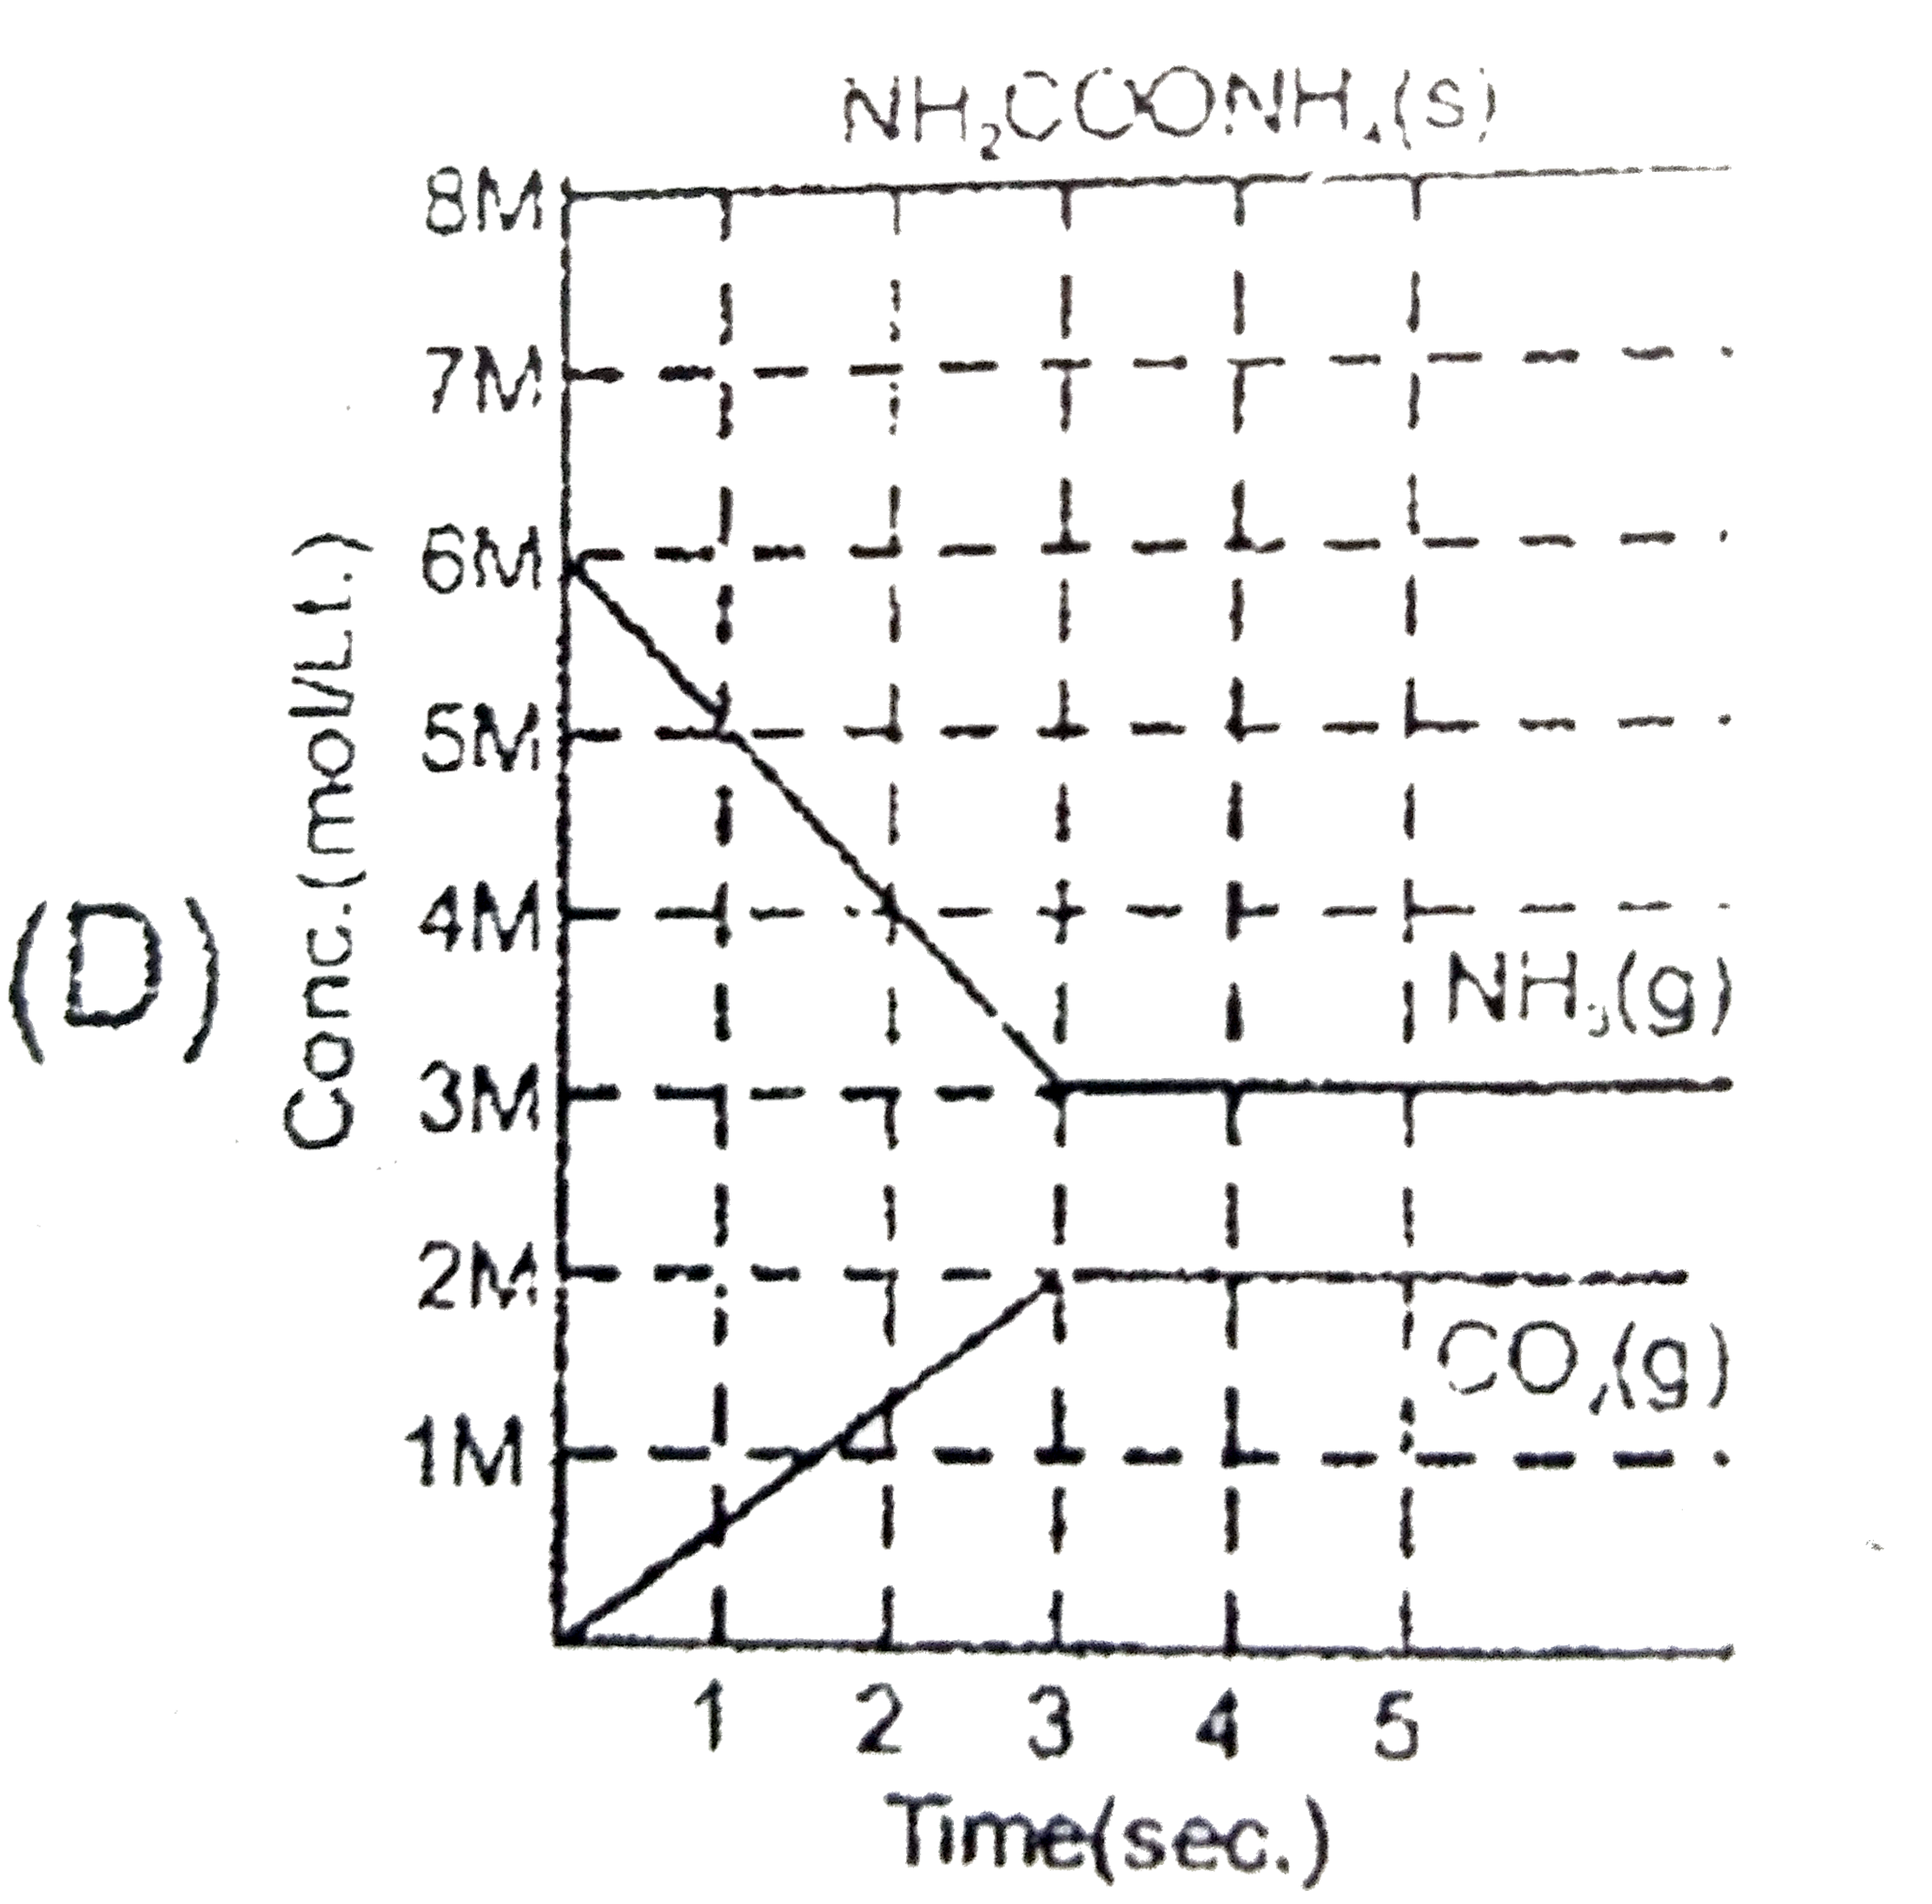
Solid ammonium carbamate dissociate to give ammonia and carbon dioxide as follows
NH2COONH4(s)⇔2NH3(g)+CO2(g)
which of the following graph correctly represents the equilibrium.


The correct Answer is:C
To solve the question regarding the dissociation of solid ammonium carbamate into ammonia and carbon dioxide, we will analyze the equilibrium process and how it can be represented graphically.
1. Understanding the Reaction:
The reaction given is:
NH2COONH4(s)⇌2NH3(g)+CO2(g)
Here, solid ammonium carbamate dissociates into gaseous ammonia and carbon dioxide.
2. Identifying the Phases:
- Ammonium carbamate is a solid, which means its concentration does not change over time as it does not enter the equilibrium expression.
- Ammonia (NH₃) and carbon dioxide (CO₂) are gases, and their concentrations will change as the reaction progresses.
3. Graphical Representation:
- On a graph where the y-axis represents concentration and the x-axis represents time:
- The concentration of solid ammonium carbamate will remain constant (a horizontal line).
- The concentration of ammonia will start at zero and increase until it reaches a constant value at equilibrium.
- The concentration of carbon dioxide will also start at zero and increase until it reaches a constant value at equilibrium.
4. Drawing the Graph:
- For ammonium carbamate (solid), draw a horizontal line at a constant concentration.
- For ammonia, draw a curve that starts at zero, rises steeply, and then levels off as it approaches its equilibrium concentration.
- For carbon dioxide, draw a similar curve to ammonia, starting at zero, rising, and then leveling off at its equilibrium concentration.
5. Identifying the Correct Graph:
- Among the provided options (graphs A, B, C, D), look for a graph that shows:
- A constant line for the solid (ammonium carbamate).
- An increasing curve for ammonia that levels off.
- An increasing curve for carbon dioxide that also levels off.
- Based on the description, graph C corresponds to this behavior.
Conclusion:
The correct graph that represents the equilibrium of the dissociation of solid ammonium carbamate into ammonia and carbon dioxide is Graph C.
---
The reaction given is:
NH2COONH4(s)⇌2NH3(g)+CO2(g)
Here, solid ammonium carbamate dissociates into gaseous ammonia and carbon dioxide.
- Ammonium carbamate is a solid, which means its concentration does not change over time as it does not enter the equilibrium expression.
- Ammonia (NH₃) and carbon dioxide (CO₂) are gases, and their concentrations will change as the reaction progresses.
- On a graph where the y-axis represents concentration and the x-axis represents time:
- The concentration of solid ammonium carbamate will remain constant (a horizontal line).
- The concentration of ammonia will start at zero and increase until it reaches a constant value at equilibrium.
- The concentration of carbon dioxide will also start at zero and increase until it reaches a constant value at equilibrium.
- For ammonium carbamate (solid), draw a horizontal line at a constant concentration.
- For ammonia, draw a curve that starts at zero, rises steeply, and then levels off as it approaches its equilibrium concentration.
- For carbon dioxide, draw a similar curve to ammonia, starting at zero, rising, and then leveling off at its equilibrium concentration.
- Among the provided options (graphs A, B, C, D), look for a graph that shows:
- A constant line for the solid (ammonium carbamate).
- An increasing curve for ammonia that levels off.
- An increasing curve for carbon dioxide that also levels off.
- Based on the description, graph C corresponds to this behavior.
The correct graph that represents the equilibrium of the dissociation of solid ammonium carbamate into ammonia and carbon dioxide is Graph C.
Topper's Solved these Questions
- CHEMICAL EQUILIBRIUMBOOK - RESONANCE ENGLISHCHAPTER - CHEMICAL EQUILIBRIUMEXERCISE - Exercise-2 (Part-1)
28 Videos
- CHEMICAL EQUILIBRIUMBOOK - RESONANCE ENGLISHCHAPTER - CHEMICAL EQUILIBRIUMEXERCISE - Exercise-2 (Part-2)
22 Videos
- CHEMICAL EQUILIBRIUMBOOK - RESONANCE ENGLISHCHAPTER - CHEMICAL EQUILIBRIUMEXERCISE - Exercise-1 (Part-1)
38 Videos
- CHEMICAL BONDINGBOOK - RESONANCE ENGLISHCHAPTER - CHEMICAL BONDINGEXERCISE - ORGANIC CHEMISTRY(Fundamental Concept )
6 Videos
- D & F-BLOCK ELEMENTS & THEIR IMPORTANT COMPOUNDS BOOK - RESONANCE ENGLISHCHAPTER - D & F-BLOCK ELEMENTS & THEIR IMPORTANT COMPOUNDS EXERCISE - Match the column
1 Videos
Similar Questions
Solid ammonium carbomate, NH4CO2NH2(s), dissociates into ammonia and carbon dioxide when it evaporates as shown by
NH4CO2NH2(s)⇔2NH3(g)+CO2(g)
At 25∘C, the total pressure of the gases in equilibrium with the solid is 0.116 atm.If 0.1 atm of CO2 is introduced after equilibrium is reached then :
View SolutionThe value of KP for
NH2COONH4(s)⇔2NH3(g)+CO2(g)
if the total pressure at equilibrium is P :−
View SolutionNH4COONH4(s)⇔2NH3(g)+CO2(g). for the
above reaction, Kp is 4, Kc will be
View SolutionSolid Ammonium carbamate dissociates as:
NH2COONH4(s)⇔2NH3(g)+CO2(g).
In a closed vessel, solid ammonium carbonate is in equilibrium with its dissociation products. At equilibrium, ammonia is added such that the partial pressure of NH3 at new equilibrium now equals the original total pressure. Calculate the ratio of total pressure at new equilibrium to that of original total pressure. Also find the partial pressure of ammonia gas added.
View SolutionSolid Ammonium carbamate dissociates as:
NH2COONH4(s)⇔2NH3(g)+CO2(g).
In a closed vessel, solid ammonium carbamate is in equilibrium with its dissociation products. At equilibrium, ammonia is added such that the partial pressure of NH3 at new equilibrium now equals the original total pressure. Calculate the ratio of total pressure at new equilibrium to that of original total pressure.
View SolutionSolid ammonium carbamate dissociated according to the given reaction
NH2COONH4(s)⇔2NH3(g)+CO(g)
Total pressure of the gases in equilibrium is 5 atm. Hence Kp.
View SolutionSolid ammonium carbamate NH2COONH4 was taken in excess in closed container according to the following reaction
NH2COONH4(s)⇔2NH3(g)+CO2(g). If equilibrium pressure is 4 atm, it's equilibrium constnat KP is ?
View SolutionSolid ammonium carbamate (NH_(4)COONH__(4)) was taken in excess in closed container according to the following reaction
NH_(2)COONH_(4)(s)hArr2NH_(3)(g)+CO_(2)(g). If equilibrium pressure is 4 atm, it's equilibrium constnat K_(P) is ?
View SolutionThe decomposition of solid ammonium carbamate, (NH4)(NH2CO2), to gaseous ammonia and carbon dioxide is an endothermic reaction.
9NH4)(NH2CO2))(s)⇔2NH3(g)+CO2(g)
(a) When solid (NH4)(NH2CO2) is introduced into and evacuated flask at 25∘C, the total pressure of gas at equilibrium is 0.3 atm. What is the value of Kpat25∘C?
View SolutionNH4COONH2(s)⇔2NH3(g)+CO2(g) If equilibrium pressure is 3 atm for the above reaction, then Kp for the reaction is
View Solution
