In a complexometric titration of metal ion with ligand
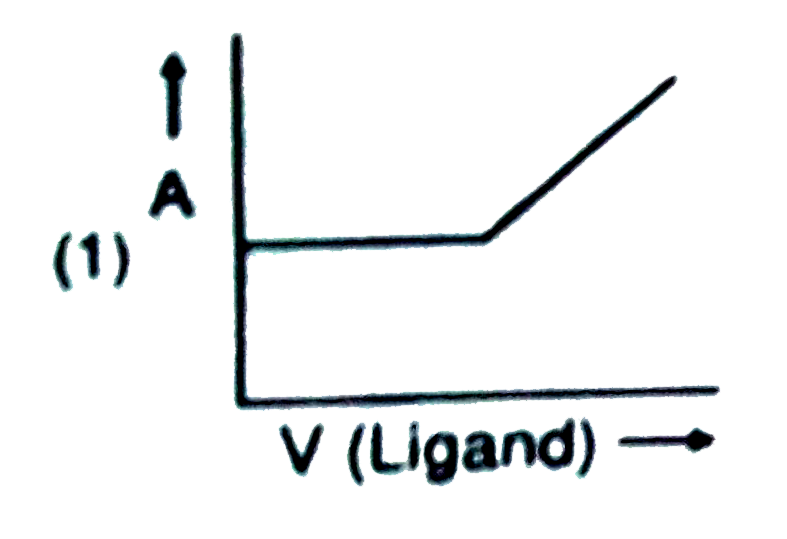
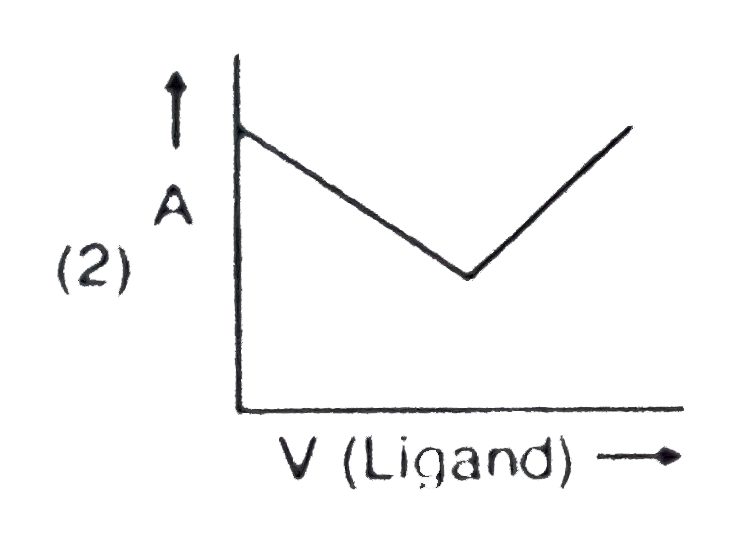
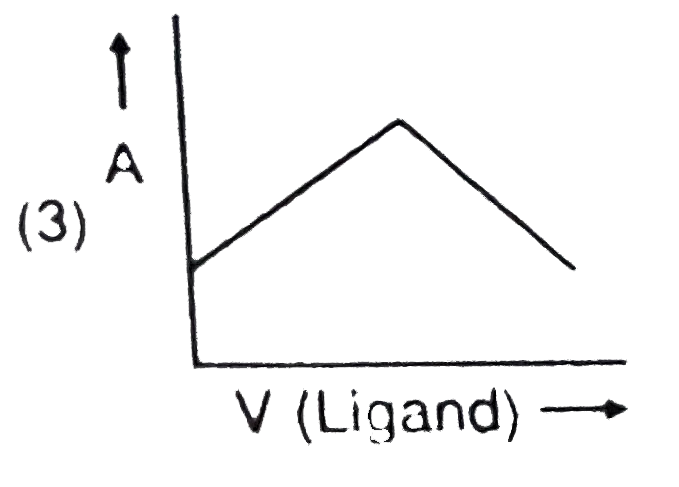
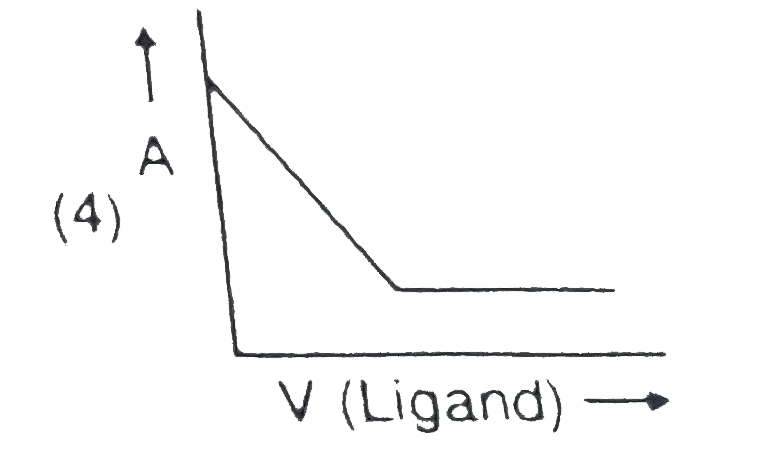
end point is estimated spectrophotometrically (through light absorption). If 'M' and 'C' do not absorb light and only 'L' absorbs, then the titration plot between absorbed light(A) versus volume of ligand 'L' (V) would look like :


The correct Answer is:A
To solve the problem, we need to analyze the behavior of the system during the complexometric titration of a metal ion (M) with a ligand (L), where the metal ion (M) and the resulting complex (C) do not absorb light, but the ligand (L) does.
1. Understanding the Reaction:
- The reaction can be represented as:
M+L→C
- Here, M is the metal ion, L is the ligand, and C is the complex formed.
2. Initial Conditions:
- At the start of the titration, only the ligand (L) is present, and it absorbs light. Therefore, the initial absorption (A) will be at its maximum because no complex (C) has formed yet.
3. Titration Process:
- As we add the ligand (L) to the metal ion (M), the ligand starts to react with the metal ion to form the complex (C).
- As more ligand is added, the concentration of free ligand (L) decreases because it is being converted into the complex (C).
4. Absorption Changes:
- Since only the ligand (L) absorbs light, as it gets converted into the complex (C), the absorption (A) will decrease initially.
- However, as the reaction progresses and more ligand is converted into the complex, the absorption will begin to increase again because the complex (C) will eventually reach a point where it is stable and does not absorb light.
5. Endpoint of Titration:
- At the endpoint of the titration, all the ligand (L) will have reacted with the metal ion (M) to form the complex (C).
- After reaching the endpoint, if more ligand is added, the absorption will remain constant because there will be no free ligand left to absorb light.
6. Plotting the Graph:
- The plot of absorbed light (A) versus the volume of ligand (V) will show an initial increase in absorption as ligand is added, followed by a plateau when the complex formation is complete.
- The graph will start at a certain absorption level, rise to a peak, and then level off as the reaction reaches completion.
Conclusion:
The titration plot between absorbed light (A) versus volume of ligand (L) will show an initial increase followed by a plateau, indicating that the endpoint has been reached and no further increase in absorption occurs.
- The reaction can be represented as:
M+L→C
- Here, M is the metal ion, L is the ligand, and C is the complex formed.
- At the start of the titration, only the ligand (L) is present, and it absorbs light. Therefore, the initial absorption (A) will be at its maximum because no complex (C) has formed yet.
- As we add the ligand (L) to the metal ion (M), the ligand starts to react with the metal ion to form the complex (C).
- As more ligand is added, the concentration of free ligand (L) decreases because it is being converted into the complex (C).
- Since only the ligand (L) absorbs light, as it gets converted into the complex (C), the absorption (A) will decrease initially.
- However, as the reaction progresses and more ligand is converted into the complex, the absorption will begin to increase again because the complex (C) will eventually reach a point where it is stable and does not absorb light.
- At the endpoint of the titration, all the ligand (L) will have reacted with the metal ion (M) to form the complex (C).
- After reaching the endpoint, if more ligand is added, the absorption will remain constant because there will be no free ligand left to absorb light.
- The plot of absorbed light (A) versus the volume of ligand (V) will show an initial increase in absorption as ligand is added, followed by a plateau when the complex formation is complete.
- The graph will start at a certain absorption level, rise to a peak, and then level off as the reaction reaches completion.
The titration plot between absorbed light (A) versus volume of ligand (L) will show an initial increase followed by a plateau, indicating that the endpoint has been reached and no further increase in absorption occurs.
Topper's Solved these Questions
- COORDINATION COMPOUNDSBOOK - RESONANCE ENGLISHCHAPTER - COORDINATION COMPOUNDSEXERCISE - Additional Problem for Self Practice (APSP) Part-I
29 Videos
- COORDINATION COMPOUNDSBOOK - RESONANCE ENGLISHCHAPTER - COORDINATION COMPOUNDSEXERCISE - Additional Problem for Self Practice (APSP) Part-II
61 Videos
- COORDINATION COMPOUNDSBOOK - RESONANCE ENGLISHCHAPTER - COORDINATION COMPOUNDSEXERCISE - Exercise-3 Part-II: JEE(Main ) /AIEEE Problem
36 Videos
- CHEMISTRY IN EVERYDAY LIFEBOOK - RESONANCE ENGLISHCHAPTER - CHEMISTRY IN EVERYDAY LIFEEXERCISE - ORGANIC CHEMISTRY(Chemistry in every day life)
31 Videos
- D & F BLOCK ELEMENTSBOOK - RESONANCE ENGLISHCHAPTER - D & F BLOCK ELEMENTSEXERCISE - ORGANIC CHEMISTRY(Aldehydes , Ketones, Carboxylic acid)
15 Videos
Similar Questions
Homoleptic octahedral complexes of a metal ion 'M3+' with three monodentate ligands L1,L2 and L3 absorb wavelengths in the region of green, blue and red respectively. The increasing order of the ligand strength is :
View SolutionHomoleptic octahedral complexes of a metal ion 'M3+' with three monodentate ligands L1,L2 and L3 absorb wavelengths in the region of green, blue and red respectively. The increasing order of the ligand strength is :
View SolutionA. According to C.FT complex compound contain point charges
R: The bonding between central metal ion and ligand is electrostatic
View SolutionParamagnetism is a property due to the presence of unpaired electrons. In case of transition metals, as they contain unpaired electrons in the (n−1) d orbitals , most of the transition metal ions and their compounds are paramagnetic. Para magnetism increases with increases in number of unpaired electrons. Magnetic moment is calculated from 'spin only formula' Vz
μ=√n(n+2)B.Mn=number of unpaired electrons
Similarly the colour of the compounds of transition metals may be attributed to the presence of incomplete (n−1) d sub-shell. When an electron from a lower energy of d-orbitals is excited to a higher energy d-orbital, the energy of excitation corresponds to the frequency of light absorbed. This frequency generally lies in the visible region. The colour observed corresponds to complementary colour of the light observed. The frequency of the light absorbed is determined by the nature of the ligand.
Titanium shows magnetic moments of 1.73BM in its compound. What is the oxidation state of titanium in the compound?
View SolutionParamagnetism is a property due to the presence of unpaired electrons. In case of transition metals, as they contain unpaired electrons in the (n−1) d orbitals , most of the transition metal ions and their compounds are paramagnetic .Para magnetism increases with increases in number of unpaired electrons. Magnetic moment is calculated from 'spin only formula' Vz
μ=√n(n+2)B.Mn=number of unpaired electrons
Similarly the colour of the compounds of transition metals may be attributed to the presence of incomplete (n−1) d sub-shell. When an electron from a lower energy of d-orbitals is excited to a higher energy d-orbital, the energy of excitation corresponds to the frequency of light absorbed. This frequency generally lies in the visible region. The colour observed corresponds to complementary colour of the light observed. The frequency of the light absorbed is determined by the nature of the ligand.
The colourless species is:
View SolutionParamagnetism is a property due to the presence of unpaired electrons. In case of transition metals, as they contain unpaired electrons in the (n−1) d orbitals,most of the transition metal ions and their compounds are paramagnetic .Para magnetism increases with increases in number of unpaired electrons. Magnetic moment is calculated from spin only formula' Vz
μ=√n(n+2)B.M<br>n=number of unpaired electrons
Similarly the colour of the compounds of transition metals may be attributed to the presence of incomplete (n−1) d sub-shell. When an electron from a lower energy of d-orbitals is excited to a higher energy d-orbital, the energy of excitation corresponds to the frequency of light absorbed. This frequency generally lies in the visible region. The colour observed corresponds to complementary colour of the light observed. The frequency of the light absorbed is determined by the nature of the ligand.
Which of the following pair of Compounds is expected to exhibit same colour in aqueous solution
View SolutionParamagnetism is a property due to the presence of unpaired electrons. In case of transition metals, as they contain unpaired electrons in the (n−1) d orbitals , most of the transition metal ions and their compounds are paramagnetic.Paramagnetism increases with increases in number of unpaired electrons. Magnetic moment is calculated from 'spin only formula' Vz
μ=√n(n+2)B.Mn=number of unpaired electrons
Similarly the colour of the compounds of transition metals may be attributed to the presence of incomplete (n−1) d sub-shell. When an electron from a lower energy of d-orbitals is excited to a higher energy d-orbital, the energy of excitation corresponds to the frequency of light absorbed. This frequency generally lies in the visible region. The colour observed corresponds to complementary colour of the light observed. The frequency of the light absorbed is determined by the nature of the ligand.
Identify the correct statement.
View SolutionA metal foil is at a certain distance from an isotropic point source that emits energy at the rate P. Let us assume the classical physics to be applicable. The incident light energy will be absorbed continuously and smoothly. The electrons present in the foil soak up the energy incident on them. For simplicity , we can assume that the energy incident on a circular path of the foil with radius 5×10⁻¹¹m (about that of a typical atom ) is absorbed by a single electron. The electron absorbs sufficient energy to break through the binding forces and comes out from the foil. By knowing the work function, we can calculate the time taken by an electron to come out i.e., we can find out the time taken by photoelectric emission to start. As you will see in the following questions, the time decay comes out to be large, which is not practically observed. The time lag is very small. Apparently, the electron does not have to soak up energy . It absorbs energy all at once in a single photon electron interaction.
if work function of the metal of the foil is 2.2 eV, the time taken by electron to come out is nearly
View SolutionA metal foil is at a certain distance from an isotropic point source that emits energy at the rate P. Let us assume the classical physics to be applicable. The incident light energy will be absorbed continuously and smoothly. The electrons present in the foil soak up the energy incident on them. For simplicity , we can assume that the energy incident on a circular path of the foil with radius 5×10⁻¹¹m (about that of a typical atom ) is absorbed by a single electron. The electron absorbs sufficient energy to break through the binding forces and comes out from the foil. By knowing the work function, we can calculate the time taken by an electron to come out i.e., we can find out the time taken by photoelectric emission to start. As you will see in the following questions, the time decay comes out to be large, which is not practically observed. The time lag is very small. Apparently, the electron does not have to soak up energy . It absorbs energy all at once in a single photon electron interaction.
If power of the source P is 1.5 W and distance of the foil from the source is 3.5 m, the energy received by an electron per second is
View SolutionThe lens governing the behavior of the rays namely rectilinear propagation laws of reflection and refraction can be summarised in one fundamental law known as Fermat's principle. According to this principle a ray of light travels from one point to another such that the time taken is at a stationary value (maximum or minimum).
if c is the velocity of light in a vacuum the velocity in a medium of refractive index μ is cμ hence time taken to travel a distance l is μlc if the light passes through a number of media, the total time taken is (1c)∑μl or 1c∫μdl if refractive index varies continuously. Now ∑μl is the total path, so that fermat's principle states that the path of a ray is such that the optical path in at a stationary value. this principle is obviously in agreement with the fact that the ray are straight lines i a homogenous isotropic medium. it is found that it also agrees with the classical laws of reflection and refraction.
Q. If refractive index of a slab varies as μ=1+x2 where x is measured from one end then optical path length of a slab of thickness 1 m is
View Solution
