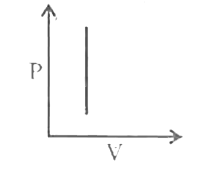
Draw p-V diagram showing positive work at constant pressure.
To solve the question of drawing a p-V diagram showing positive work at constant pressure, we can follow these steps:
1. Understand the Isobaric Process:
- An isobaric process is one where the pressure remains constant throughout the process. This means that during the entire process, the pressure (P) does not change.
Hint: Remember that in an isobaric process, the pressure line is horizontal on a p-V diagram.
2. Set Up the Axes:
- Draw a graph with the vertical axis representing pressure (P) and the horizontal axis representing volume (V). Label the axes appropriately.
Hint: The vertical axis (P) should be labeled with units (e.g., atm, Pa), and the horizontal axis (V) should also have units (e.g., liters, m³).
3. Draw the Constant Pressure Line:
- Choose a constant pressure value, for example, 5 atm. Draw a horizontal line across the graph at this pressure level. This line represents the constant pressure during the process.
Hint: Ensure that the line is straight and horizontal, indicating that pressure does not change as volume changes.
4. Indicate the Initial and Final States:
- Mark two points on the horizontal line: Point A (initial state) and Point B (final state). Ensure that Point B is to the right of Point A, indicating an increase in volume.
Hint: Label the points clearly as A (V1) and B (V2) to show the initial and final volumes.
5. Show the Direction of Work Done:
- Since we want to show positive work, the volume must increase (V2 > V1). Draw an arrow from Point A to Point B along the horizontal line to indicate the direction of the process.
Hint: The arrow signifies that work is done by the system as it expands against the constant pressure.
6. Calculate Work Done:
- The work done (W) during an isobaric process can be calculated using the formula:
W=P×(V2−V1)
- Since V2 > V1, the work done is positive.
Hint: Remember that positive work indicates that the system is doing work on the surroundings, which corresponds to expansion.
Final Diagram:
- Your final p-V diagram should show a horizontal line at the chosen constant pressure with two points (A and B) indicating the initial and final states, and an arrow pointing from A to B.
- An isobaric process is one where the pressure remains constant throughout the process. This means that during the entire process, the pressure (P) does not change.
- Draw a graph with the vertical axis representing pressure (P) and the horizontal axis representing volume (V). Label the axes appropriately.
- Choose a constant pressure value, for example, 5 atm. Draw a horizontal line across the graph at this pressure level. This line represents the constant pressure during the process.
- Mark two points on the horizontal line: Point A (initial state) and Point B (final state). Ensure that Point B is to the right of Point A, indicating an increase in volume.
- Since we want to show positive work, the volume must increase (V2 > V1). Draw an arrow from Point A to Point B along the horizontal line to indicate the direction of the process.
- The work done (W) during an isobaric process can be calculated using the formula:
W=P×(V2−V1)
- Since V2 > V1, the work done is positive.
- Your final p-V diagram should show a horizontal line at the chosen constant pressure with two points (A and B) indicating the initial and final states, and an arrow pointing from A to B.
Topper's Solved these Questions
- QUESTION BANK 2021BOOK - NAVNEET PUBLICATION - MAHARASHTRA BOARDCHAPTER - QUESTION BANK 2021EXERCISE - Thermodynamics ( Short Answer II (SA2) ( 3 MARKS Each ) )
13 Videos
- QUESTION BANK 2021BOOK - NAVNEET PUBLICATION - MAHARASHTRA BOARDCHAPTER - QUESTION BANK 2021EXERCISE - Thermodynamics (Long Answer ( LA) ( 4 marks Each) )
5 Videos
- QUESTION BANK 2021BOOK - NAVNEET PUBLICATION - MAHARASHTRA BOARDCHAPTER - QUESTION BANK 2021EXERCISE - Thermodynamics (Very Short Answer (VSA) ( 1 MARK Each ) )
12 Videos
- MULTIPLE CHOICE QUESTIONSBOOK - NAVNEET PUBLICATION - MAHARASHTRA BOARDCHAPTER - MULTIPLE CHOICE QUESTIONSEXERCISE - Communication Systems
6 Videos
- SHORT ANSWER QUESTIONSBOOK - NAVNEET PUBLICATION - MAHARASHTRA BOARDCHAPTER - SHORT ANSWER QUESTIONSEXERCISE - Assignments
3 Videos
Similar Questions
Draw p-V diagram showing positive work with varying pressure.
View SolutionDraw p-V diagram showing negative work with varying pressure.
View SolutionExplain graphically positive work at constant pressure.
View SolutionDraw p-V diagram of reversible process.
View SolutionDraw diagrams showing reproduction in yeast in proper sequence.
View SolutionDraw a neat diagram showing the motion of a simple pendulum. Mark its mean position and extreme positions in the diagram.
View SolutionDraw a ray diagram to show the position and nature of the image formed in the above case.
View SolutionDraw a diagram to show spore formation in Rhizopus
View SolutionDraw p-V diagram of irreversible process.
View SolutionThe graph of a thermodynamic process is a straight line parallel to pressure axis in P - V diagram. What is the work done in that process ?

View Solution
