The secular trend component of time series represents irregular variations.(True/False)
Video Solution
Text Solution
The correct Answer is:F
|
Answer
Step by step video, text & image solution for The secular trend component of time series represents irregular variations.(True/False) by Maths experts to help you in doubts & scoring excellent marks in Class 12 exams.
Updated on:21/07/2023Topper's Solved these Questions
- QUESTION BANK 2021BOOK - NAVNEET PUBLICATION - MAHARASHTRA BOARDCHAPTER - QUESTION BANK 2021EXERCISE - Part II 4. TIME SERIES (IV) Solve the following problems.)
6 Videos
- QUESTION BANK 2021BOOK - NAVNEET PUBLICATION - MAHARASHTRA BOARDCHAPTER - QUESTION BANK 2021EXERCISE - Part II 4. TIME SERIES (V) Activity based questions)
4 Videos
- QUESTION BANK 2021BOOK - NAVNEET PUBLICATION - MAHARASHTRA BOARDCHAPTER - QUESTION BANK 2021EXERCISE - Part II 4. TIME SERIES (II) Fill in the blanks
5 Videos
- PROBABILITY DISTRIBUTIONBOOK - NAVNEET PUBLICATION - MAHARASHTRA BOARDCHAPTER - PROBABILITY DISTRIBUTIONEXERCISE - MULTIPLE CHOICE QUESTIONS
9 Videos
- THREE DIMENSIONAL GEOMETRY BOOK - NAVNEET PUBLICATION - MAHARASHTRA BOARDCHAPTER - THREE DIMENSIONAL GEOMETRY EXERCISE - MULTIPLE CHOICE QUESTIONS
8 Videos
Similar Questions
Knowledge Check
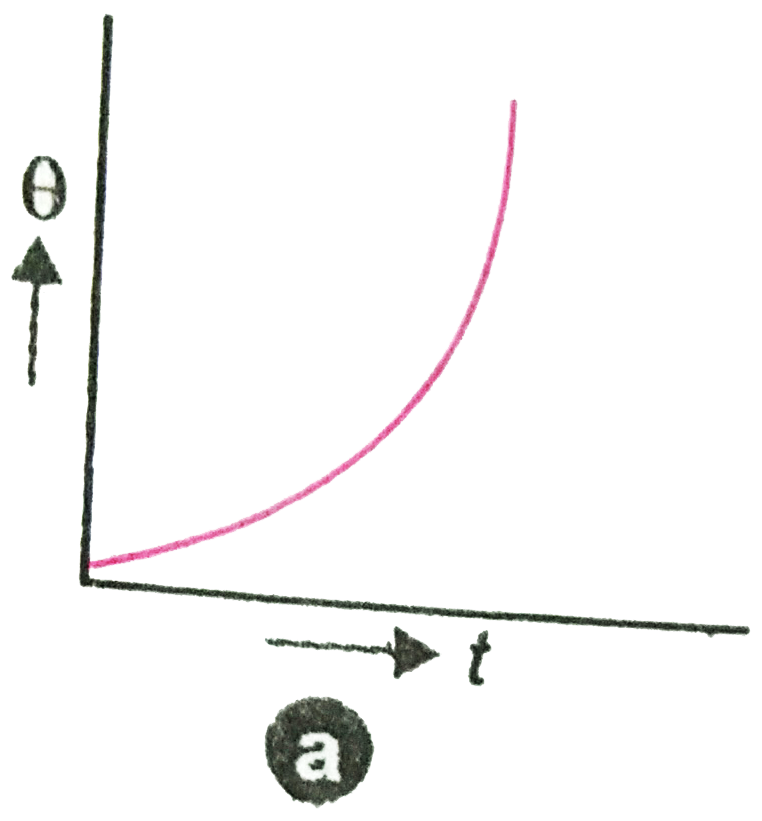
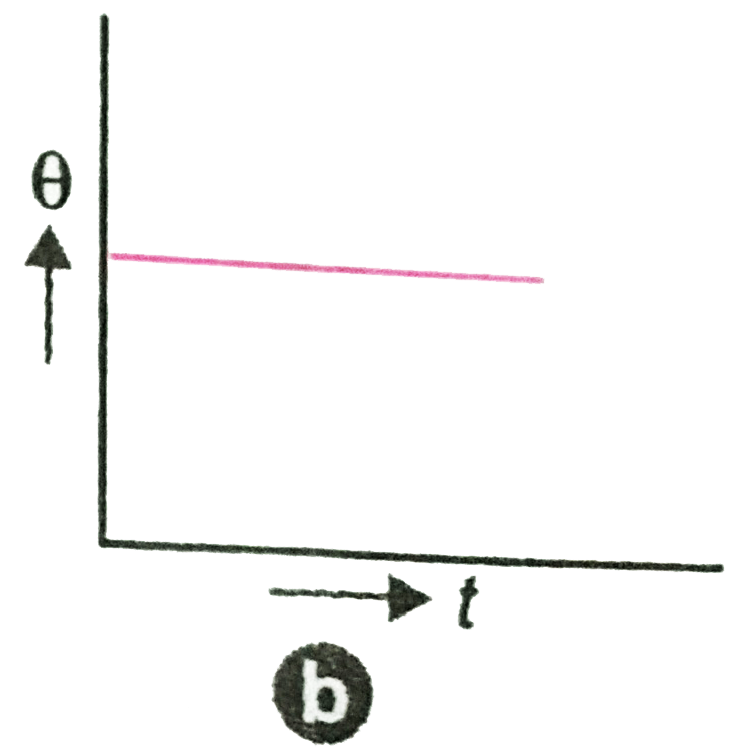
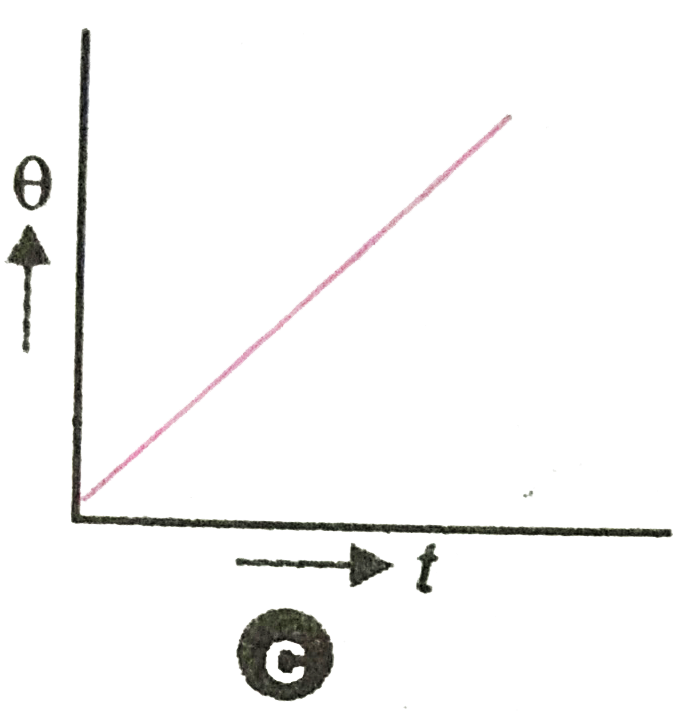
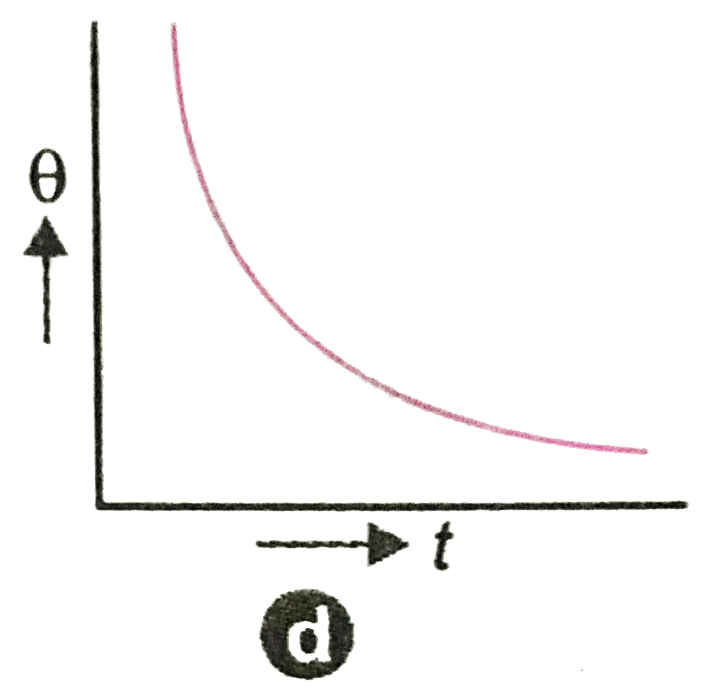
The variation of temperature of a liquid with time is represented correctly by (figure)
A B
B C
C D
D
Which of the following can’t be a component of a time series?
ASeasonalityBCyclicalCTrendDMeanWhich component of time series refers to erratic time series movements that follow no recognizable or regular pattern?
ATrendBSeasonalCCyclicalDIrregular
_________ components of time series is indicated by a smooth line.
View SolutionThe width of a rectangle in a histogram represents frequently of the class. (True / False)
View SolutionSeasonal variation can be observed over several years. (True/False)
View SolutionThe method of measuring trend of time series using only averages is _____
View SolutionThe graph shown the variation with times t of the velocity v of an object . Which one of the following graphs best represents the variation of acceleration a of the object with time t?

View Solution
