f:(0,∞)→(−π2,π2) be defined as, f(x)=tan−1(logex).
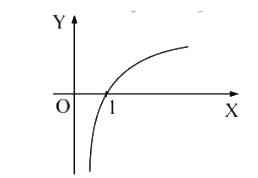
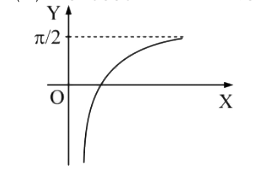
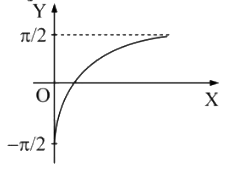
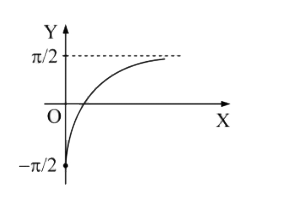
The graph of y = f (x) is best represented by


The correct Answer is:C
To analyze the function f(x)=tan−1(logex) and determine the behavior of its graph, we will follow these steps:
Step 1: Determine the limit of f(x) as x approaches 0 from the right.
We start by evaluating f(x) as x approaches 0 from the right:
limx→0+f(x)=limx→0+tan−1(logex)
As x approaches 0, logex approaches −∞. Therefore:
limx→0+f(x)=tan−1(−∞)=−π2
Step 2: Determine the limit of f(x) as x approaches infinity.
Next, we evaluate f(x) as x approaches infinity:
limx→∞f(x)=limx→∞tan−1(logex)
As x approaches infinity, logex approaches +∞. Therefore:
limx→∞f(x)=tan−1(∞)=π2
Step 3: Analyze the behavior of f(x) in the interval (0,∞).
Since f(x) is continuous in the interval (0,∞) and we have established the limits at both ends:
- As x→0+, f(x)→−π2
- As x→∞, f(x)→π2
Step 4: Conclusion about the graph of f(x).
The function f(x) is increasing because the logarithm function is increasing and the arctangent function is also increasing. Therefore, the graph of f(x) will start from −π2 at x=0 and approach π2 as x goes to infinity.
Final Answer:
The graph of y=f(x) is best represented by a curve that starts from −π2 and approaches π2 as x increases.
---
- As x→∞, f(x)→π2
Topper's Solved these Questions
- DIFFERENTIAL CALCULUS 2BOOK - VMC MODULES ENGLISHCHAPTER - DIFFERENTIAL CALCULUS 2EXERCISE - Numerical ValueType for JEE Main
14 Videos
- DIFFERENTIAL CALCULUS 2BOOK - VMC MODULES ENGLISHCHAPTER - DIFFERENTIAL CALCULUS 2EXERCISE - JEE Main (Archive)
36 Videos
- DIFFERENTIAL CALCULUS 2BOOK - VMC MODULES ENGLISHCHAPTER - DIFFERENTIAL CALCULUS 2EXERCISE - Level -1
102 Videos
- DIFFERENTIAL CALCULUSBOOK - VMC MODULES ENGLISHCHAPTER - DIFFERENTIAL CALCULUSEXERCISE - JEE Advanced (Archive)
75 Videos
- DIFFERENTIAL EQUATIONSBOOK - VMC MODULES ENGLISHCHAPTER - DIFFERENTIAL EQUATIONSEXERCISE - JEE ADVANCE (ARCHIVE )
32 Videos
Similar Questions
f:(0,∞)→(−π2,π2) be defined as, f(x)=tan−1(logex).
The above function can be classified as :
View Solutionf:(0,∞)→(−π2,π2) be defined as, f(x)=tan−1(logex).
If x1,x2andx3 are the points at which g(x) =[f (x)] is discontinuous (where, [.] denotes the greatest integer function), then (x1+x2+x3) is :
View SolutionLet f:R→[0,π2) be defined by f(x)=tan−1(3x2+6x+a). If f(x) is an onto function . then the value of a si
View SolutionLet f:I−{−1,0,1}→[−π,π] be defined as f(x)=2tan−1x−tan−1(2x1−x2), then which of the following statements (s) is (are) correct ?
View SolutionLet f:(e,∞)→R be defined by f(x)=ln(ln(Inx)), then
View SolutionLet f:(−π2,π2)→R be given by f(x)=(log(secx+tanx))3 Then which of the following is wrong?
View SolutionLet f:R→[0,π2) be defined by f(x)=tan−1(x2+x+a). Then the set of values of a for which f is onto is (a)(0,∞) (b) [2,1] (c) [14,∞] (d) none of these
View SolutionIf f:[0,∞)→[2,∞) be defined by f(x)=x2+2,∀×∈R. Then find f−1.
View SolutionLet a function f:R→R be defined as f(x)=x+sinx. The value of ∫2π0f−1(x)dx will be:
View SolutionThe function f(x)=ln(π+x)ln(e+x) is
View Solution
