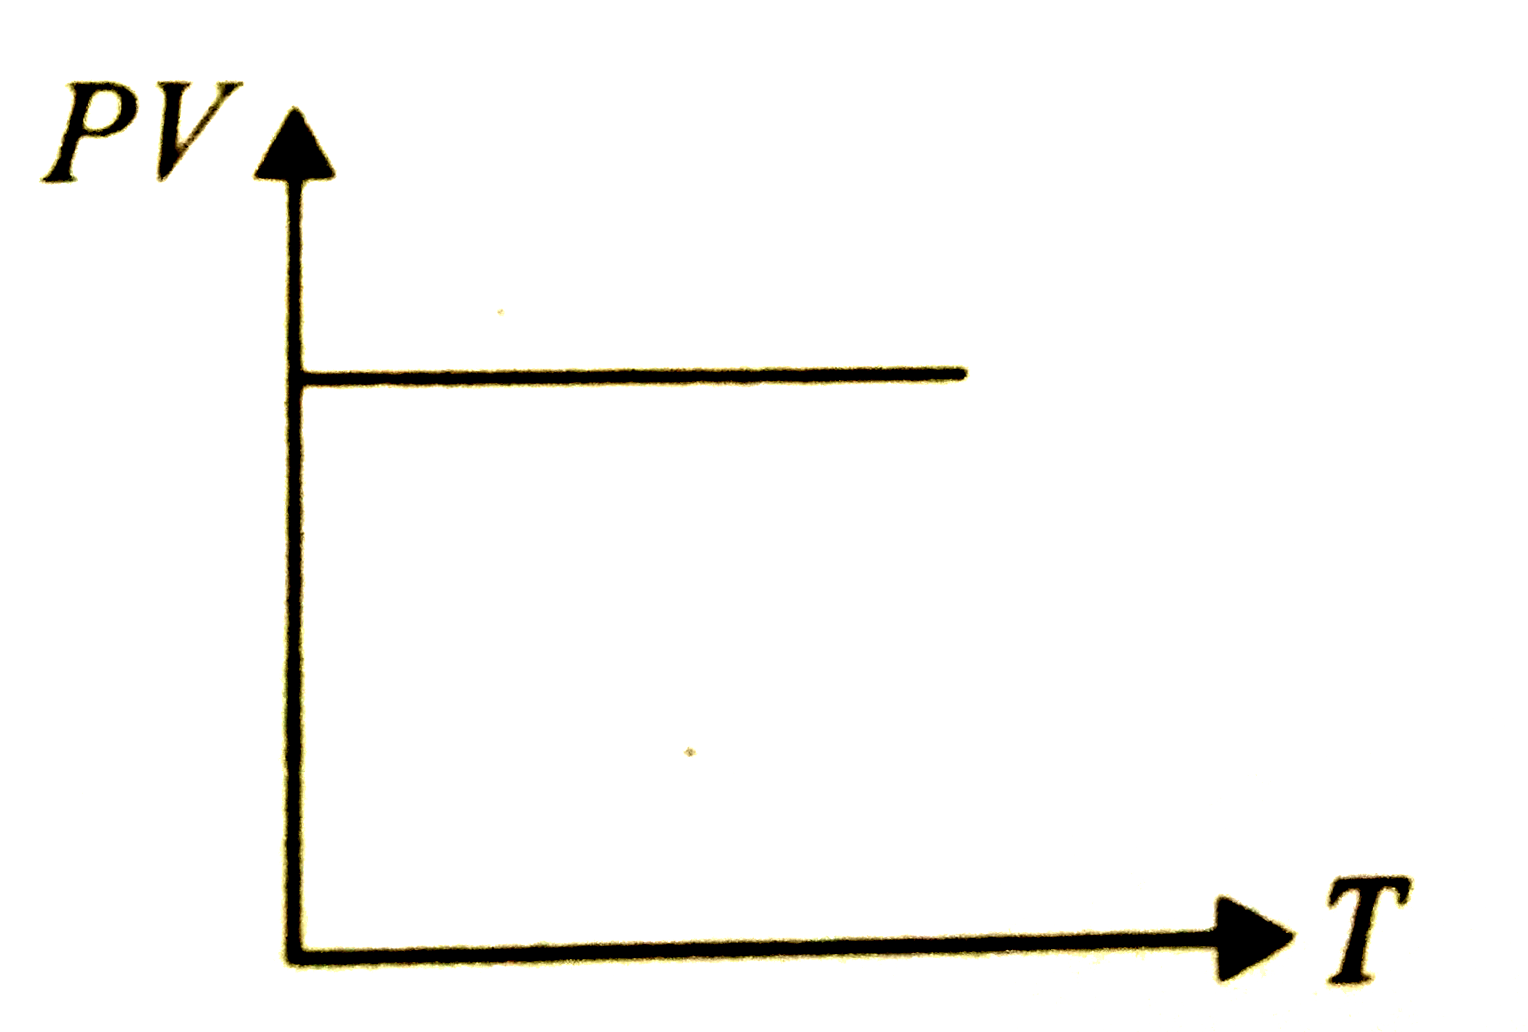
For an ideal gas which of the following graphs will not be straight line when all the other variables are held constant?
P vs T
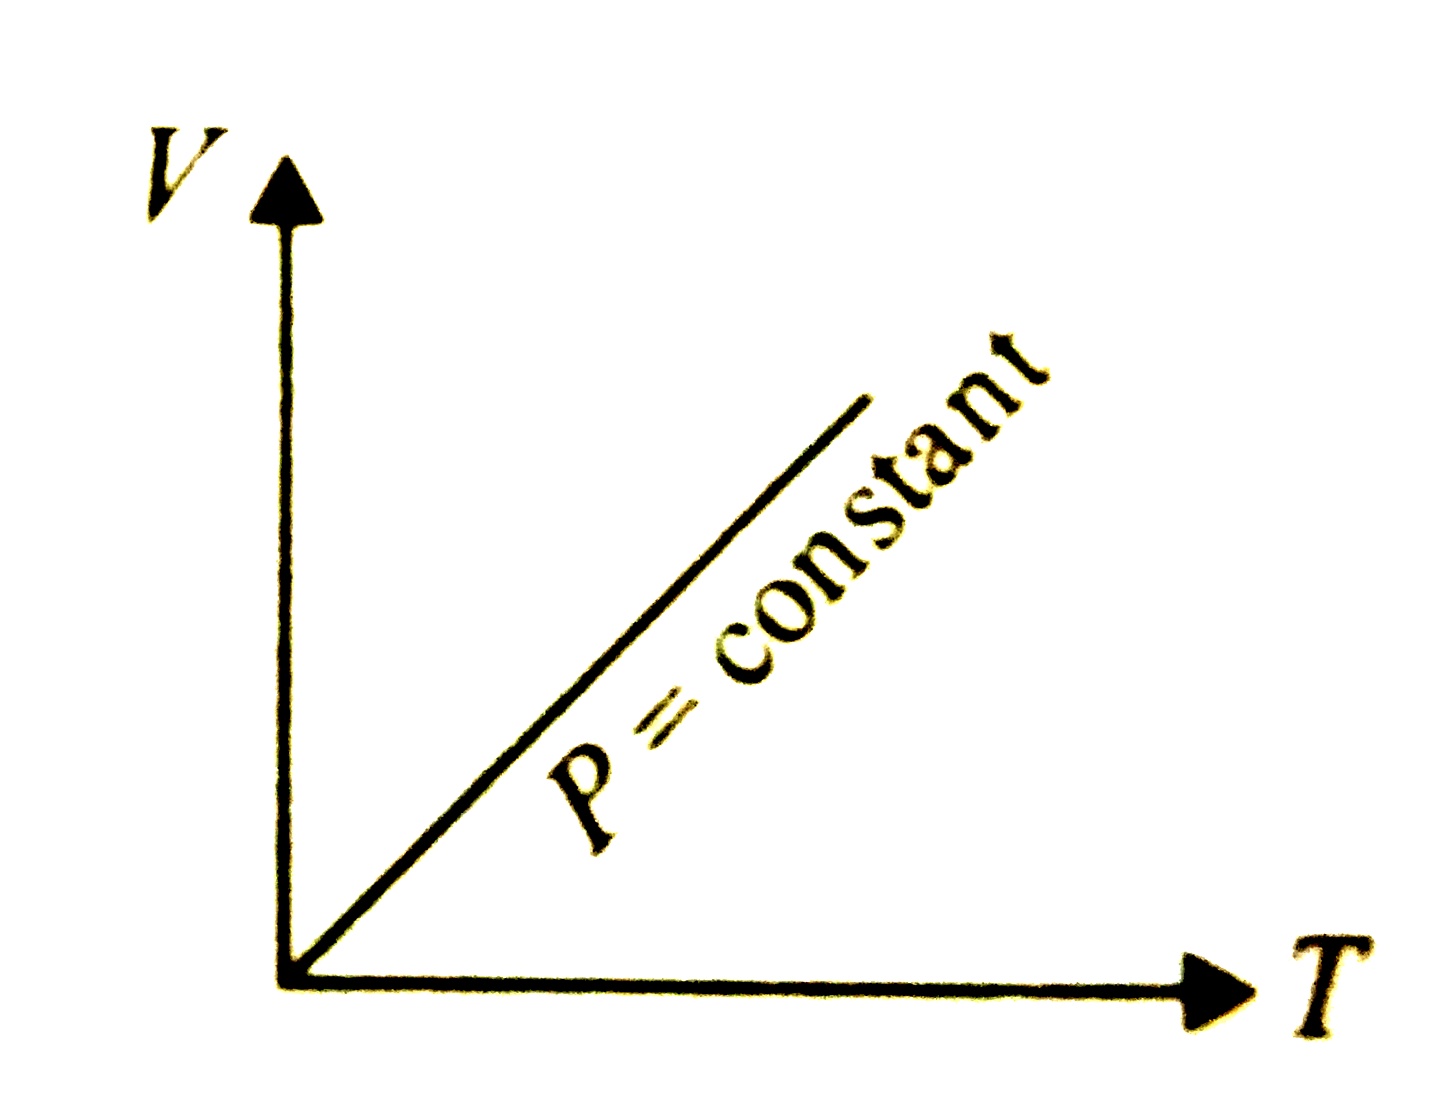
V vs T
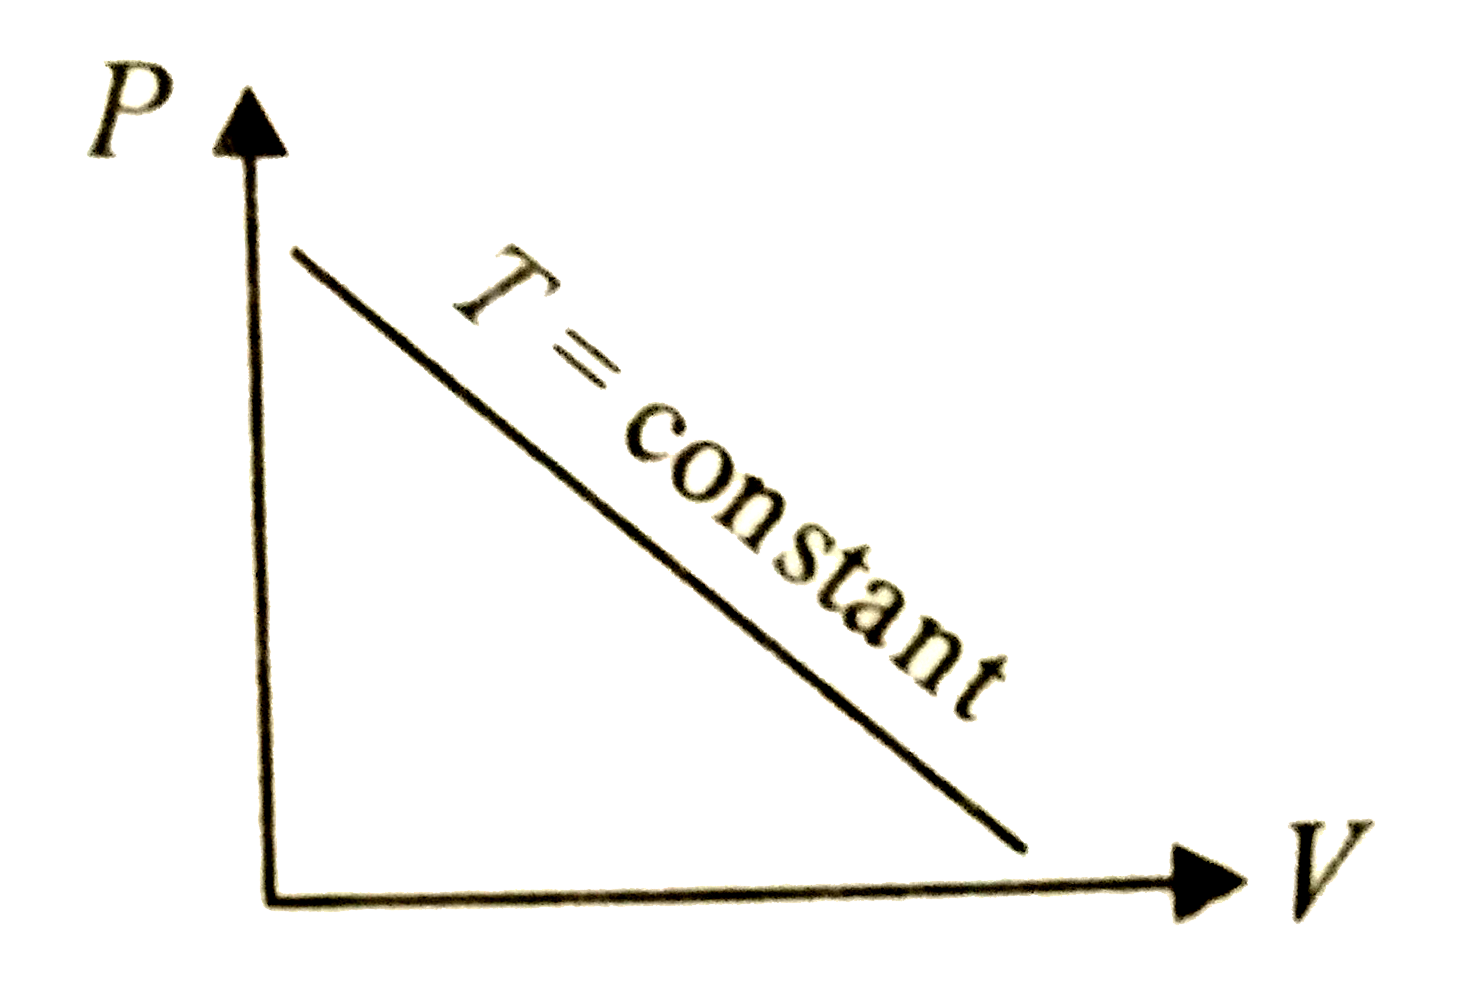
P vs 1/V
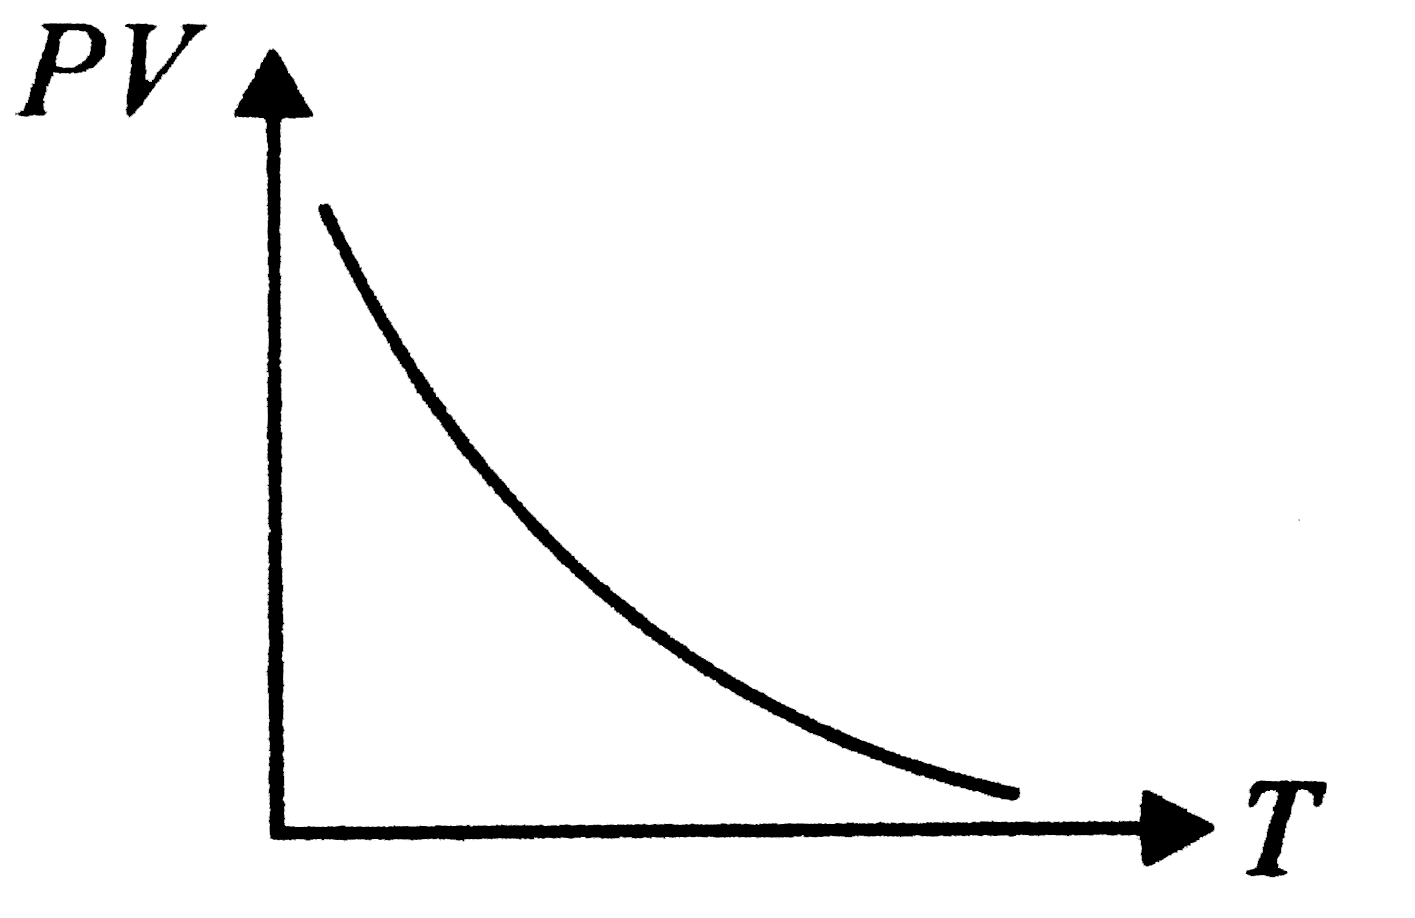
n vs T
The correct Answer is:D
To determine which graph will not be a straight line for an ideal gas when all other variables are held constant, we can analyze each option based on the ideal gas law, which is given by the equation:
PV=nRT
Where:
- P = Pressure
- V = Volume
- n = Number of moles
- R = Universal gas constant
- T = Absolute temperature
Now, let's analyze each graph one by one:
Step 1: Analyze P vs T Graph
- Variables Held Constant: Volume (V) and Number of Moles (n)
- Relationship: According to Gay-Lussac's Law, pressure is directly proportional to temperature when volume and number of moles are constant.
- Conclusion: This graph will be a straight line.
Step 2: Analyze V vs T Graph
- Variables Held Constant: Pressure (P) and Number of Moles (n)
- Relationship: According to Charles' Law, volume is directly proportional to temperature when pressure and number of moles are constant.
- Conclusion: This graph will also be a straight line.
Step 3: Analyze P vs 1/V Graph
- Variables Held Constant: Temperature (T) and Number of Moles (n)
- Relationship: According to Boyle's Law, pressure is inversely proportional to volume, which can be expressed as P∝1V when temperature and number of moles are constant.
- Conclusion: This graph will also be a straight line.
Step 4: Analyze N vs T Graph
- Variables Held Constant: Pressure (P) and Volume (V)
- Relationship: From the ideal gas equation, if PV=nRT is rearranged to n=PVRT, we see that number of moles (n) is inversely proportional to temperature (T) when pressure and volume are constant.
- Conclusion: This graph will not be a straight line; it will be a hyperbola.
Final Answer
The graph that will not be a straight line when all other variables are held constant is N vs T (option 4).
---
- P = Pressure
- V = Volume
- n = Number of moles
- R = Universal gas constant
- T = Absolute temperature
- Variables Held Constant: Volume (V) and Number of Moles (n)
- Relationship: According to Gay-Lussac's Law, pressure is directly proportional to temperature when volume and number of moles are constant.
- Conclusion: This graph will be a straight line.
- Variables Held Constant: Pressure (P) and Number of Moles (n)
- Relationship: According to Charles' Law, volume is directly proportional to temperature when pressure and number of moles are constant.
- Conclusion: This graph will also be a straight line.
- Variables Held Constant: Temperature (T) and Number of Moles (n)
- Relationship: According to Boyle's Law, pressure is inversely proportional to volume, which can be expressed as P∝1V when temperature and number of moles are constant.
- Conclusion: This graph will also be a straight line.
- Variables Held Constant: Pressure (P) and Volume (V)
- Relationship: From the ideal gas equation, if PV=nRT is rearranged to n=PVRT, we see that number of moles (n) is inversely proportional to temperature (T) when pressure and volume are constant.
- Conclusion: This graph will not be a straight line; it will be a hyperbola.
The graph that will not be a straight line when all other variables are held constant is N vs T (option 4).
Topper's Solved these Questions
- STATES OF MATTERBOOK - VMC MODULES ENGLISHCHAPTER - STATES OF MATTEREXERCISE - Level-2
50 Videos
- STATES OF MATTERBOOK - VMC MODULES ENGLISHCHAPTER - STATES OF MATTEREXERCISE - Level-2 (NUMBERICAL VALUE TYPE FOR JEE MAIN
15 Videos
- STATES OF MATTERBOOK - VMC MODULES ENGLISHCHAPTER - STATES OF MATTEREXERCISE - LEVEL -0 (Short Answer Type-II)
27 Videos
- STATES OF MATTERBOOK - VMC MODULES ENGLISHCHAPTER - STATES OF MATTEREXERCISE - IMPECCABLE
50 Videos
- STOICHIOMETRY - IBOOK - VMC MODULES ENGLISHCHAPTER - STOICHIOMETRY - IEXERCISE - JEE Advanced (Archive)
31 Videos
Similar Questions
Knowledge Check
Which of the following graph yield a straight line?
Ax/m vs pBlog x/m vs pCx/m vs log pDlog x/m vs log pWhich of the following graphs represent the behaviour of an ideal gas ?
A1. B2.
B2. C3.
C3. D4.
D4.
Which of the following is a straight line graph?
View SolutionWhich of the following graphs is consistent with ideal gas behaviour?
View SolutionWhich of the following graph does not belong to isothermal process for an ideal gas?
View SolutionWhich of the following graph for a body moving along a straight line is possible ?
View SolutionWhich of the following graphs show most significant deviation from ideal gas behaviour ?
View SolutionWhich of the following statement is not correc for following straight line graph :-

View Solution

